Vauvasampo - The Future Parents Fund
Finland’s fertility rate has fallen by roughly one-third since the first decade of the 2000s – the steepest decline in the European Union. The trend is driven above all by fewer and later first births. Today, almost half of all Finns reach the age of 30 without children, and Finns on average do not end up with the number of children they hoped for. Family formation is strongly stratified by household income, where higher-earning couples are also likelier to have offspring.
We propose Vauvasampo, a fund for future parents. The aim is to support young adults in achieving the family sizes they desire, to compensate parents for their investments of time and money, and to support child and family wellbeing. The core mechanism is simple: The state earmarks €5,000 for every child born in Finland. The capital is invested in publicly traded securities over several decades and grows through compound returns. The accumulated balance is paid out when they become a parent: 70 per cent at the first child (estimated to 13 200 € for each parent), 60 per cent of the remainder at the second (around 3 900 €), and the rest at the third (around 2 800 €). The sums can be calibrated to favour earlier births. Unused funds and their capital gains are returned to the fund and earmarked for the next cohort of newborns.
Because the new fund would come into full effect only after one generation, we also propose an interim model with more modest baby bonuses that would run alongside the fund for around 20 years. It would pay parents a one-off €5,000 for the first child, €2,000 for the second and €500 for the third, channelled through Finnish social security.
We built an agent-based population projection model, calibrated on register data from the 2020s, to estimate costs and fertility effects of both proposed benefits. Simulations suggest that the interim model could raise the total fertility rate from around 1.3 today to about 1.6, and the full Vauvasampo model could further raise fertility closer to 2 children per woman. This would correspond to the family size Finns themselves desire. Childlessness at age 45 and the income gap in first-birth progression could narrow almost by half.
The average annual public cost of both Vauvasampo and the interim model over 2027–2075 is estimated at around €325 million. That sum corresponds to 0.12 per cent of current GDP, 0.8 per cent of current yearly expenditure on retirement, and 23 per cent of current child-benefit expenditure in Finland. Vauvasampo is expected to be largely economically self-sustaining after one generation.
Several funds initiatives have been developed to support fertility or young citizens. Our proposal is distinct in that it targets future parents. Vauvasampo combines the Finnish word for baby (‘vauva’) with a mythical device (‘sampo’) from the Kalevala epic symbolising abundance, prosperity, and good fortune. It could represent the next phase of family-friendly Nordic politics, and a model of intergenerational solidarity in ageing societies.
Read more from Vauvasampo website>>
Heino M., Zaretckii S., Nissinen J., Berg V., Mäki M., Pelkonen T., Stone L. & Rotkirch R. (2026). Vauvasampo: The Future Parents Fund. Väestöliitto, Väestöntutkimuslaitos. Working Paper 12/2026.
Publication information
| Publisher | Väestöliitto, Väestöntutkimuslaitos |
|---|---|
| Author | Max Heino, Stepan Zaretckii, Jarkko Nissinen, Venla Berg, Miika Mäki, Tuure Pelkonen, Lyman Stone, and Anna Rotkirch |
| Publishing House | Väestöliitto, Population Research Institute |
List of Figures and Tables
List of Figures
Figure 1. Global fertility decline.
Figure 2. Total fertility rate and number of births in Finland, 2000–2025.
Figure 3. Personal ideal number of children, Finns aged 20–45, ‘cannot say’ omitted.
Figure 4. Probability of progressing to the next child by birth order, indexed to 2010 = 1.
Figure 5. Number of children of Finns by sex and origin, 2023.
Figure 6a–d. Age-specific fertility by women’s age across decades.
Figure 7. Probability of a first birth in different age groups by couple income quartile, %.
Figure 8. Annual transfers received at ages 0–22 in Finland, as a share of average annual labour income at ages 30–49.
Figure 9. Association between changes in financial support for families with children and changes in fertility rates across countries.
Figure 10. The Vauvasampo mechanism: an earmarked investment at birth, multi-decade compounding, and parity-staggered payouts upon childbearing.
Figure 11. Estimated annual costs of the Vauvasampo Parent Fund and the interim model.
Figure 12. Annual population update cycle.
Figure 13. Simulated versus observed parity progression ratios (PPRs) in 2022 across 40 model runs.
Figure 14. Projected macro-level fertility outcomes until 2076 with and without the baby bonuses (interim and fund bonus).
List of Tables
Table 1. Lifetime contributions of parents and childless working-age adults in 12 countries.
Table 2. Vauvasampo fund for future parents: benefits and possible objections.
Table 3. Calibrated parameter values of the agent-based model with parameter bounds.
Table 4. Financial incentives and fertility: international research findings.
1. Background
The objective of this working paper is to introduce a new fund to support parents and family formation. The Introduction provides a brief background of fertility decline and its current drivers, with a focus on Finland where this proposal was developed. We then present the Vauvasampo fund, its core principles and financial mechanisms, as well as an interim solution until the fund is fully working. Lastly, a microsimulation of the Finnish population allows us to evaluate expected effects of the bonuses.
1.1 Fertility decline and population ageing
Birth rates are declining globally, with average rates having roughly halved over the past 50 years. During this century, fertility decline has accelerated, undermining earlier predictions that fertility would stabilise, whether at the theoretical replacement rate of around 2.1 births per woman or at some lower level.
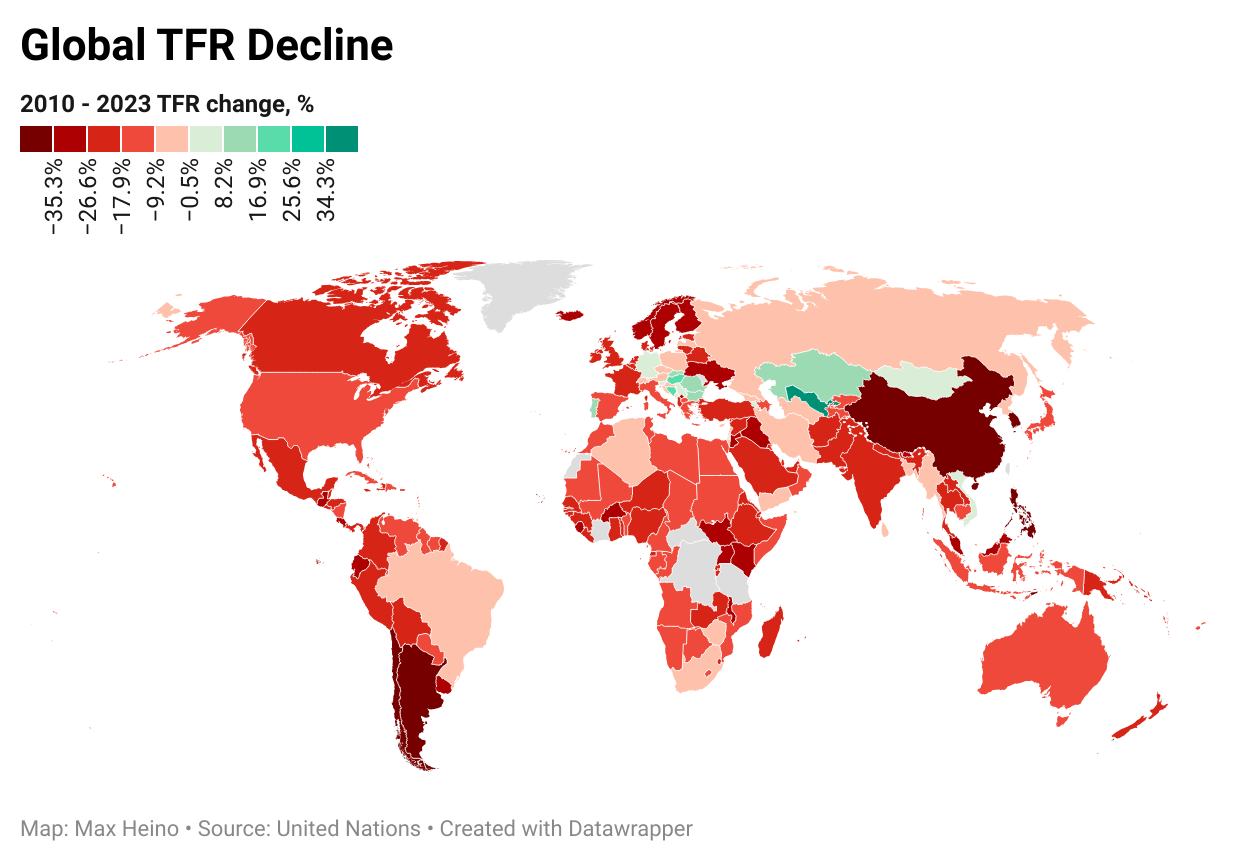
Two thirds of the world’s population live in countries where fertility is below the replacement level of 2.1. India’s total fertility rate is currently estimated at around 1.9, China’s around 1.1, and several populations in East Asia have reached levels well below 1 (UNFPA, 2025). Since 2010, the global total fertility rate has fallen by about 15 per cent, declining in each consecutive year. Around 90 per cent of all countries have experienced a decline in fertility over this period (Figure 1).
Figure 1. Global fertility decline. Change in total fertility rates, 2010–2023.
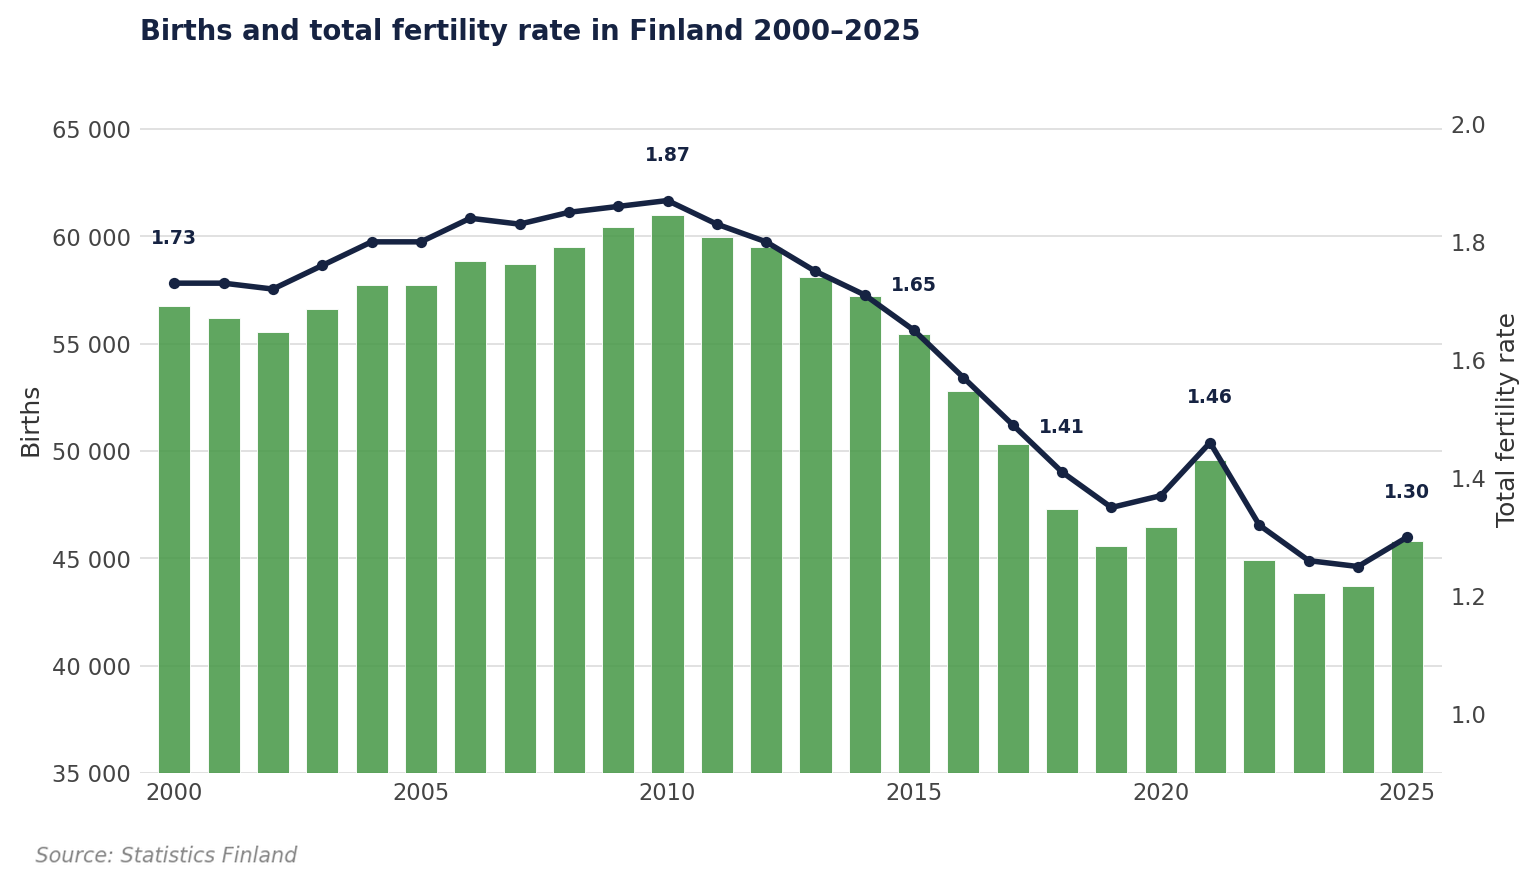
In Europe, the EU-27 average fertility rate was 1.34 in 2024. The Nordic countries have also experienced considerable declines, despite their family-friendly policies. Fertility in Finland is currently very low, and the recent decline has been the steepest in the European Union (Eurostat, 2025). At the start of the century, around 57,000 children were born annually; in the 2020s the figure is around 45,000. The total fertility rate reached above 1.8 in the late 2000s and has since fallen by roughly 30 per cent. In 2024 the total fertility rate was 1.25, the lowest in Finnish recorded history; it has stabilised somewhat since then and now hovers around 1.3 (Figure 2).
Figure 2. Total fertility rate and number of births in Finland, 2000–2025.
Fertility rates in the Nordics and across Europe are now close to going below 1.3, which has been called “ultra-low” (Yoo & Sobotka 2018). A return to a theoretical replacement rate above 2 children per woman is not necessarily a realistic or desirable policy goal (Gietel-Basten, Rotkirch & Sobotka, 2022). Yet sustained periods of total fertility rates below 1.5 herald rapid demographic change that should not be trivialised (Lesthaeghe, 2025). Theoretically, in a closed population a total fertility rate of 1.7 implies that a cohort of 100 reproductive-age individuals will produce around 85 children and 72 grandchildren, representing a relatively modest decrease. A rate of 1.3 would correspondingly indicate 100 individuals have 65 children and only 42.5 grandchildren – a significantly faster decline where the population more than halves within a century.
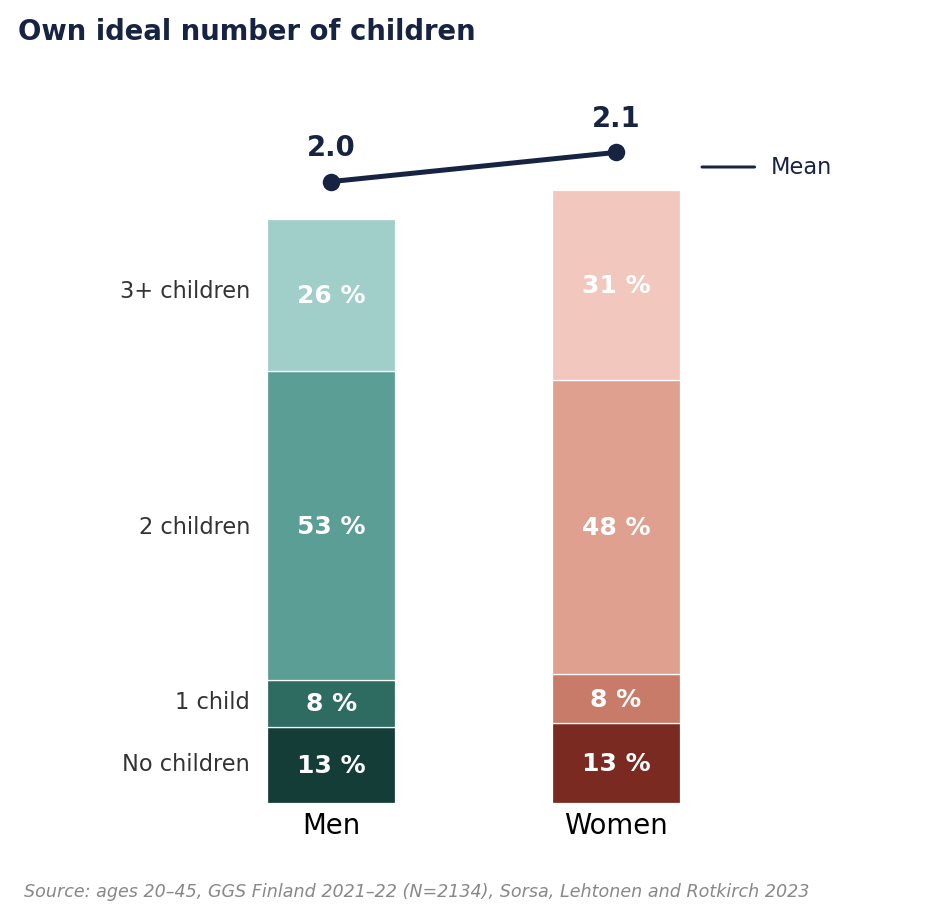
Europeans want at least two children on average and Finns are no exception: men aged 20–45 desire around 2.0 and women around 2.1 children on average (Figure 3). Yet if current trends continue, Finns will end up with 0.5 children less on average, as cohort fertility rates approach 1.5 children per woman over their lifetime (Hellstrand, Nisén & Myrskylä, 2020; Sorsa et al., 2023).
Population ageing typically dampens economic growth. The mechanisms include a shrinking labour supply, a reallocation of the workforce towards less productive service sectors, and slower productivity growth. Finland has been among the most rapidly ageing countries globally, and evidence suggests this was associated with economic setbacks.
Figure 3. Personal ideal number of children, Finns aged 20–45, ‘cannot say’ omitted.
After 2010 Finland’s dependency ratio worsened markedly faster than in similar countries, and this phase of population ageing was associated with 15.6–27.5 per cent lower per-capita GDP and 8.4–13.9 per cent lower total factor productivity relative to a synthetic control (Kotamäki & Lehtimäki, 2025).
Together with weaker growth and a tightening fiscal constraint, ageing also reshapes the welfare state. In Finland social spending directed at families with children was about half of social spending tied to ageing in the 1990s; by 2024 it had shrunk to about a quarter (THL, 2026). Population ageing accounts for some of the gap, but support for families with children has weakened more than many other social insurance benefits. For instance, the monthly child benefit has not been adjusted for inflation, and so the purchasing power of the child benefit paid for the first child has fallen by about 32 per cent since 1994 (Nygård et al., 2019; Ministry of Social Affairs and Health, 2022).
Combined with broader public-sector consolidation, the trajectory risks producing a vicious circle in which an ageing society is no longer able to invest in its future — that is, in children and young people (cf. Kearney, 2026). The proposed fund aims to prevent this from happening.
Fertility decline and population ageing
- Fertility is very low in increasingly many countries, including Finland.
- Finns wish to have around 2 children on average.
- Sustained fertility rates below 1.5 implicate rapid demographic change.
- Low fertility has accelerated population ageing in Finland, hampering economic growth.
1.2 New barriers to family formation
Fertility decisions are shaped by many factors. A stable partnership, sufficient income, access to childcare and other services, and family-friendly workplaces have for many decades been associated with higher fertility and improved family wellbeing (e.g., Sobotka et al., 2019). Since the 2000s, the family-formation landscape has also changed. Demographers have shown how factors such as a decline in stable partnerships and changing narratives of the future shape childbearing decisions among young adults (e.g., Rahnu and Jalovaara, 2023; Vignoli et al., 2022). Below we highlight two specific factors: the timing of births and the role of income. These are certainly not the sole factors driving or explaining fertility decline: digitalisation and value change also accelerated fertility decline in the 2010s (Golovina et al. 2024; Rotkirch, 2024 and 2025). However, we believe policy initiatives need to measure up to the scale of societal change in other domains.
1.2.1 Fewer and later first births in Finland
Finland’s fertility decline is driven above all by fewer first births. The fall in first-birth probabilities accounts for more than four fifths of the decline in the 2010s and 2020s. Compared with 2010, families are now almost half as likely to have a first child (Figure 4).
Figure 4. Probability of progressing to the next child by birth order, indexed to 2010 = 1; first, second, third, and fourth births, relative to women’s age groups.
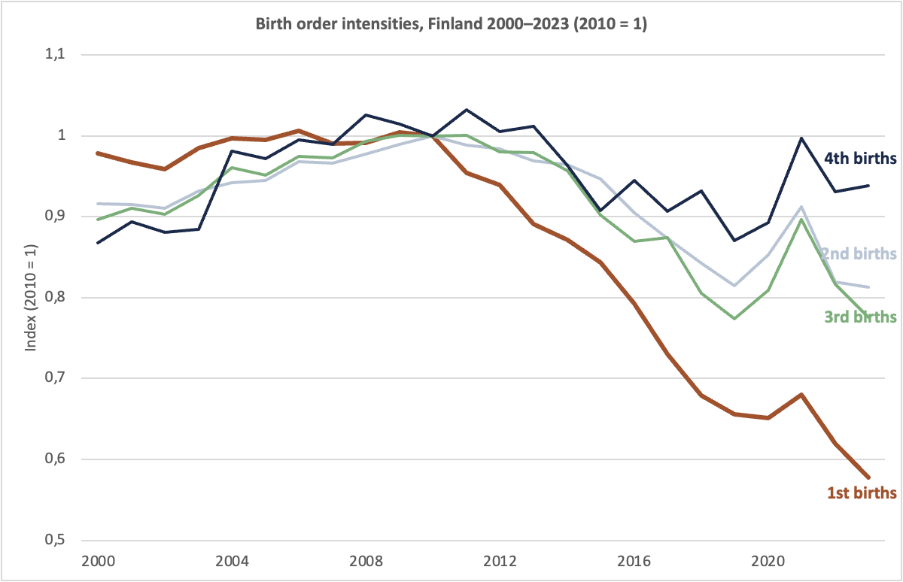
The likelihood of having a second or third child has also declined since 2010, but less steeply. In a European comparison Finland still has a high share of families with three or more children (Eurostat, 2025).
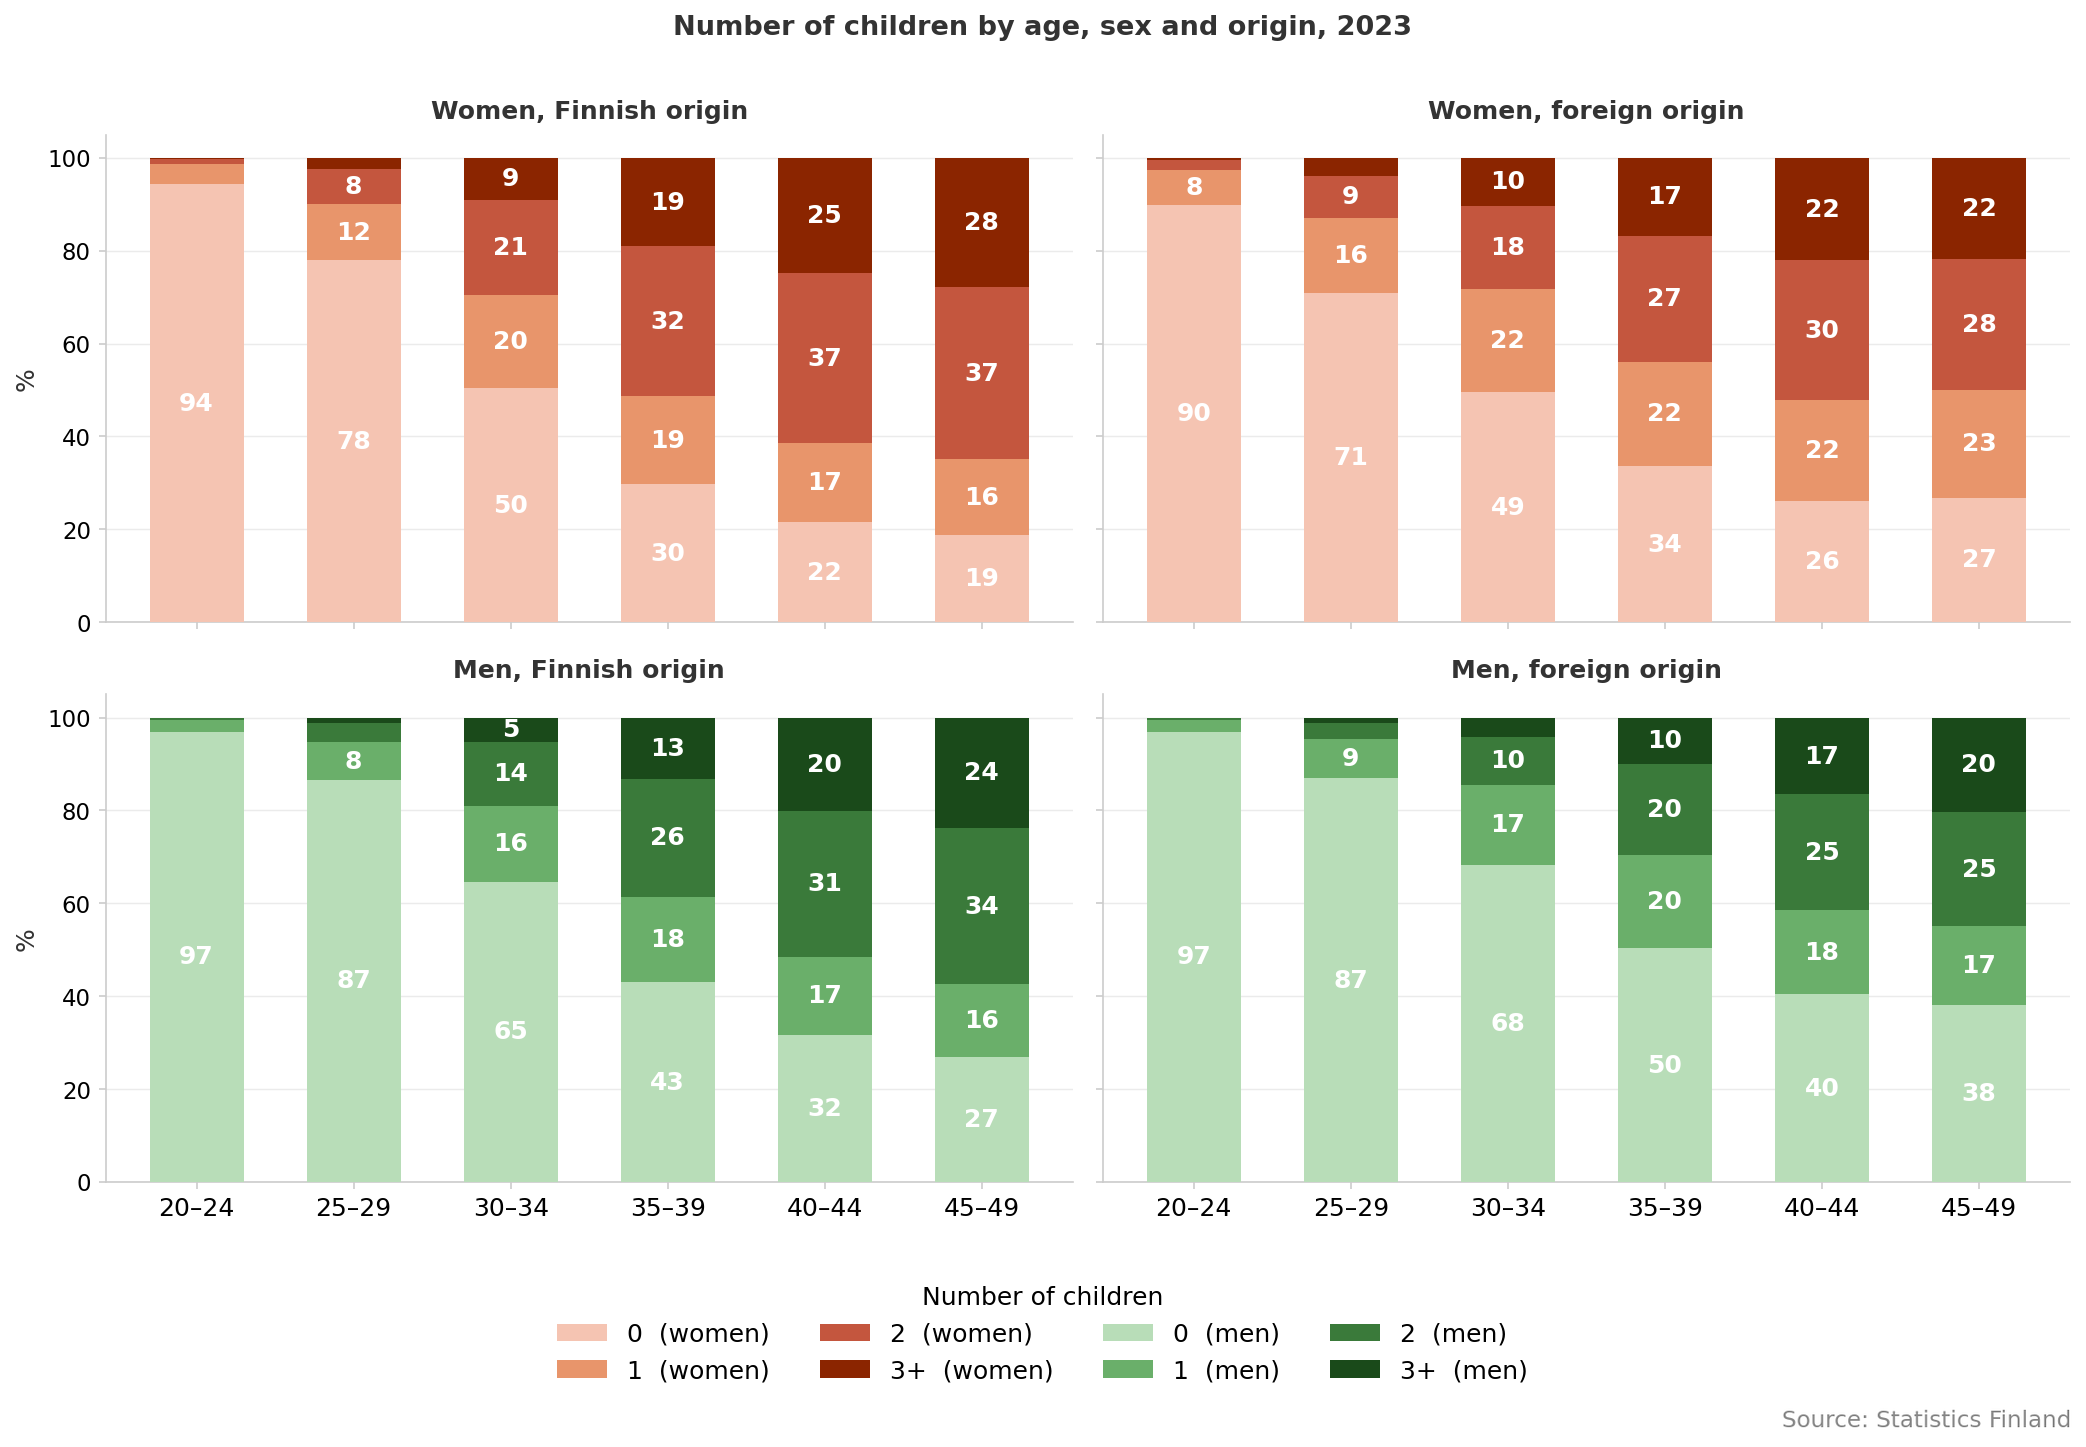
As a consequence of fewer first births, the share of childless adults grows. Almost two in three men and one in two women aged 30–34 have no children (Figure 5). Although we cannot know how many will eventually become parents, lifetime childlessness is likely to rise further (Jalovaara & Miettinen, 2025). Contrary to common belief, the challenge of family formation is common also among immigrants in Finland (cf. Estévez & Rotkirch, 2026). As illustrated in Figure 5, at least one in two Finns aged 30–34 is childless. Among 35–39-year-olds, more than 30 per cent of women and more than 40 per cent of men are childless, somewhat more often among those of immigrant background than among Finns of native origin.
Figure 5. Number of children of Finns by sex and origin, 2023.
Female fecundity peaks in the twenties and declines steeply after age 35 (e.g. Tiitinen, 2022). Male fecundity also declines, especially after age 40, although less steeply than in women. In addition, the average age difference between partners in high-income countries is about two years, which means that very few men become fathers after age 40. Having children at a younger age improves the chances of having all the children one wants.
In Finland, fertility has fallen most sharply among women aged 20–29 over the past three decades. As the average age at first birth has shifted from 26 to 30 (Figure 6a), also second and higher order births have shifted to later ages (Figure 6b). Fewer women below 30 have first births, and fewer women below 35 have second or higher-order births. Similar trends can be observed for all high-income countries (Figure 6c-d).
Figure 6a–d. Age-specific fertility by women’s age across decades
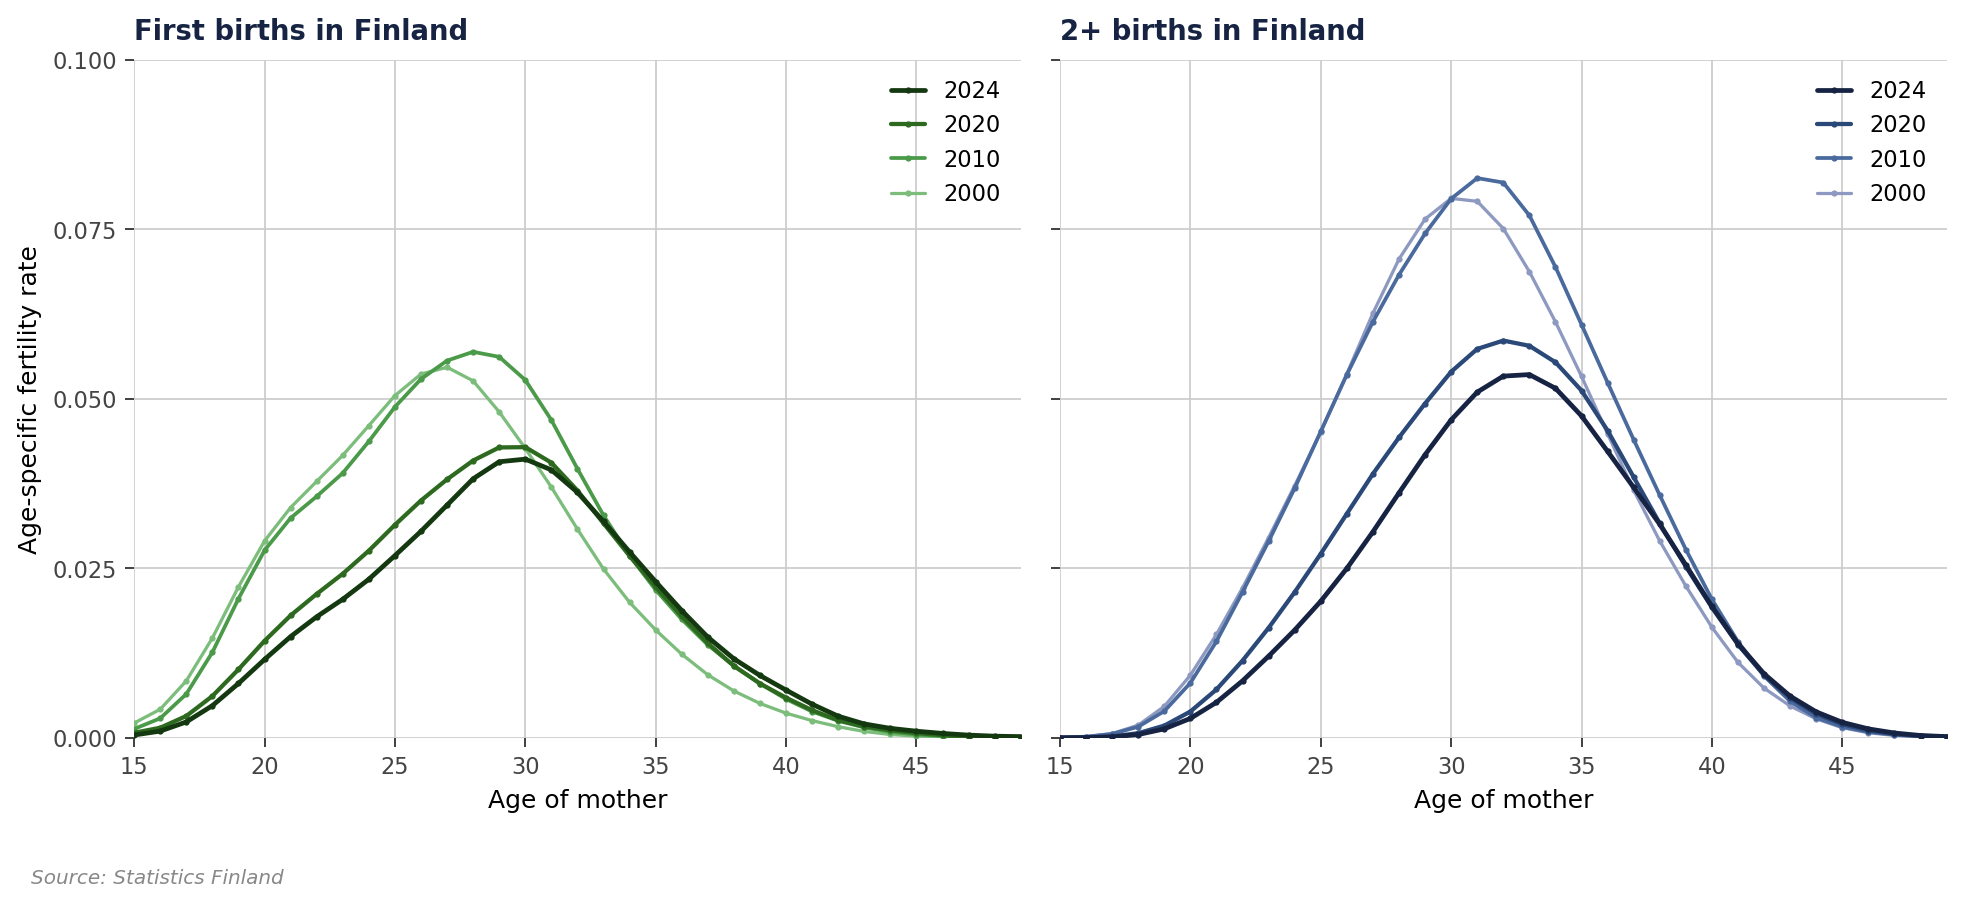
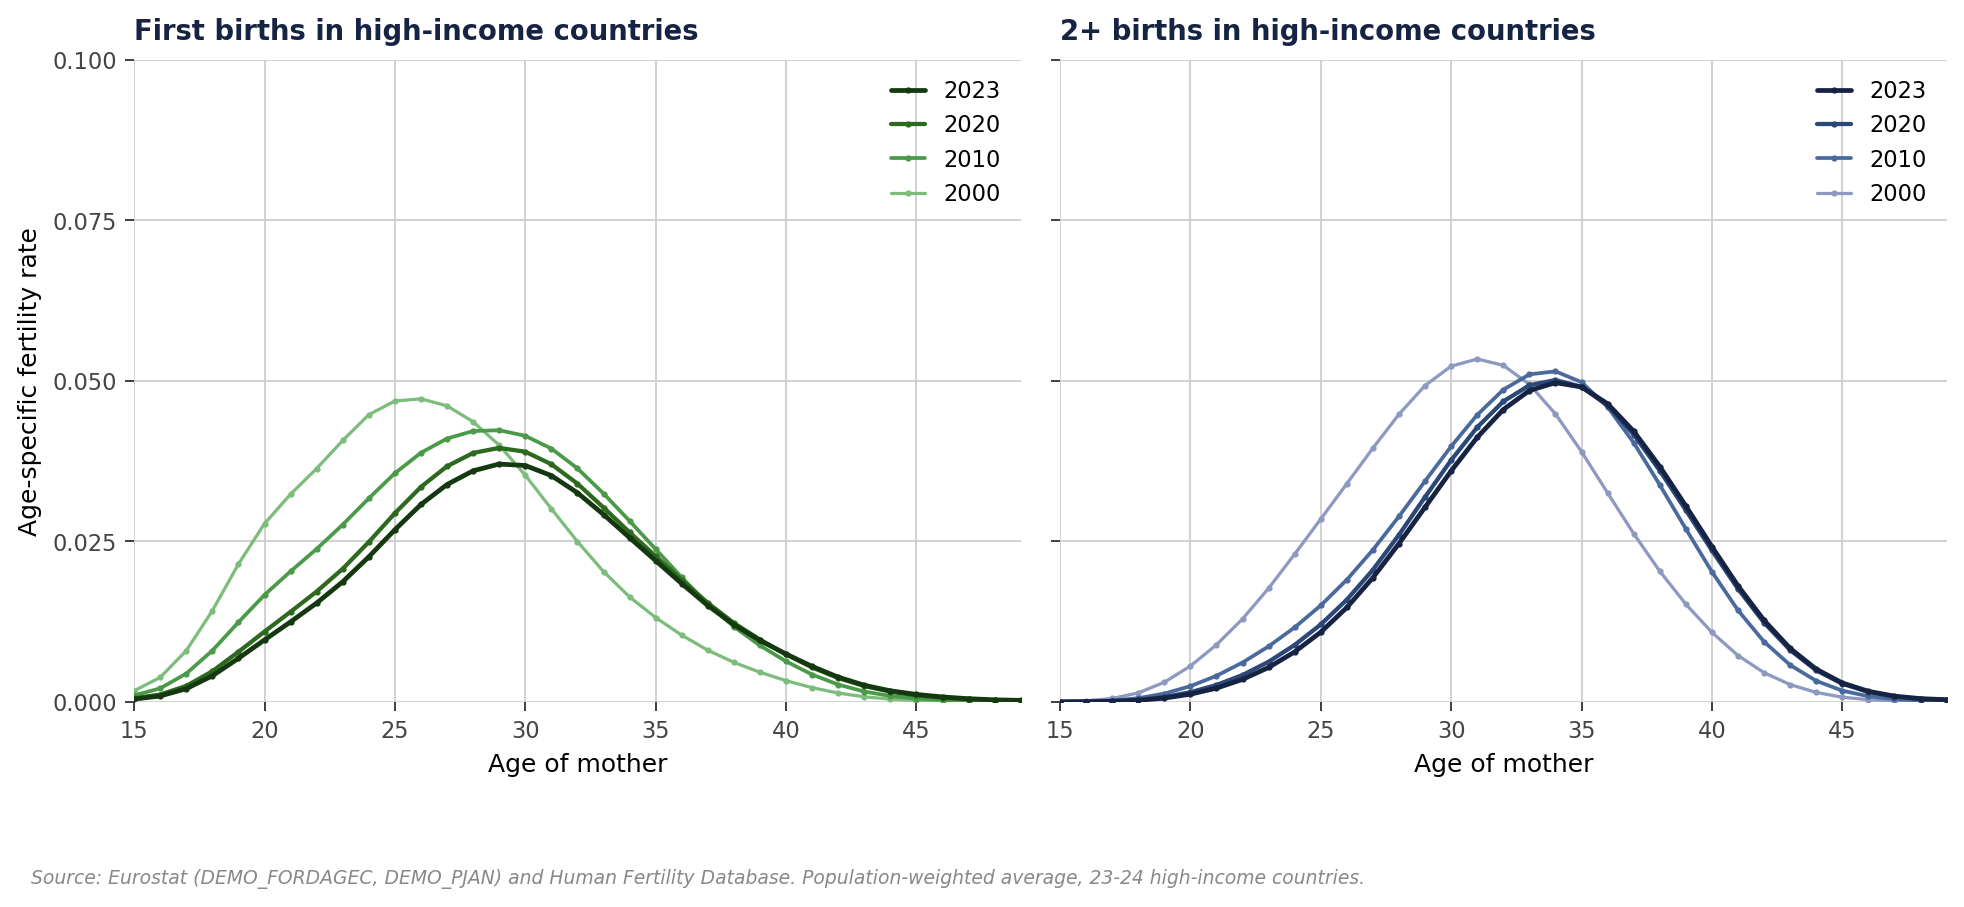
Although some people now have their children at an older age (and increasingly often with the help of assisted reproductive technology), fertility among older age groups (35+ years) does not, at the population level, currently compensate for declining fertility under age 30; and proportions of life-time childless individuals is likely to increase in high-income countries (see e.g. Beaujouan & Neels, 2025).
The effect of societal crises on family formation further stresses the importance of timing. The likelihood to have a first child typically declines during economic crises. When births are concentrated in a narrower window — currently, to the ages 30–34 — there is less room to delay childbearing, meaning that economic crises and uncertainty more readily result in lifetime childlessness (Sobotka et al., 2011; Neels et al., 2013; Shaw, 2025).
Because the timing of first births is a key driver of contemporary fertility decline, any policy measure that affects timing matters. The need to better support and incentivise those wishing to have children earlier (before 30) is emphasised in both the Finnish and Norwegian government reports on fertility (Rotkirch 2024; Hart et al. 2024). Current Nordic family-policy benefits do not incentivise earlier childbearing; on the contrary, earnings-related benefits encourage later transition to parenthood. The Norwegian report proposes, among other measures, substantial additional support for parents who have a first child before age 30 (Norway’s Birth Rate Committee, 2026).
First births
- Recent fertility decline is largely due to fewer first births. Second and higher-order births in Finland remain comparatively common.
- Fertility among women in their twenties has fallen sharply, and fertility above age 35 has stalled or increases very marginally both in Finland and other high-income countries.
- Policies seeking to support family formation should address the timing of first births.
1.2.2 Income gradients in family formation
The postponement and decline of first births are partly explained by a weakening of stable partnerships among young adults today. But childlessness in Finland has also increased among those who cohabitate or are married (Hellstrand, Nisén & Myrskylä, 2022). Family formation is therefore also a challenge for stably partnered individuals.
Figure 7. Probability of a first birth in different age groups by couple income quartile, %
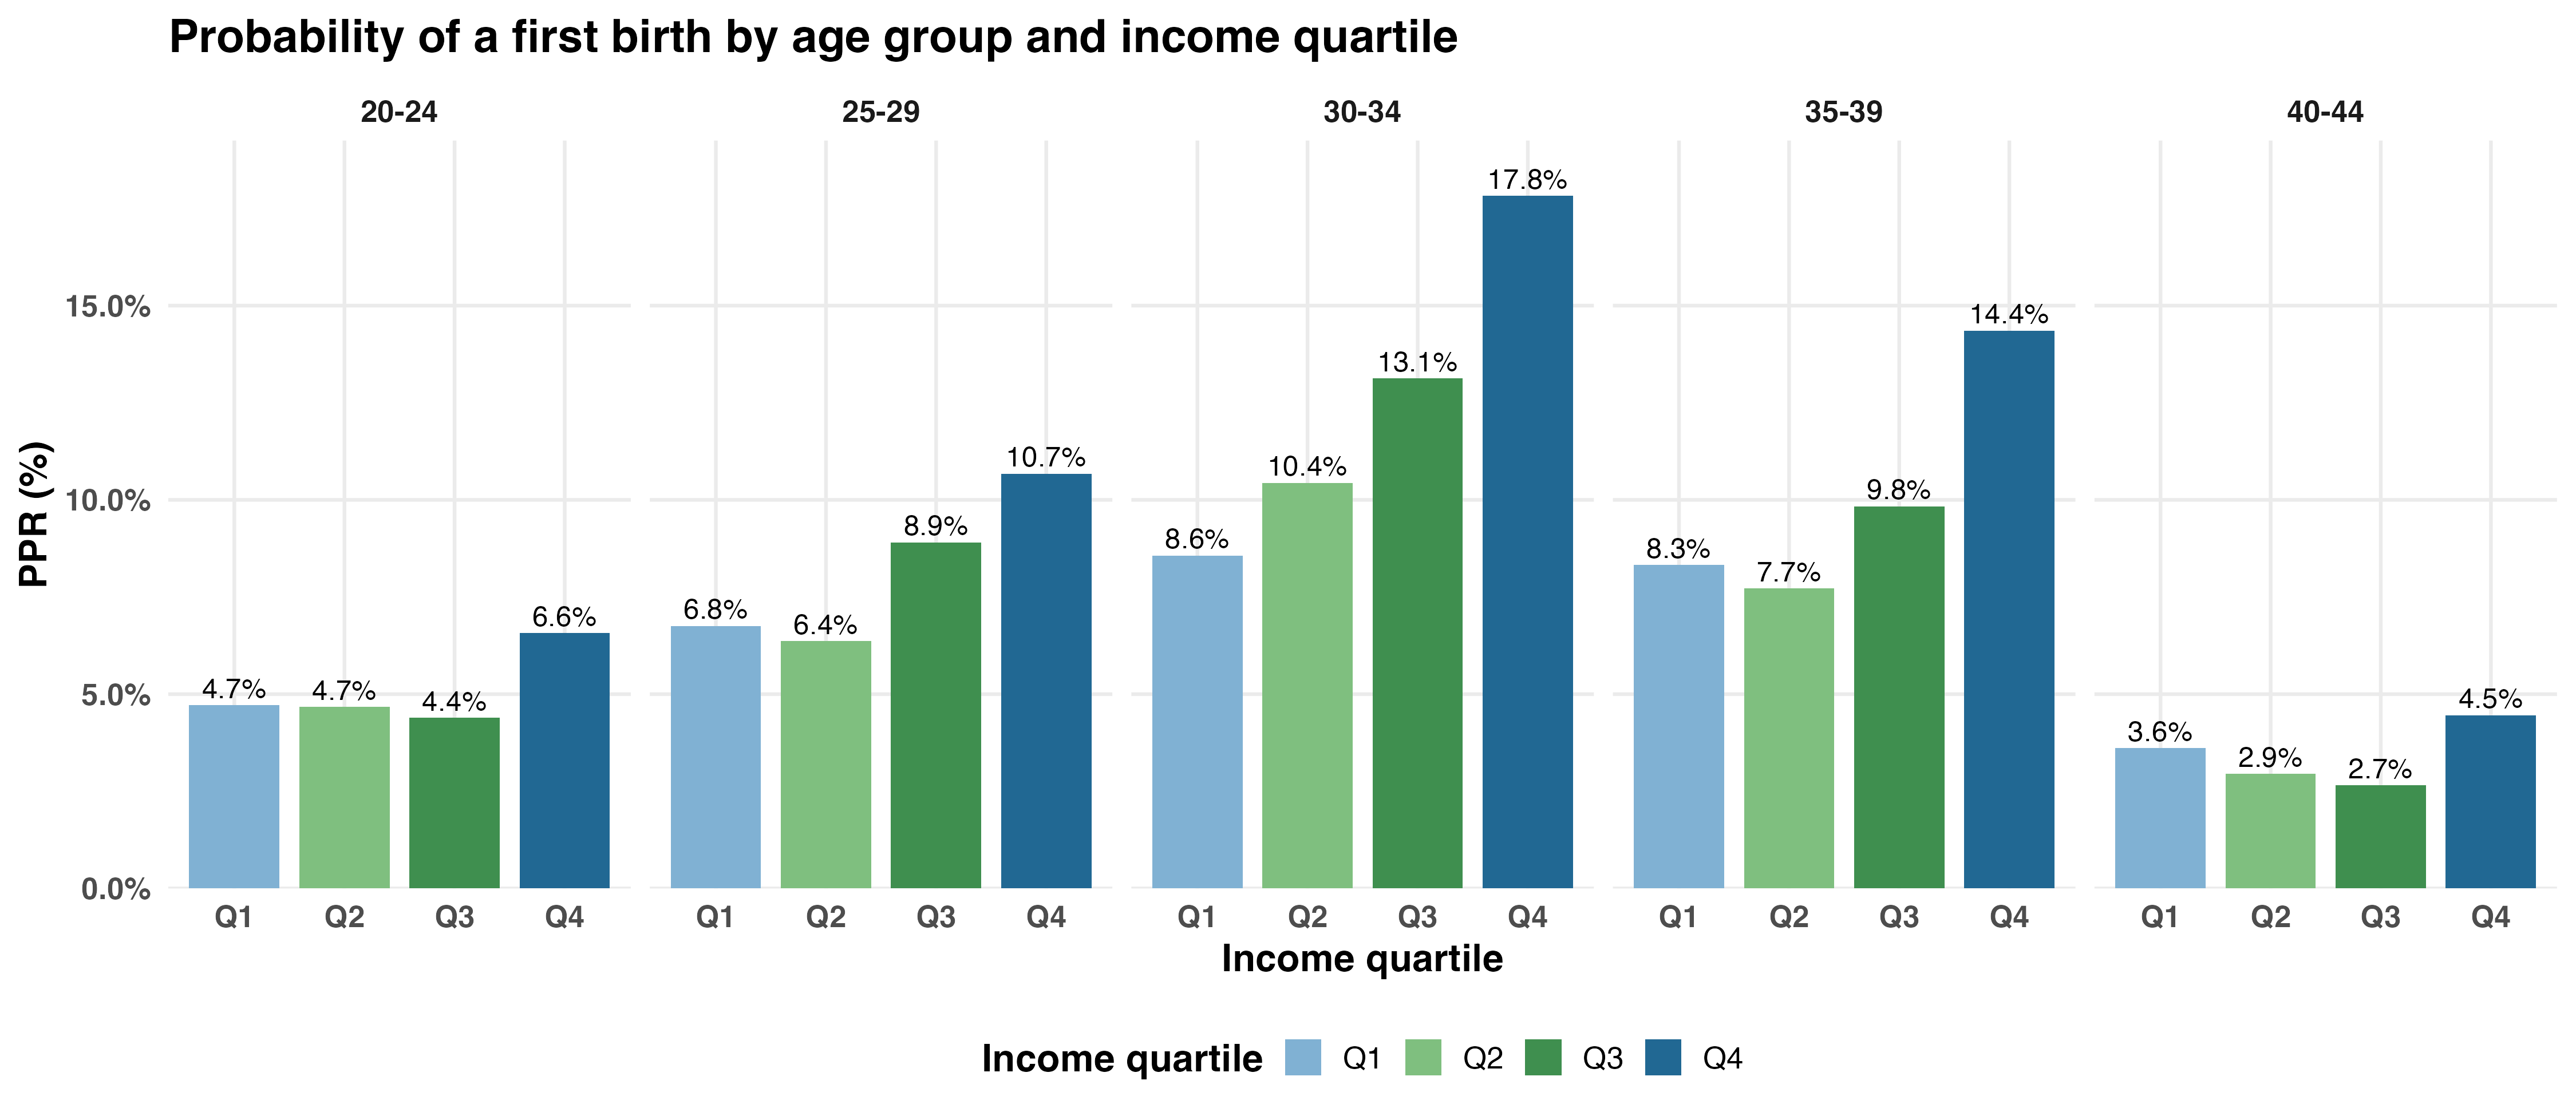
This section discusses adults in Finland in stable unions, defined as cohabiting or marital unions lasting at least two years. This focus reflects the assumption that new childbearing incentives would mostly affect partnered rather than single individuals. We consider only different-sex couples, as same-sex couples are relatively few. We first examine how joint annual disposable income in 2021 relates to the probability of having a child in the year 2022.
Couples in the highest income quartile are more likely to have a first child in every age group (Figure 7; for second and subsequent births, see Figure 12). Relative to the lowest income quartile, the probability of a first birth was 39 per cent higher among couples in the highest income quartile at ages 20–24, 58% higher at ages 25–29, and 108 per cent higher at ages 30–34. This partly reflects variability in income trajectories over the life span: for instance, individuals with lower education may both enter the labour market earlier and have their children earlier. Nevertheless, it also signals actual socioeconomic inequality: in the most common ages for childbearing, the most affluent couples are roughly twice as likely to have a first child as those in the lowest income quartile.
The figures above describe the association between household income and having a child, which is likely influenced by several other factors: labour-market attachment, unfinished studies, or a sense of being ready for parenthood. Survey results indicate that many other factors shape couples’ childbearing intentions. In the Family Federation’s Family Barometer surveys, childless young adults most often said lifestyle- and relationship-related factors were the reasons not to become a parent: the options “I would have to give up my current lifestyle”, “I want to do other things that interest me” and “Children are not relevant in my relationship” were each chosen by 50–60 per cent of partnered respondents aged 25–34. A new financial incentive for the first child would hardly directly alter these reasons. About 30–40 per cent of respondents rated labour-market, childcare, housing and work-related factors as important (“I want to advance in my profession or career”, “Combining work with a small child would be difficult”, “My own or my family’s financial situation prevents it”, “Our current home is too small”). These are the kinds of perceived barriers a new financial support could more plausibly address. When the analysis was restricted to those who both wanted children and had passed their self-described ideal age for parenthood, “own financial situation” was the most common reason for postponing childbearing, indicating financial barriers are very relevant for this particular demographic. (Family Barometer survey 2022, unpublished result; for the survey report see Sorsa et al., 2023; on reasons for postponement more broadly see Savelieva et al., 2023.)
Beyond the objective association with income, family formation can also be examined through the assumptions prospective parents make about how having a child would affect their time use and income. Lappegård et al. (2025) show that subjective economic uncertainty has a significant effect on fertility among childless 25–34-year-olds in Norway. The study followed individuals over four years and found that the experience of financial difficulties reduced the probability of a first birth by 26 per cent over three years, even after adjusting for objective factors such as employment status.
Family formation and couple income
- Finnish couples with higher income are more likely to have a first child in every 5-year age group.
- In the most common ages for childbearing, the most affluent couples are roughly twice as likely to have a first child as those in the lowest income quartile.
- Many other factors are likely to shape this association between income and family formation, such as expected effects on lifestyle.
1.3 Compensation of parental time and expenses in Europe
Finland has, in many respects, a generous and well-functioning family policy. Children, mothers and families fare on average rather well, and family-related benefits compensate part of the cost of raising children. Even so, income is strongly associated with who has children during the prime reproductive years, as we showed above.
Another aspect on family formation is the fairness of the position of parents vis-à-vis non-parents of the same income groups. In Finland, like most Western countries, parenthood imposes substantial economic and social costs, particularly frontloaded during the early years of child-rearing. Yet the full societal value of reproduction within the family is not acknowledged (Vanhuysse et al., 2023; Gál & Vanhuysse, in preparation). The costs parents face in raising the next generation include direct expenditures, lost income, and time commitments, only partially alleviated by public subsidies. Vanhuysse et al. (2023) estimated the overall contributions of parents to society across European countries. They used the National Transfer Accounts framework, which captures detailed information of both monetary and time transfers. The analysis includes public transfers (e.g., taxes and benefits), familial money transfers (market goods like food, clothing, utilities, and imputed housing rent), and time transfers (unpaid labour such as childcare valued at specialist replacement wages).
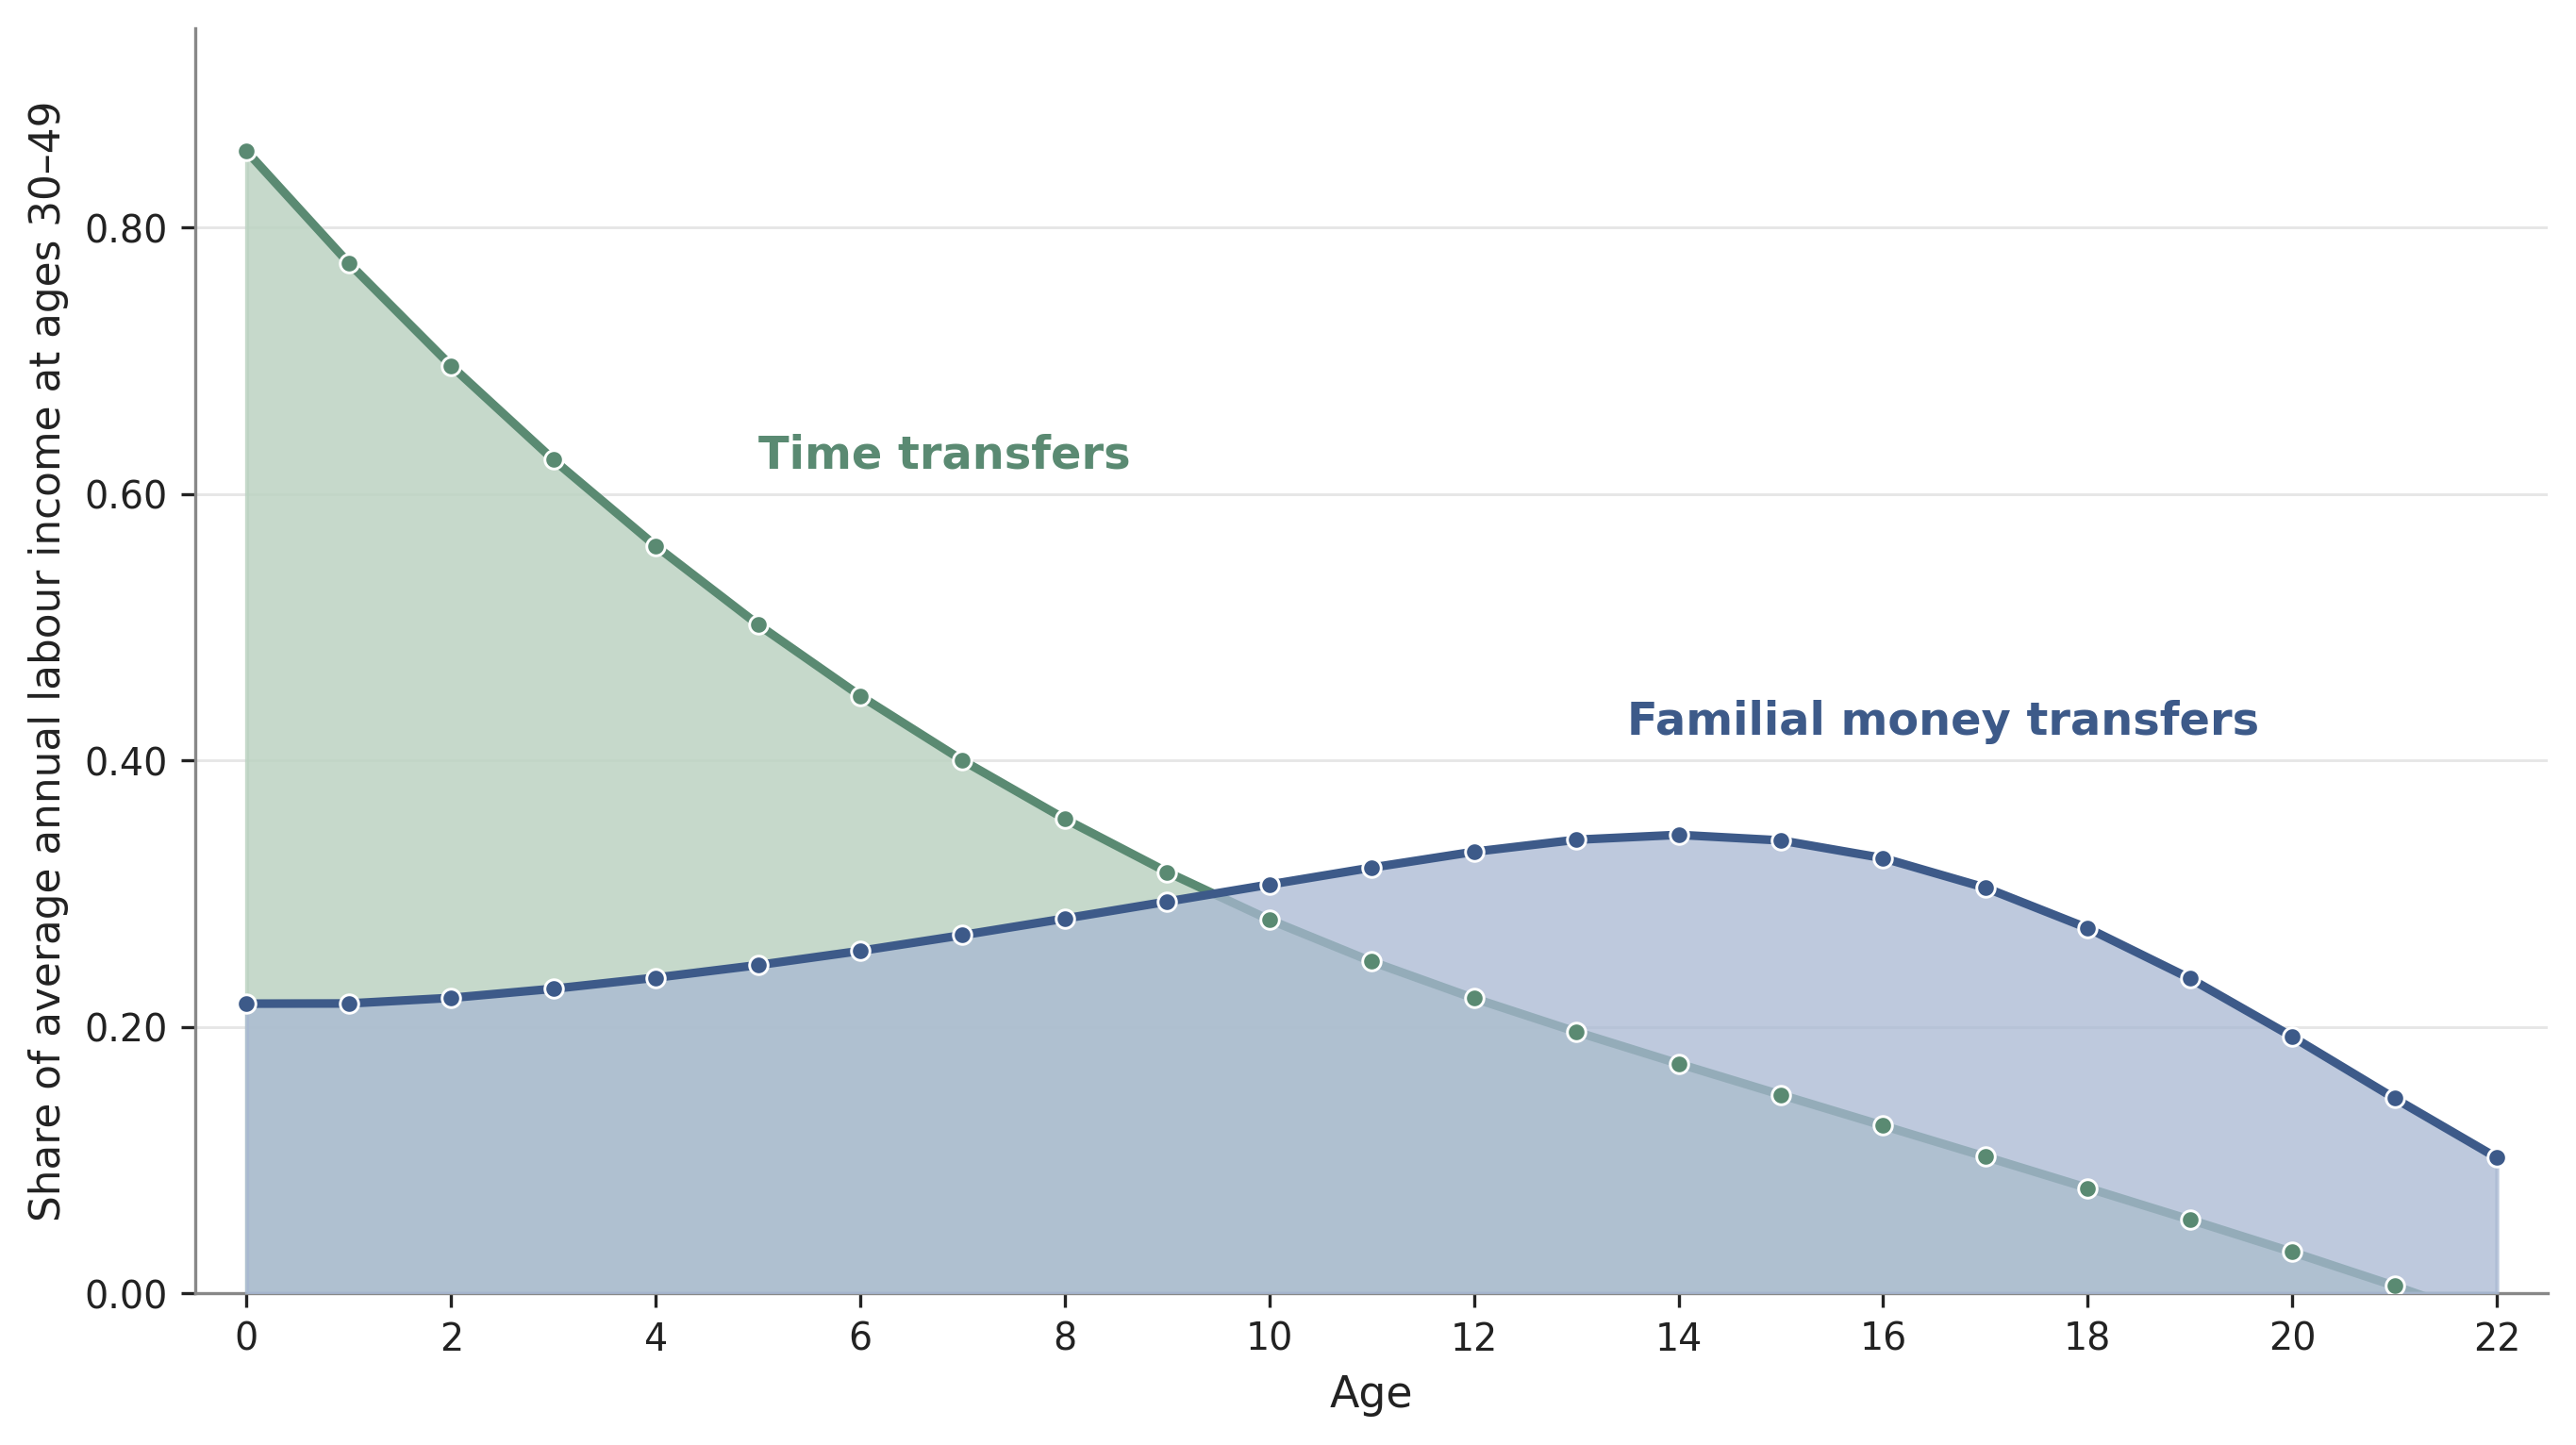
The relative contribution or reception of transfers will vary across age. Figure 8 depicts children and young adult’s receipt of familial money (blue graph) and time (orange graph) [SR7.1]transfers from ages 0-22, scaled as a fraction of per capita labour income for the 30-49 group (based on EU12 averages from EU-SILC, HETUS, and related surveys). It illustrates how time transfers are very high early in life, reaching up to 1.0 units at age 0 due to intensive caregiving, and then decline with age. Money transfers are stable before tapering as the average young Finnish adult transitions into the labour market.
Figure 8. Annual transfers received at ages 0–22 in Finland, expressed as a share of average annual labour income at ages 30–49.
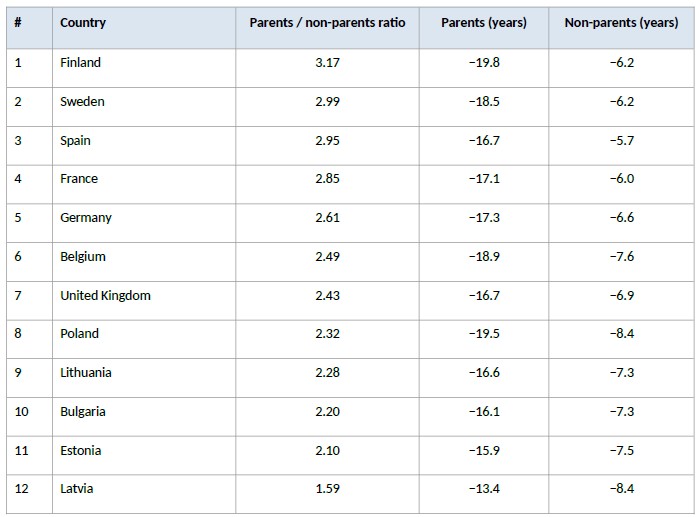
Next, the contributions of parents are compared to those of non-parents. Among the 12 European countries analysed, Finland ranks as the most expensive in relative terms. In Finland, parents contribute on average 3.17 times more resources than non-parents over their working lives. Parents give more transfers than they receive, and their total sum of monetary and time transfers is estimated to almost 20 years (19.8) of prime-age (30-49) labour income. Non-parents of working-age also on average contribute more than they receive, on average around 6 years (6.2) of labour income. The “parents-to-non-parents” ratio is calculated as 19.8/6.2=3.17. Finland has the highest ratio in the comparison. (Table 1).
Table 1. Ratio of lifetime contributions of parents and childless working-age adults in 12 countries.
Compensation to parents
- Finland also has comparatively high net costs of parenthood by international standards. A parent raising a child was estimated to produce 3.17 times more resources over their working life than a childless adult in Finland.
- A comparison of 12 European countries of public transfers and intra-familial money and time transfers found Finland is the country in which parents transfer the most to societal reproduction relative to childless adults.
1.4 Cash support to parents and fertility
It is very often claimed that financial incentives cannot affect family-formation decisions. This section therefore briefly summarises the research evidence on the link between financial incentives and fertility. We compiled a summary of existing research in Appendix Table 1.
Several broader reviews of policy effects on fertility have appeared in recent years (Gauthier, 2007; Olivetti & Petrongolo, 2017; Bergsvik et al., 2021; Raute, 2019; Gauthier & Gietel-Basten, 2025). The more recent since 2017 often represent a methodological shift towards more credible causal inference, drawing on experimental and quasi-experimental designs.
When assessing the fertility effects of individual policy measures, child care provision is most clearly and consistently associated with higher fertility in Northern and Central Europe (Sobotka et al., 2019; Bergsvik et al., 2021). Parental leaves can also serve to increase fertility, although findings are mixed and context-dependent (Thomas et al., 2022).
Cash transfers (economic compensation to parents such as monthly child benefits, baby bonuses, or tax credits) may also have fertility effects. The fertility effects vary in size and duration, as well as by demographic groups and birth cohorts. Cash transfer effects may also vary by birth order of the child; and are occasionally specifically targeted at particular birth orders (e.g., a higher bonus for the third child). (Bradshaw & Attar-Schwartz, 2011; Luci-Greulich & Thévenon, 2013.) How a financial support is administered may matter: a one-off lump-sum benefit may differ in its effects on childbearing decisions compared to a benefit paid annually or monthly per child (Sobotka et al., 2019).
Researchers of the fertility effects of family policies stress that one single measure is not enough. It takes a village to raise a child, and an entire policy package to make a family-friendly society. Bergsvik and colleagues, for instance, emphasise that investments in early-childhood education and healthcare may matter more for child wellbeing and the reduction of inequalities than cash transfers or parental-leave reforms (Bergsvik et al., 2021). The most effective interventions respond to the diverse needs of different families and individuals at different life stages, from gender equality and flexible working hours to functioning services and adequate housing. (Sobotka et al., 2019; Hart, Bergsvik et al., 2024). For Finland this means that the starting point is favourable: the country has invested in early-childhood education and healthcare, and is not building its family policy from scratch.
Some studies find that a cash transfer affects timing of children more than the eventual number of children, the so-called tempo vs quantum effect. For instance, Bergsvik et al. (2021) conclude that the principal channel through which direct cash transfers affect childbearing is most likely through timing decisions. Such timing effects can be negligible in the case of a second child being born some months earlier than it would have been born without any benefit. In Finland’s situation, however, the key challenge is that first births have become fewer and later. The ‘to have or not to have’ context with record-high lifetime childlessness implies that any timing effect on first-borns should have a real effect on lifetime fertility.
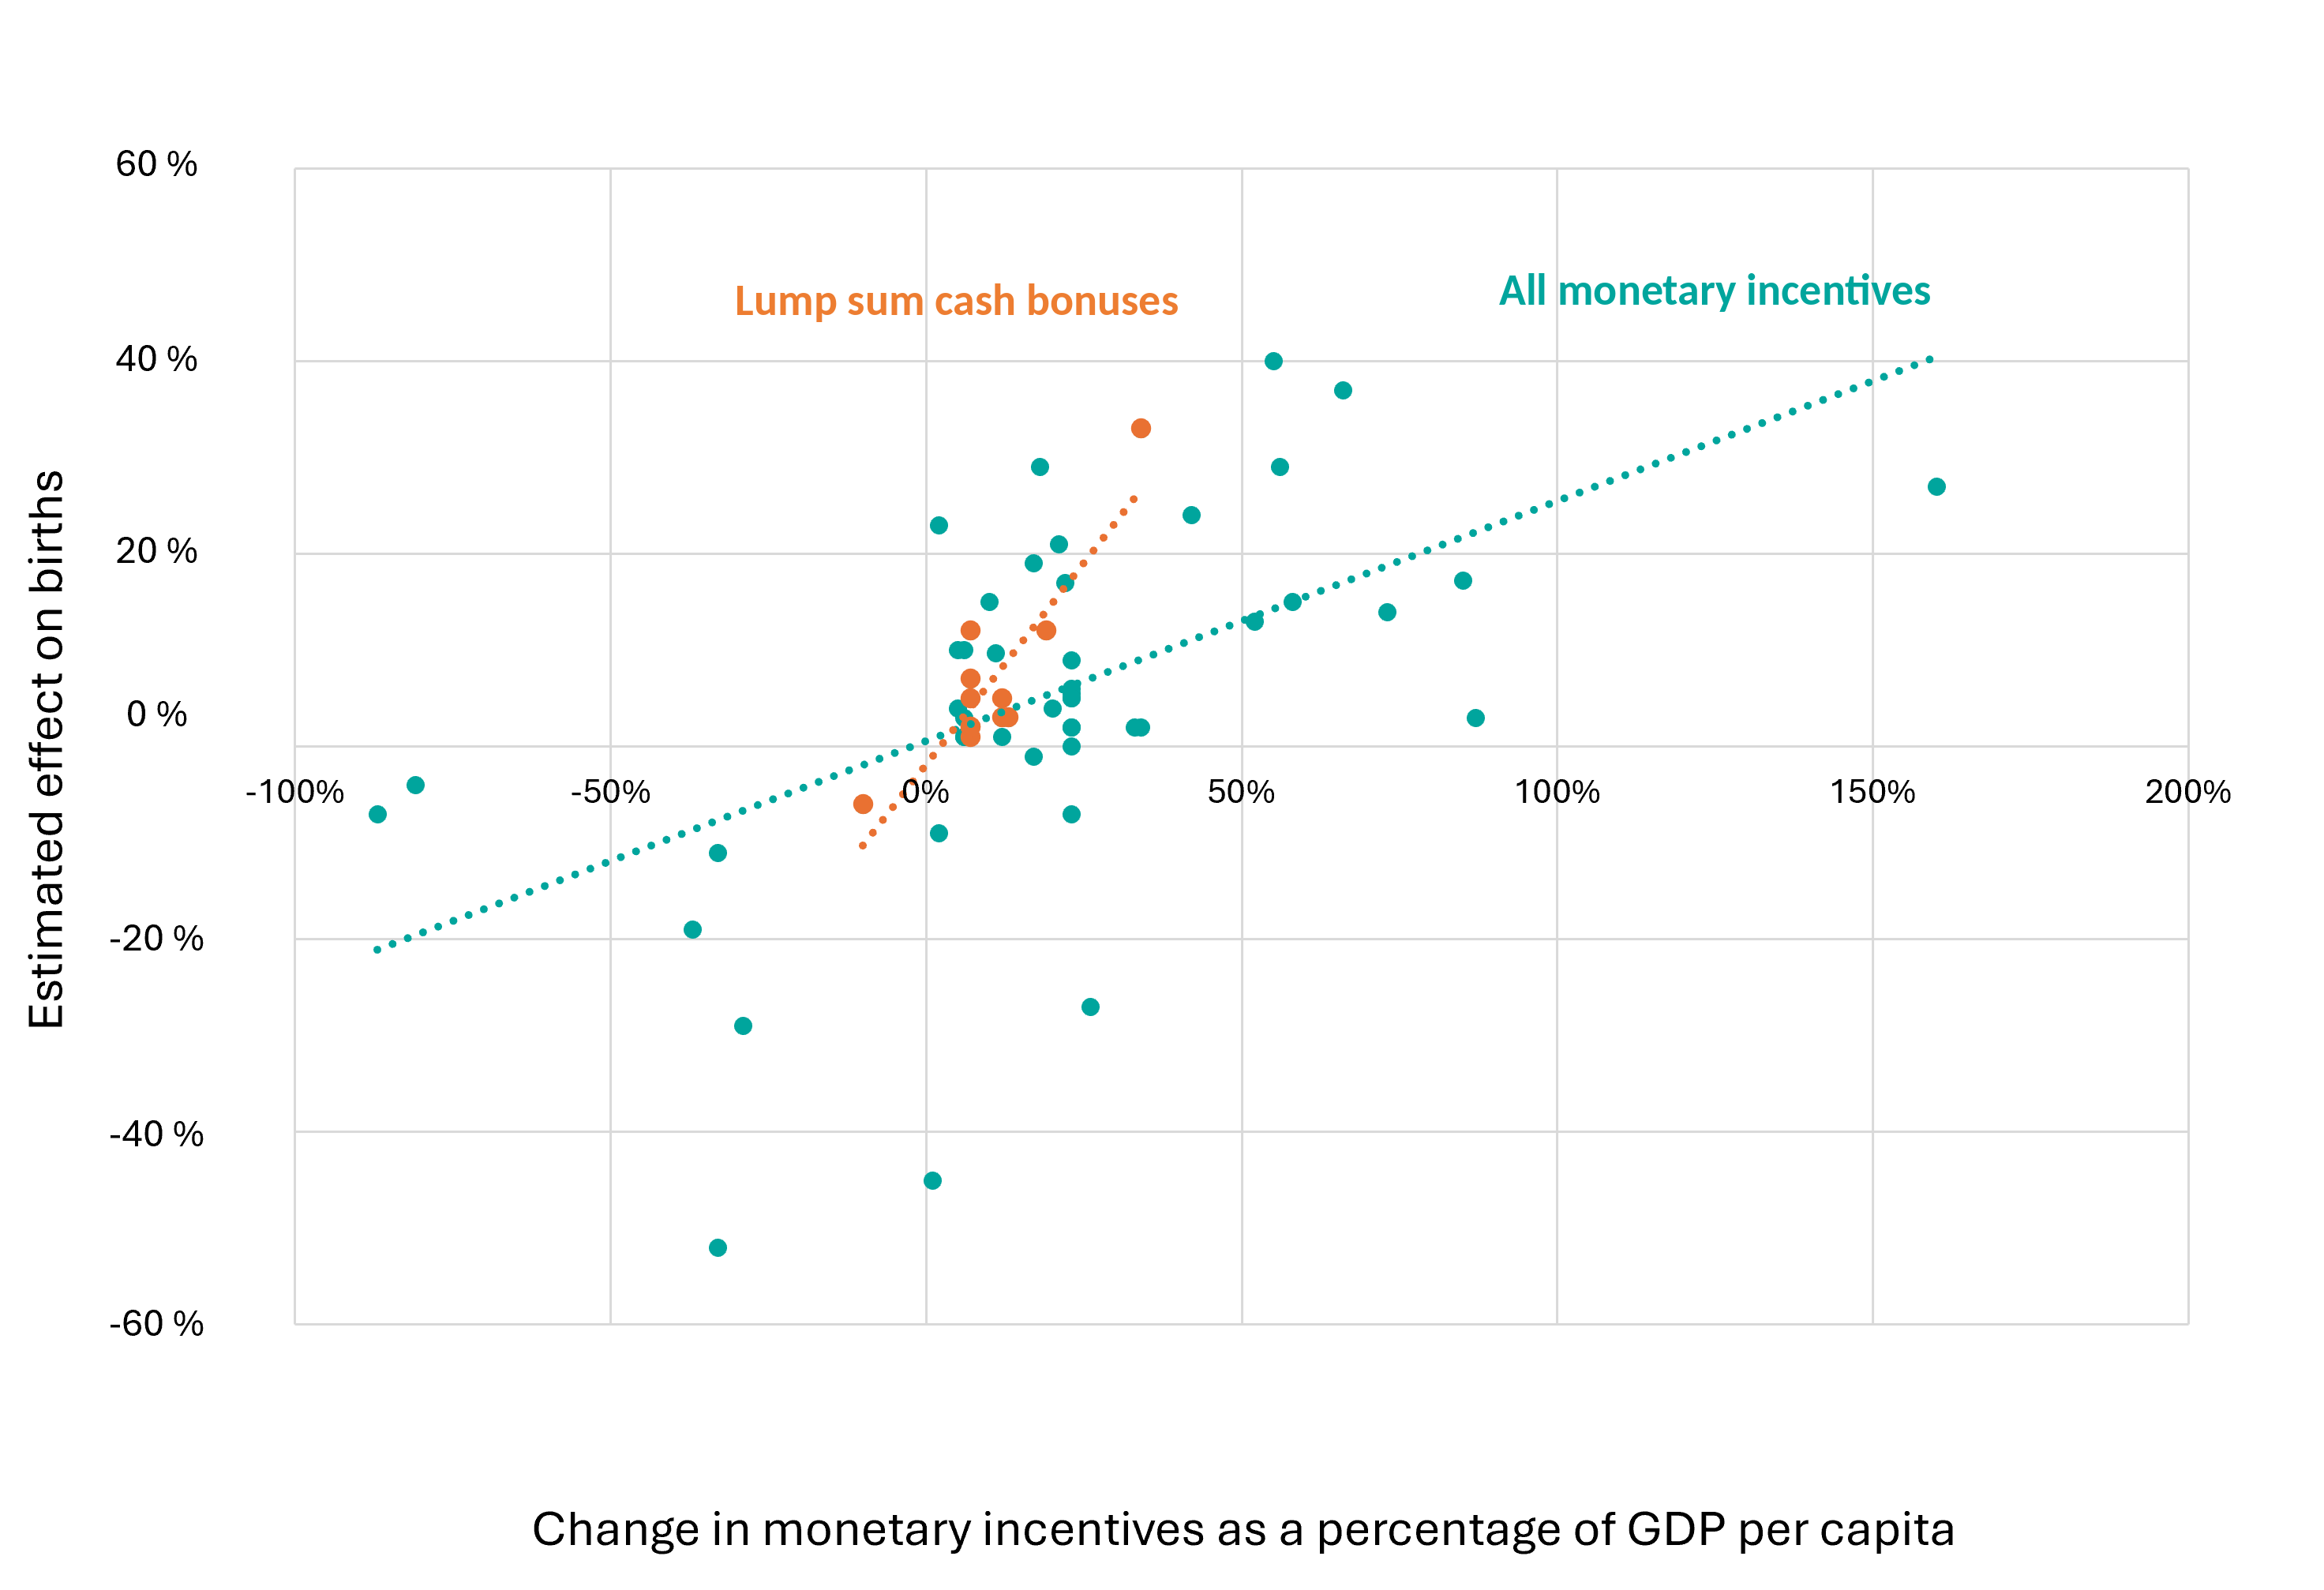
A recent working paper found that the size of the compensation matters. Lyman Stone (2025) synthesised the findings of 43 previously published studies, collectively evaluating the fertility effects of 58 distinct changes in financial support to parents. Financial supports included child allowances, baby bonuses, increases in maternity pay, tax benefits, and home care allowances. For each form of support, the percentage change in births was calculated and assessed either across the general population or within the specific demographic group targeted by the intervention. The magnitude of the incentive change was measured relative to GDP per capita. Results indicate that on average, an increase in benefit generosity of one percentage point (as a share of GDP per capita) is associated with a 0.25 percentage point increase in births. Decreases in financial support were conversely associated with a decline in birth rates. (Figure 9.) It should be noted that this association is based on changes in birth rates and does not reveal whether the observed effects reflect shifts in the timing of births, increases in lifetime fertility, or both.
Some of these studies concerned lump-sum cash benefits. For these policy interventions, the coefficient is notably higher for lump-sum cash benefits at approximately 0.84 (red dots and dotted line in Figure 9). This may suggest that families respond more strongly to a single lump sum payment than to an equivalent stream of smaller payments. However, this result needs to be interpreted with caution due to the low number of studies on this type of financial support and since studies of Australia’s 2004 Baby Bonus account for half of these lump-sum observations.
Figure 9. Association between changes in financial support for families with children and changes in fertility rates across countries.
Fertility effects of baby bonuses can vary with income groups, with some studies finding effects were more pronounced among individuals with lower educational attainment (Sobotka et al., 2019; Bergsvik et al., 2021). Parental-leave expansions, by contrast, tend to support the childbearing of higher-income couples more (Raute 2019; Bergsvik et al., 2021). On these grounds, and given the association between couple income and first birth in the prime childbearing ages shown above in Figure 7, we would expect a cash incentive in Finland to matter more for couples in the lower part of the income distribution.
Financial support to families with children may have several additional benefits in addition to potential effects on birth rates. Direct cash transfers improve the livelihoods and wellbeing of families with children and reduce child poverty, outcomes arguably at least as important as any fertility effect. Support measures may also have unintended side effects. For instance, some incentives may lead to shorter birth intervals, which in turn can strain family dynamics (Berg & Rotkirch, 2014; Berg et al., 2020). Lowering the cost of parenthood can also encourage very early births, single parenthood or unstable partnerships (Galloway & Hart, 2015). Potential side effects of baby bonuses should be carefully assessed on a population-group-specific basis.
Financial incentives and fertility
- Changes in financial support to families with children are associated with changes in total fertility rates. The larger the support, the bigger effects.
- Lump sum payments may have especially strong fertility effects, but evidence is scarce.
- The effect of financial support may be limited over time or mainly concern the timing of births. It can also vary by birth order of the children and across demographics. Cash support may benefit lower income groups more than others.
2. Vauvasampo and the interim model
This chapter sets out the fund’s mechanism as applied to Finland, the interim model before the fund payments can begin, and some of the foreseeable benefits and risks with the proposal.
2.1 Vauvasampo, a fund for future parents
The proposed new fund has a simple core mechanism: The state earmarks €5,000 for every child born in Finland. The capital is invested in publicly traded securities over several decades and grows through compound returns. The accumulated balance is paid out when they become a parent.
Several funds initiatives have been developed to support fertility or young citizens. Our proposal is distinct in that it targets future parents. Its name, Vauvasampo, combines the Finnish word for baby (‘vauva’) with a mythical device (‘sampo’) from the Kalevala epic symbolising abundance, prosperity, and good fortune.
2.1.1 Core mechanism and financing structure
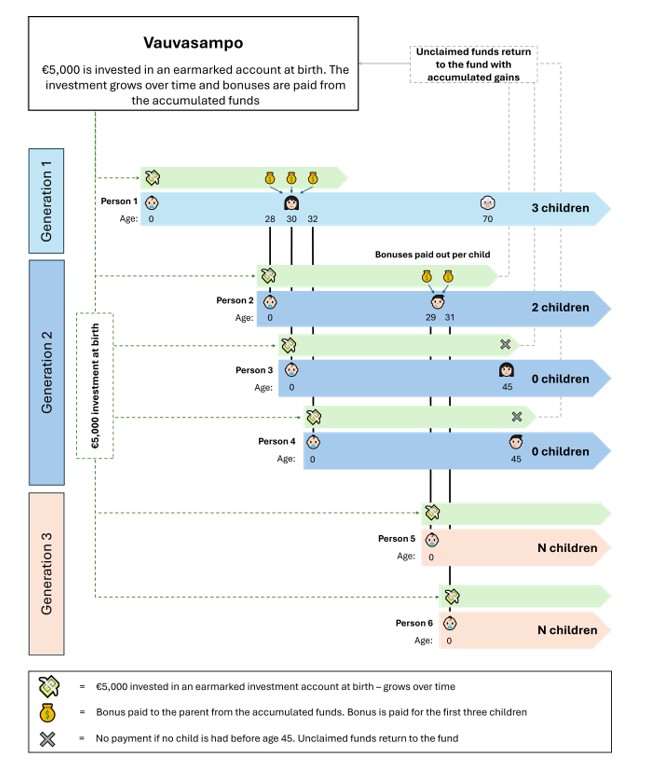
In Vauvasampo, 5,000 € is earmarked for every child born in Finland. The sum is invested in, for example, a market index or publicly traded equities. The investment grows over time, and the individual gains access to the funds only when they themselves have a child.
When a child is born, the parents — for whom an investment was earmarked at their own birth — receive their share of the fund. The largest payout is made at the first child, and payouts are made for up to the first three children, with the highest payout for the first born. If a person does not have children, or has fewer than three by age 45, the unused funds and their returns flow back to the fund and are earmarked for new children. (Figure 10.) The largest support is paid at the first child. The bonus is paid to each parent.
The proposed payout structure is as follows:
- 70 % of the accumulated sum is paid at the first child.
- 60 % of the remaining sum is paid at the second child.
- The remainder is paid at the third child.
The earmark applies to all persons born and resident in Finland, regardless of sex, family form or background. The purpose of the fund is to support family formation and to lower the financial uncertainty associated with having children. The fund would also represent a way to compensate more fully the time and money that parents invest in raising the next generation (cf. Section 1.4). If implemented, the proposal would represent the world’s largest universal childbearing bonuses, paid to parents irrespective of where in the country they live.
Vauvasampo payout estimates reported here assume a six per cent nominal annual return, which is close to the average annual return achieved by Finnish pension funds since 2000. Under this assumption, the inflation-adjusted payouts per parent would be approximately €13,200 for the first child, €3,900 for the second and €2,800 for the third, if children are born at the ages of 29, 32 and 34. The fund hence operates on a defined-contribution basis (a €5,000 investment at birth) rather than a defined-benefit basis: the final payout amounts depend on the year at which an individual has children and on the market return achieved over the investment horizon. Over such a long horizon, year-to-year variation in market returns has only a modest impact on the accumulated capital.
Figure 10. The Vauvasampo mechanism: an earmarked investment at birth, multi-decade compounding, and parity-staggered payouts upon childbearing
Despite time-diversification and the long investment horizon, the investment will create situations in which the bonus paid to parents varies in magnitude. This imbalance can be corrected by combining the defined-contribution and defined-benefit principles, so that the investment is always €5,000 but a ceiling — attainable by everyone — is set for the payout.
The support can be calibrated to encourage earlier childbearing by varying the payout share with age. For example, the payout for the first child could be tapered inversely with age above 30 years. In addition, returns accruing after age 35 could be redirected from the earmarked account into the fund, so that an individual’s earmarked balance would no longer grow from age 35 onwards. Such boundary conditions need to be considered carefully from an equality perspective. In any case, individuals should not get larger bonuses if they have a child later in life compared to earlier, even though fund revenues are likely to grow over time.
As a starting point, we propose that the bonuses paid from the fund be tax-free. The payouts could however be made subject to income tax, which would balance the benefit across income groups and would generate tax revenue that could partly finance the system. Variation can be reduced further, for example by time-diversifying the investment in equal quarterly instalments over the first three years.
2.2 The interim model
Because the fund would come into full effect only after one generation, we also propose an interim model with more modest baby bonuses that would run alongside the fund for around 20 years. This support would be launched immediately, at the same time as €5,000 is invested in the Intergenerational fund for each newborn for future family formation.
The interim model would provide a one-off payment per newborn child: €5,000 for the first child, €2,000 for the second, and €500 for the third. The interim model would build a bridge to the long-term effects of the fund and, according to our modelling, may allow fertility to increase already in the coming years (see Chapter 3 below).
The interim solution would be implemented as a separate benefit fund established under Kela. The benefit would be a one-off payment made at the birth of the child (not paid separately to each parent, as in Vauvasampo).
The new financing could be arranged, for example, through a technical reform of the child benefit system or another time-limited arrangement, without permanent changes to existing family benefits. The interim model is not intended as a replacement for child benefits or other family benefits.
2.3 Annual costs
The annual costs of Vauvasampo and the interim model are shown in Figure 11 below. The cost modelling is based on the annual births projected by the simulation model described in more detail in Chapter 3. Based on the modelling, the interim model operates on its own until around 2045, after which the first individuals for whom a fund share was earmarked at birth begin to have their own children and to receive these payments. The modelling extends to 2075.
Figure 11. Estimated annual costs of the Vauvasampo Parent Fund and the interim model
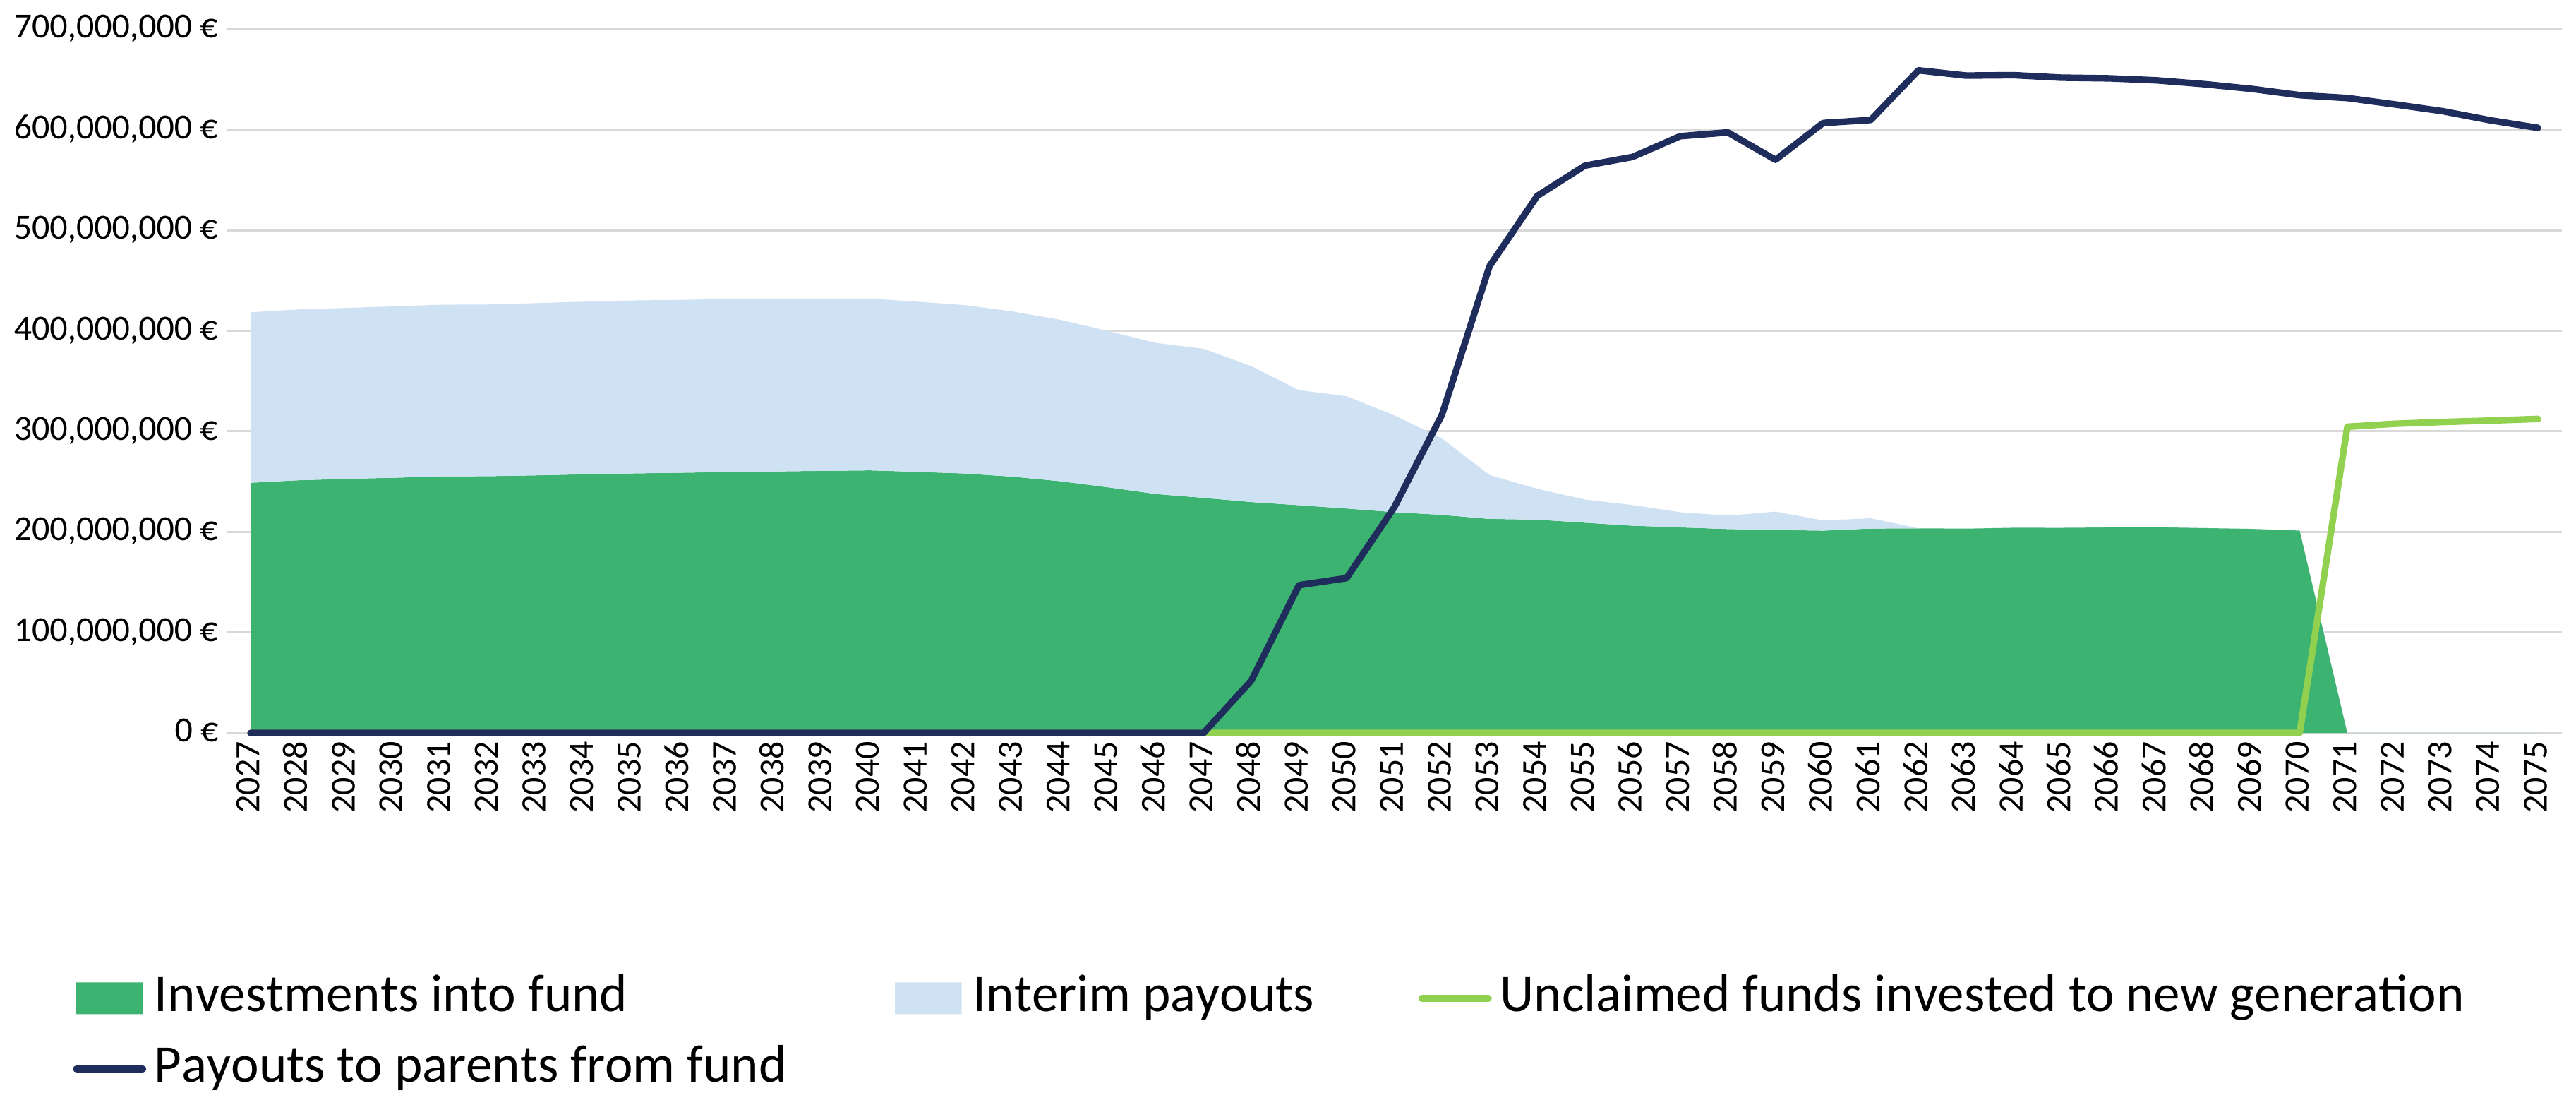
Based on births in 2024 (43,720 children), the annual investment into the fund is approximately €220 million. The interim incentive (the directly paid baby bonuses) raise fertility immediately in the modelling, which is reflected both in the growth of the required fund investments and in the number of interim bonuses paid out. In the initial phase of the policy, the total annual cost of the proposal (fund investments and bonuses from the interim model combined) would be approximately €420 million, with the birth rate already around 5,000 children higher than in 2024. Payments to parents from the funded assets begin after about 20 years, at which point the need for the interim model disappears. The annual cost decreases over time.
The cost estimate does not take into account other possible benefits or drawbacks, such as the potential VAT revenue to the state from consumption financed by the released funds, savings in other benefits, or employment effects. The cost modelling accounts only for the births generated by the agent-based model and does not address migration. All euro amounts are expressed in fixed 2026 prices, so that their purchasing power corresponds to today’s money; in nominal terms the sums would be higher in the future because of inflation.
The new fund may become economically self-sustaining in the long term. Because unused assets remain in the fund and are earmarked for future generations, it is possible that the fund may sustain itself after one generation. A €5,000 investment earmarked for an individual at birth grows, under our gross return assumption and inflation-adjusted, to approximately €40,000 by the age of 45. If that individual has not had children, this sum covers investments for 8 children (8 × €5,000). Today, roughly one in four Finns is childless at age 45 (cf. Figure 5). The modelling predicts that lifetime childlessness would decrease as a result of the interim baby bonuses and the Fund. Vauvasampo would nevertheless remain self-sustaining even if the share of the childless were halved from current levels, and annual state contributions would no longer be needed after one generation.
We estimate the average annual cost of Vauvasampo would be approximately €325 million over the analysis period (2027–2075). As of 2025, this sum corresponds to 0.12 per cent of GDP, 0.37 per cent of the annual state budget, 0.81 per cent of pensions paid, and 23 per cent of child benefits paid annually.
To benchmark the cost estimate, the research unit of Finnish Social Insurance Kela carried out a separate microsimulation using the Finnish SISU microsimulation model. In their simulation the number of first children was increased by 40 per cent and the number of second children by 2 per cent, to match the change in fertility projected by the agent-based population projection model (see Chapter 3). The modelling used Finnish 2023 data, the level of the child benefit in force in January 2026, and the consumer price index. The cost of the interim solution in the first year of the policy would be about €190 million relative to a no-policy scenario. This figure includes, besides the baby bonuses, other rising benefit costs such as child benefits, maternity grants and child-maintenance allowances. The SISU modelling produced somewhat higher costs than the agent-based modelling, partly because SISU accounts for other benefits in addition to the baby bonuses. Results from both models are nevertheless close to one another, which strengthens the reliability of our overall cost estimate.
Both Vauvasampo and the interim solution would cover all persons permanently resident in Finland, and a person is entitled to only one of the two at any one time. Restricting eligibility on the basis of citizenship alone could give rise to constitutional problems. Equity considerations need examination also from a broader perspective. The annual costs of the model are discussed in more detail in Section 2.3 below.
2.4 Benefits and risks
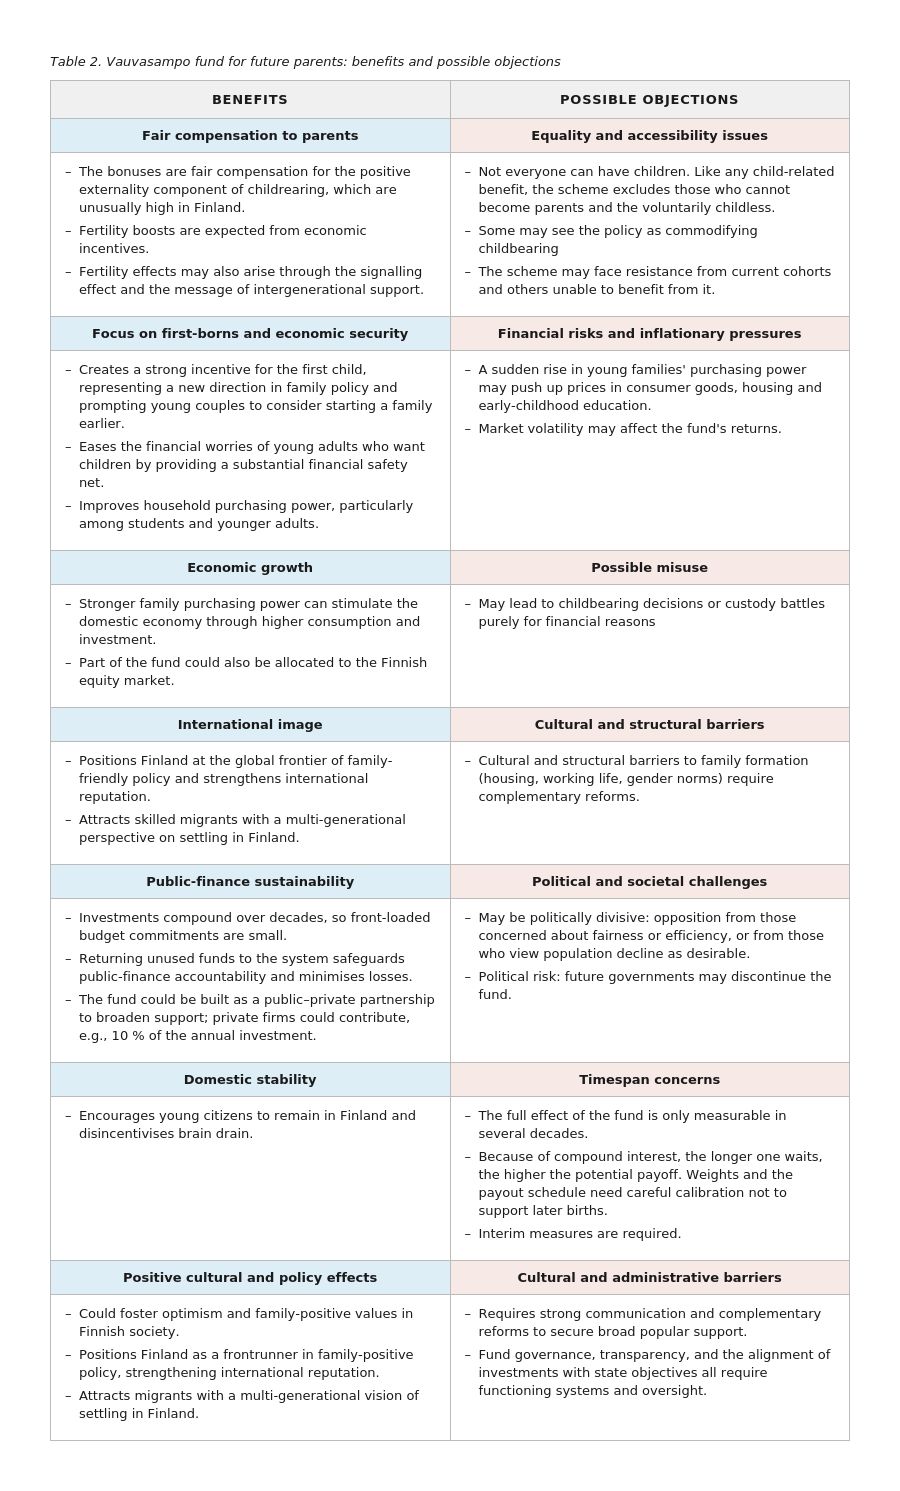
Implementing Vauvasampo would naturally require substantial preparations and a careful exploration of conditions, eligibility, and various risks and benefits. Table 2 summarises some of the main social-impact considerations. Many others may arise as the proposal is debated.
The baby bonuses paid out from Vauvasampo would be large in scale and front-loaded into the first year or first few years after a child’s birth. This is an internationally unique idea, intended as a long-term solution that operates across generations and transfers resources from the older to younger generations. It would signal that society values reproduction and reduce some of the current inequalities parents face by giving a more fair compensation for the positive externality component of childrearing. Such an initiative can help position Finland as a leading country in the development of family-friendly policy and strengthen its international reputation. The fund could also enhance Finland’s attractiveness among immigrants and reduce emigration by offering long-term incentives for building a life and career in Finland.
At the same time, the signal effect of Vauvasampo could be substantial. In a sunshine scenario, it fosters confidence in the future, family-friendliness and dialogue across generations. The fund would also raise household purchasing power among families with young children, which could strengthen the domestic economy by raising consumer demand.
Key risks include questions of equity and accessibility. The Fund does not apply equally to everyone, since childless individuals would not be eligible. Current parents and older generations also fall outside the new entitlement, which may give rise to a sense of intergenerational inequity. Additionally, some may perceive a financial incentive as commodifying childbearing or as intruding too far into highly private and sensitive decisions.
Economic risks include inflation, as a sudden rise in young families’ purchasing power could push up prices in the short term, particularly in consumer goods and housing. Additional resources to parents may inadvertently fuel status competition among parents, in which ever more funds are channelled into each child to achieve the best living standards, education, etc (for status competition in East Asia, see Mahler et al., 2025). The fund’s returns are exposed to market fluctuations, and managing the investments requires careful risk diversification and transparent reporting. The possibility of receiving baby bonuses without genuine engagement in the child’s care must also be carefully considered. Payments would require custody but other considerations may be considered.
Politically, the fund may meet resistance, especially during periods of substantial cuts to welfare state services and other forms of cash support. To guard against future governments reversing course, the fund should be set up with guardrails so that it cannot easily be dismantled. It is also essential that the new bonuses do not become a pretext for cutting existing family benefits, but instead builds on top of the current family-policy framework.
Finally, no economic benefit will suffice to support family formation in itself: any bonuses need to be accompanied by a comprehensive family-friendly policy package and broad societal support to raising the next generations.
Table 2. Vauvasampo fund for future parents: benefits and possible objections
3. Modelling the policy effect on fertility
We developed an agent-based population projection model to simulate the counterfactual effects of baby bonuses on fertility over the period 2021–2076. The model accounts for births among coupled households, with annual births modelled as depending on maternal age, birth order, and household disposable income. The initial synthetic population of Finnish-born women and the model calibration are based on register data provided by Statistics Finland. Code and descriptive data used to reproduce the simulation results are available in the GitHub repository.
The model is intended primarily as a theoretical and exploratory framework rather than as a forecasting tool. It specifies the mechanisms through which observed macro-level fertility outcomes may emerge under a given set of assumptions, namely: parity-specific progression propensities, affordability calculations, fecundity, and fixed income and union dynamics.
3.1 Agent-based population projection model
As a starting point, we construct a synthetic population of female agents — minors aged 0–19 and adults aged 20–44 — that matches the empirical distribution of Finnish-born women in 2021 by age, number of children, and coupled status (single or coupled); together, these characteristics define an individual’s demographic stratum. Each adult is assigned a within-stratum income percentile rank. This rank determines the adult’s income quartile and is mapped to disposable-income value using the observed quartile cutpoints.
Over time, the composition of the simulated population changes for three reasons: ageing, union-status transitions, and childbearing. At each annual step, the model proceeds in the order illustrated in Figure 12.
Figure 12. Annual population update cycle
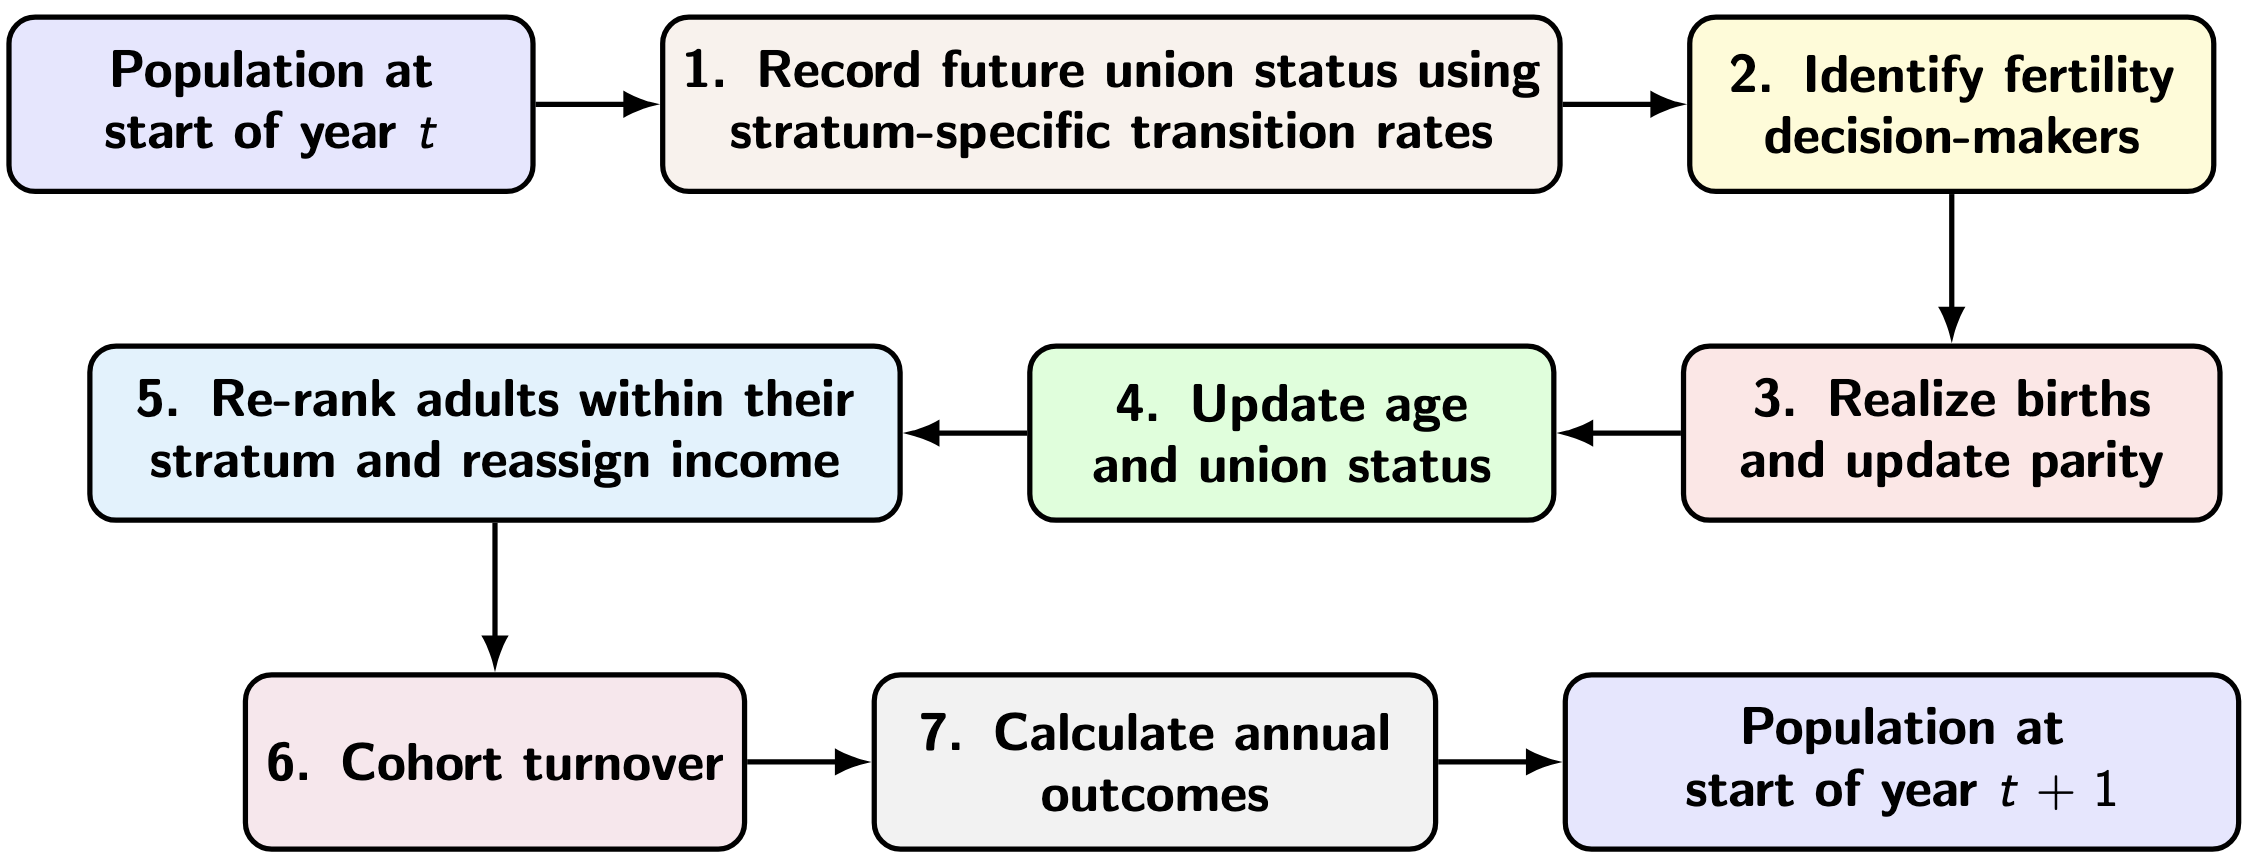
Initially, future union status is recorded for all adults, as they may transition between coupled and uncoupled states. These transitions are specified exogenously using coupling and uncoupling rates that depend on adult age group, parity, and income quartile. These rates are fixed at the empirically observed values for 2022 and 2023 and are then held constant, using the average of these two periods, for subsequent projection years.
Next, the set of fertility decision-makers is identified as adults who are coupled in the current year and remain coupled in the following year. These adults are hereafter referred to as households. They decide whether to have a child in the following year; realised births are then drawn probabilistically and recorded by incrementing the parity of those who give birth. Newborn girls are assumed to account for 50 percent of births and are added to the population of minors.
Finally, the model increments individuals’ ages and updates adults’ disposable income. Women who turn 44 exit the adult cohort, while minors who turn 20 enter the adult cohort with zero parity; their coupled status and income are assigned according to the distributions observed among childless 20-year-olds.
Affordability of an additional child
Each household is assumed to face competing financial obligations in the following year, including baseline consumption, housing, the costs of existing children, savings, and other commitments. Only a limited share of resources therefore remains available for an additional child.
For household h at time t, considering progression to parity i, the budget available for childbearing is defined as
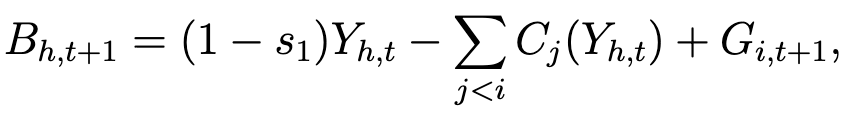
where Y is household disposable income, s₁ is the share of income reserved for non-child-related expenses, C is the monetary cost associated with each existing child, and G denotes expected baby bonuses associated with progression to parity i.
We note that parents may compete with one another over what raising children requires, in terms of both time and money (see Mahler, Tertilt & Yum, 2025). Since no direct measure for this status effect is available in register data, we operationalise it as follows. Each year, households choose a level of investment per child, assumed to be the same for each child:
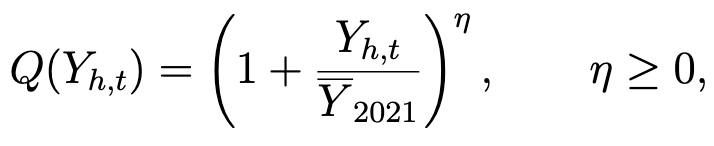
where Ȳ is mean household income in the baseline year and η governs the strength of the status effect. When η = 0, households do not differ in their investment per child. When η > 0, higher-income households invest more per child, causing child-related costs to rise more steeply with income.
The monetary cost associated with the i-th child is then defined as the product of per-child investment and family-size economies of scale:

where c is the baseline monetary cost of a child and S captures economies of scale through the parameter β ≤ 0.
The affordability of the intended parity progression, A, is defined as a centred logit transform of the log budget-to-cost ratio, r:
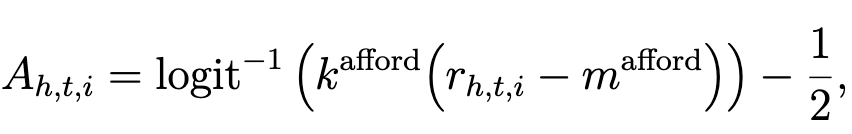
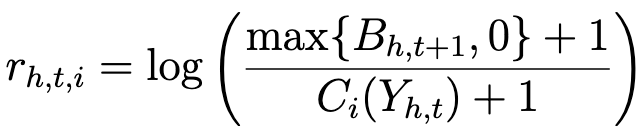
where m controls the affordability threshold and k governs the sensitivity of affordability to deviations in the budget-to-cost ratio around that threshold.
Fertility decision-making
Each year, household h chooses whether to progress to parity i, following a discrete-choice formulation with baseline birth intention probability
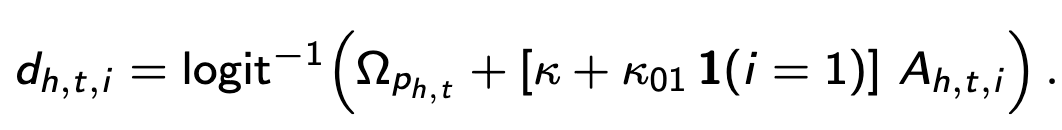
where Ω denotes the baseline propensity associated with the intended parity progression — the model intercept. The parameters κ and κ₀₁ capture, respectively, the general affordability effect across all parity progressions and the additional affordability effect associated with the transition to parenthood (when i = 1).
The model therefore assumes that, when κ is positive, households are more likely to have an additional child when that child is more affordable, either because the available budget is higher or because the associated child costs are lower. This effect is especially strong for first births when κ₀₁ is positive. The relationship is non-linear across households: within a certain range of the budget-to-cost ratio, affordability is highly sensitive to small changes, whereas in regions where the child is considered either very affordable or very unaffordable, sensitivity is much lower.
The model also assumes that households adjust towards a normative parity level, that is, the number of children typical among households of similar age and income, M. This social-adaptation mechanism modifies the household’s birth intention probability:

where the social-adaptation parameter, θ ∈ [0,1], determines the strength of adjustment towards the normative parity level, M. When θ = 0, fertility intentions are unaffected by the social norm. When θ = 1, households whose parity is below M have a birth intention probability of one.
Finally, the birth event is realised with probability
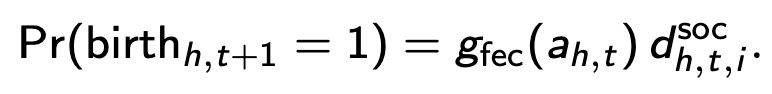
where household fecundity, g, as determined by an age-specific fecundity curve, accounts for age-specific differences in the realisation of intended parity progression.
Model calibration and fit
We calibrate the fertility ABM to parity progression ratios (PPRs) observed in 2022 among stably coupled Finnish women aged 20–44. Observed and simulated PPRs are stratified by lagged age group, lagged parity, and lagged income quartile, with income quartiles defined within each lagged age-by-parity group.
Let g index the stratified cells. The calibration objective is the exposure-weighted sum of squared deviations between simulated and observed PPRs:
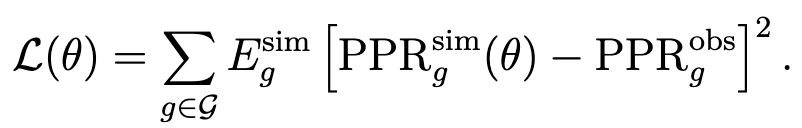
where E denotes the number of women at risk of progressing to the next birth in cell g, entering the calibration objective as a proportional weight.
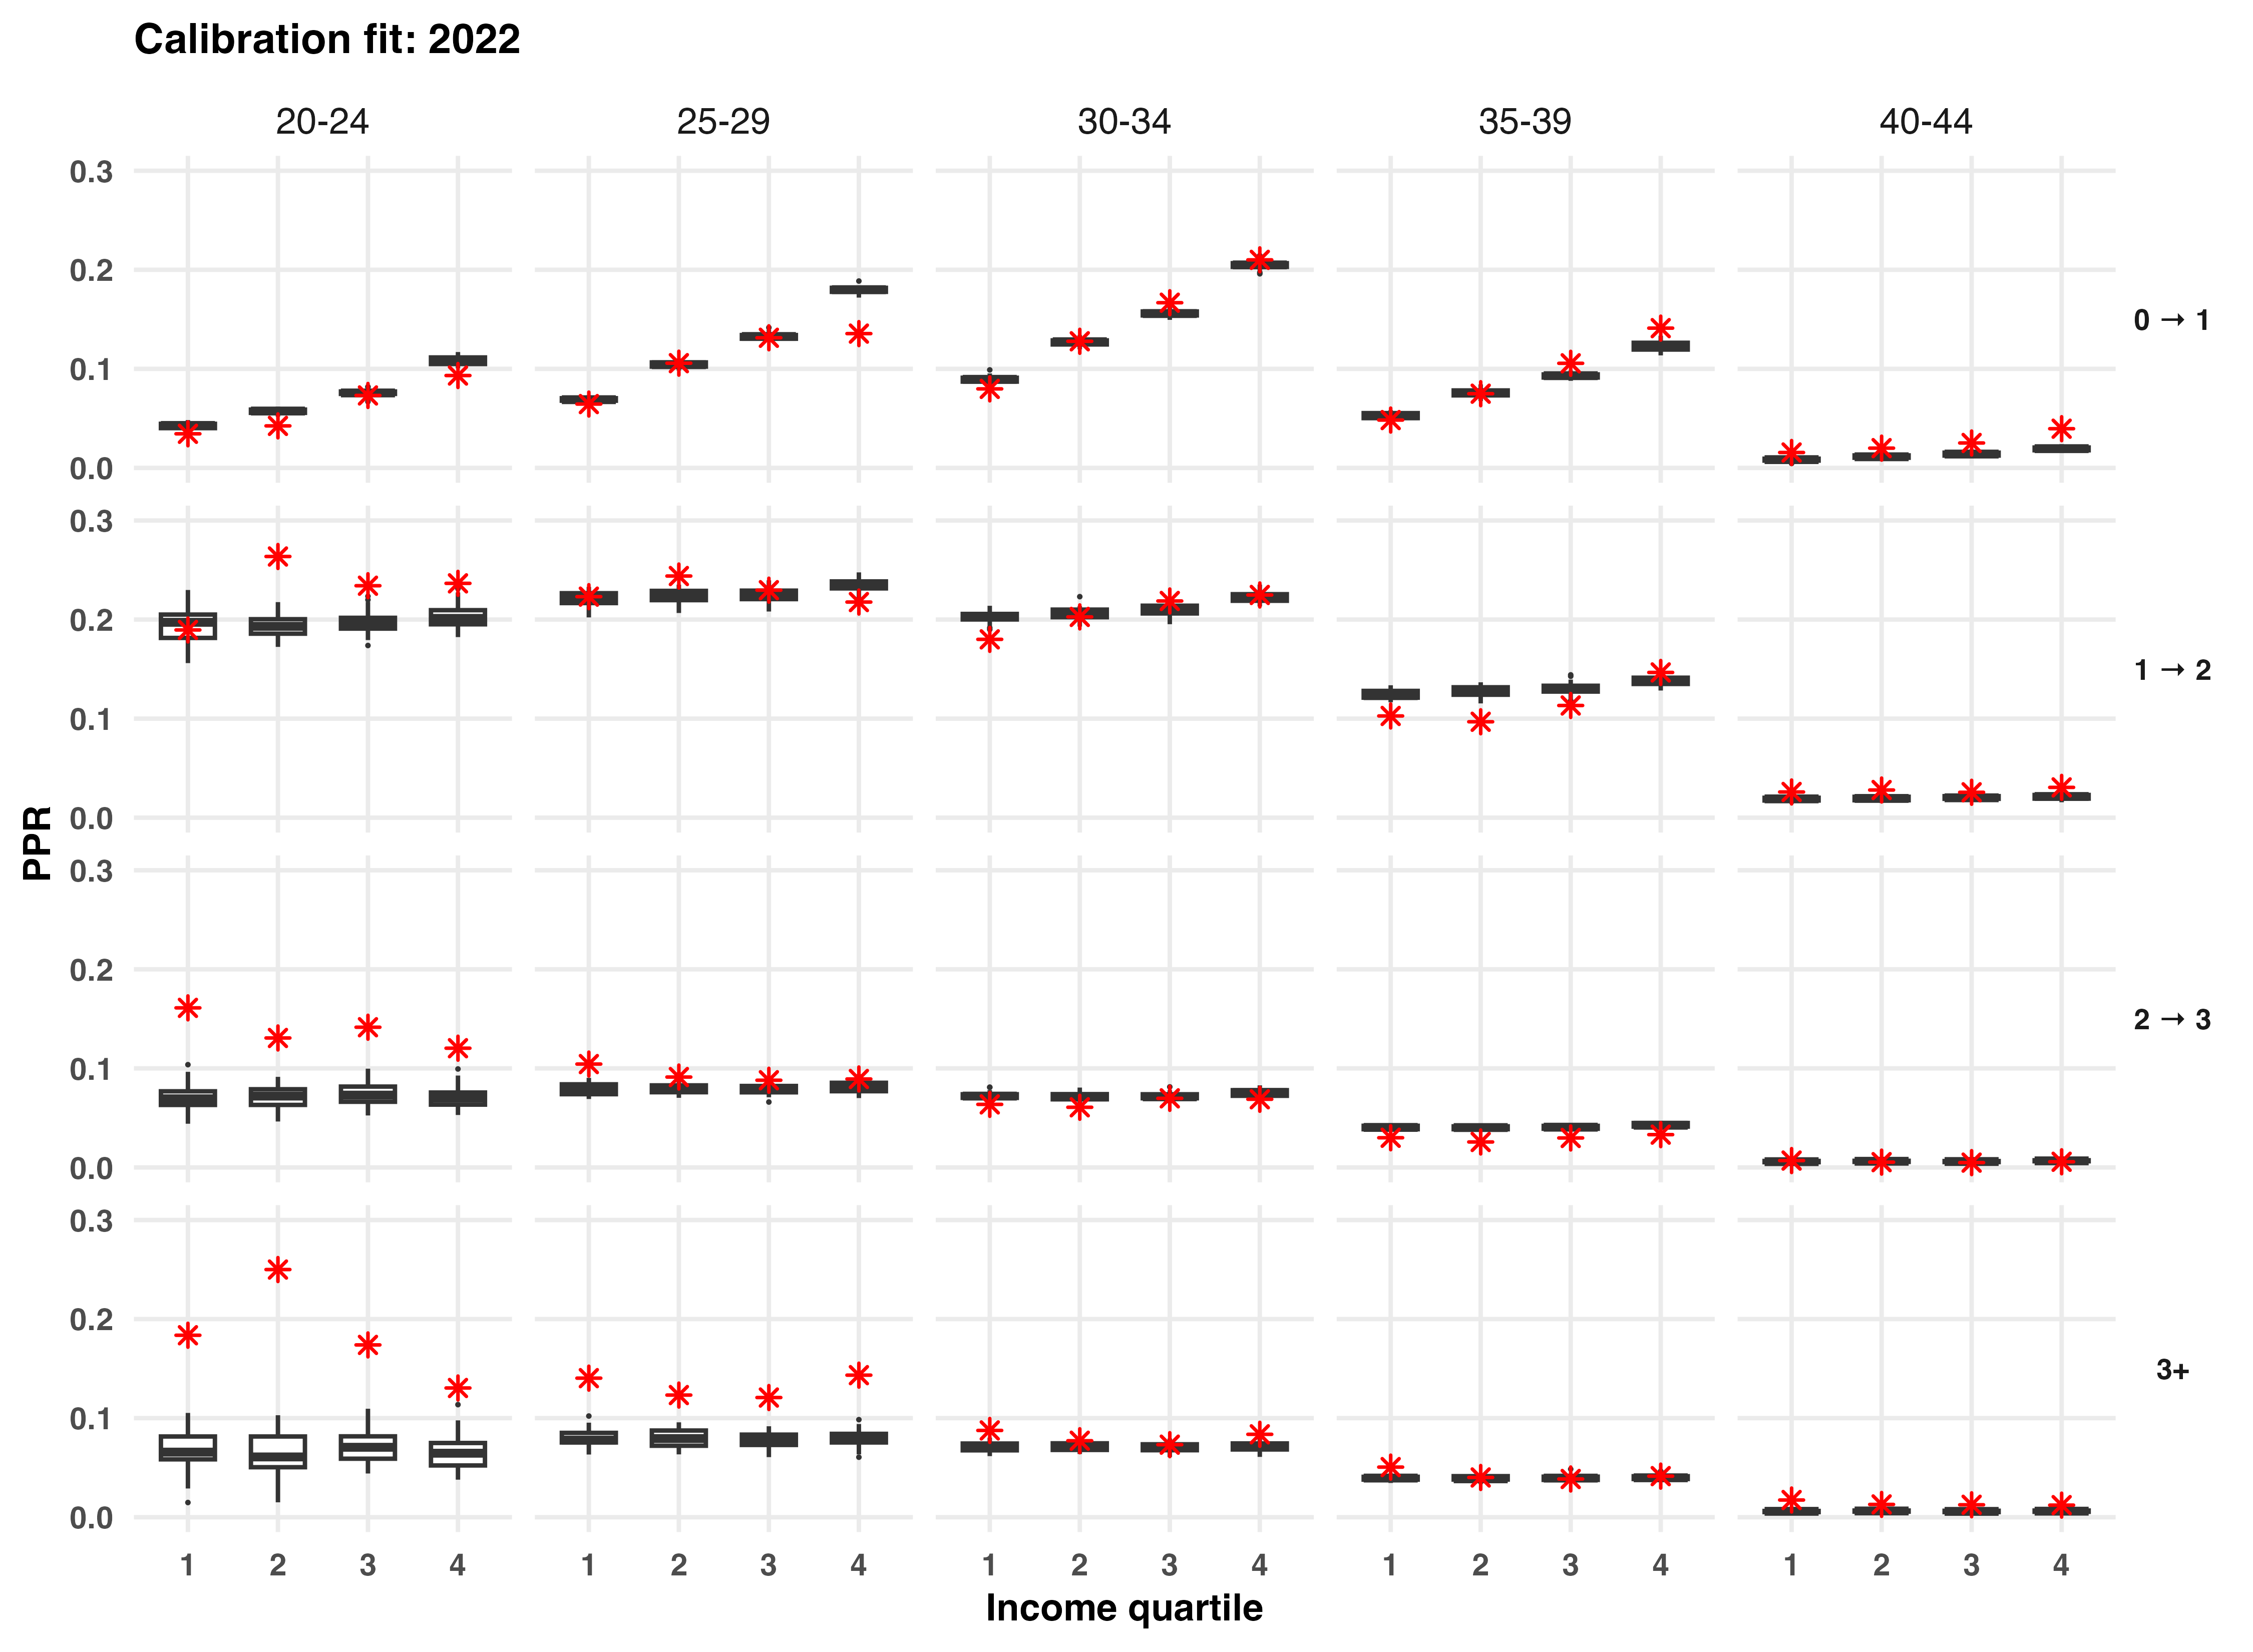
As Figure 13 shows, the model reproduces the main structure of observed PPRs across age, parity, and income quartile reasonably well, especially at the core reproductive ages, while the largest discrepancies cluster in sparse cells, such as young women at higher parities. For the transition to parenthood, the model also slightly underrepresents progression probabilities in the highest income quartiles.
Figure 13. Simulated versus observed parity progression ratios (PPRs) in 2022 across 40 model runs
Calibration of the ABM
Model calibration proceeded in four stages: first, the parity-specific baseline propensities; second, the age-fecundity curve; third, the joint economic block; and fourth, the social-adaptation parameter. Multivariate parameter blocks were estimated using a box-constrained L-BFGS-B procedure with multiple starting values.
Table 3 presents the calibrated parameters. The parity-specific baseline propensities suggest that second births have the highest underlying propensity, while third and higher-order births have the lowest. The calibrated monetary child cost is €9,092, and the status-effect parameter is 0.157. For a median-income household, this implies an effective first-child cost of about €10,141, obtained by multiplying the base cost by 2⁰·¹⁵⁷. The calibrated s₁ value of 0.678 suggests that roughly two-thirds of household income are absorbed by the couple’s own consumption, savings, and the costs of existing children, leaving a smaller residual share available for an additional child.
The calibrated status-effect parameter is positive, indicating that per-child investment rises with household income. The calibrated social-adaptation parameter, θ = 0.020, implies that households slightly adapt towards the normative parity of similar households.
Table 3. Calibrated parameter values of the agent-based model with explored parameter bounds
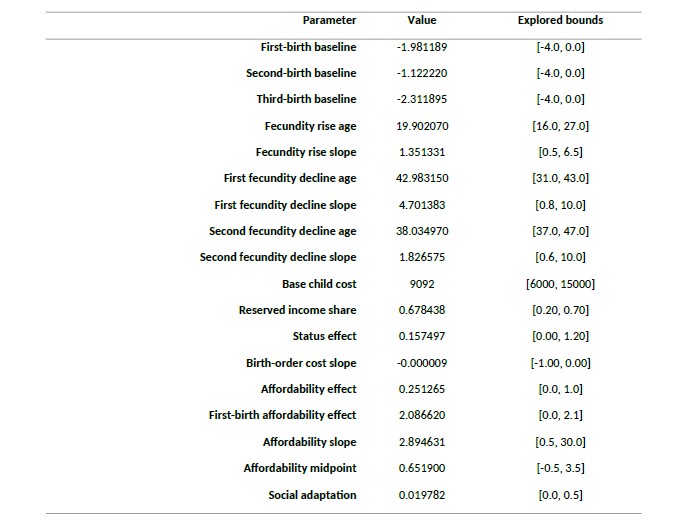
The model implies essentially no economies of scale across children, as the parameter β is effectively zero. Affordability has a positive effect on fertility intentions, κ = 0.251, and this effect is much stronger at the transition to parenthood, κ₀₁ = 2.087. The internal affordability parameters imply that affordability changes smoothly with the budget-to-cost ratio rather than switching abruptly. Finally, the fecundity-curve parameters indicate a gradual rise to peak fecundability around age 20, followed by a broad plateau through the twenties and early thirties, and then a clearer decline from the late thirties onward, becoming steeper at older reproductive ages.
3.2 Fertility projections with and without baby bonuses
Using the calibrated model, we simulate the effects of baby bonuses on long-term projected macro-level fertility outcomes (Figure 14). Under the policy counterfactual, the interim policy is introduced in 2026, gradually replaced by Vauvasampo from 2047 onward, and fully phased out by 2062.
Figure 14. Projected macro-level fertility outcomes until 2076 with and without the baby bonuses (interim and fund bonus)
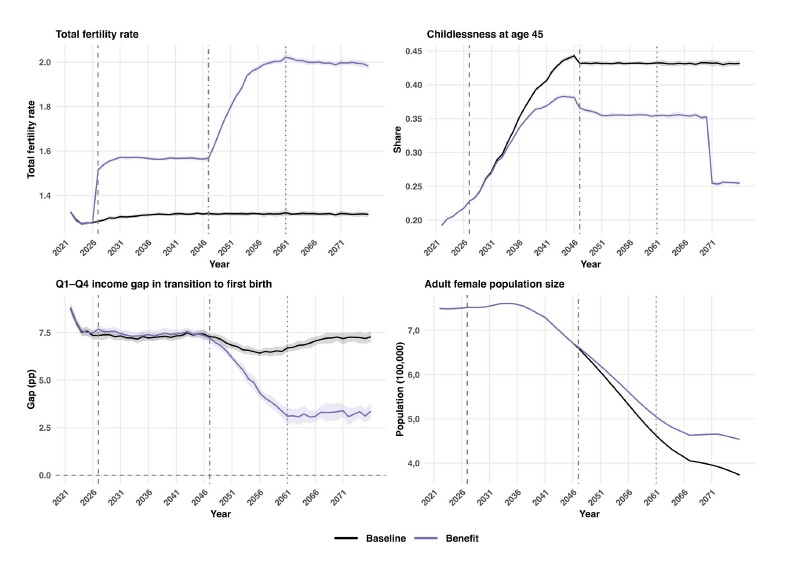
Since the model represents births occurring within coupled households, it does not capture births outside unions. Unadjusted macro-level outcomes would therefore understate fertility at the population level. To address this, the simulated total fertility rate (TFR) is extrapolated to the full population using fixed empirical age-specific scaling factors that account for births not represented in the modelled population.
During the interim-policy phase, the population-adjusted TFR rises from about 1.3 in the baseline to around 1.6 under baby bonuses, an increase of roughly 20 per cent. As the Fund is phased in, TFR rises further to about 2.0, corresponding to an increase of around 50 per cent relative to the no-benefit baseline. Childlessness at age 45 remains around 43 per cent in the baseline but declines to about 35 per cent under baby bonuses, and eventually to around 25 per cent after full replacement. The gap in first-birth progression between the highest and lowest income quartiles narrows from about 7.5 percentage points to roughly 3.0 percentage points. Over the same period, the adult female population becomes much larger under baby bonuses, reaching a difference of about 70,000–80,000 women by the end of the projection period.
Our modelled effects are on the larger side compared to previous research on the effects of cash support to parents. We can however situate them in relation to the previous correlational analyses by Stone (see Figure 9 above). The association between the size of financial support and the fertility effect shown earlier in Figure 9 was 0.25, and as much as 0.84 for one-off lump sum payments. Our estimated effect would be about 0.9, which is at the higher end of the previous research literature on financial incentives but in line with it. Estimates are complicated by the fact that a one-off support of this size has not existed before.
In the current specification, households evaluate the affordability of an additional child using the full lump-sum bonus at the moment of decision. This effectively treats a one-time payment as immediately relevant for childbearing, rather than spreading its value over the full period of childrearing. Such an assumption is likely to strengthen the simulated fertility response, especially at entry into parenthood, where affordability constraints are most important in both the empirical data and the model calibration. How this actually would play out depends on how the bonuses would be administered and how people would use them (Sobotka et al., 2019).
The observed income gradient in first and second births among stable couples in Finland is consistent with the hypothesis that financial constraints contribute to childbearing decisions. Accordingly, the model assumes that increasing disposable income through cash transfers increases the likelihood of having children. However, the association between income and family formation may also reflect factors such as employment security, housing conditions, and perceived readiness for parenthood, which are not automatically altered by a cash transfer. To the extent that these factors, rather than immediate financial constraints, constitute the binding barrier for some couples, the fertility effect of the incentive may be more modest than the observed income gradient alone would suggest. However, the income-gradient effect was strongest among couples aged 30–34, when most births in Finland occur. Since births at ages 35 and above are not increasing substantially (see Figures 6a–b), further postponement beyond this age is unlikely to translate into many additional births at the population level.
Another limitation of the model is that women who become parents because of the policy are treated in the same way as women who would have become parents anyway. Once they have a first birth, the model places them into the same subsequent income and union-transition updates as women who would have entered parenthood in the absence of the policy. If these policy-induced entrants would in reality differ from other parents in their later union stability, income development, or progression to higher parities, the long-run simulated effects will be biased. Owing to the complexity of the model and the interaction of its mechanisms, the direction and magnitude of this bias are difficult to determine in advance. The findings should therefore be read as projections conditional on the model structure and assumptions, rather than as exact forecasts of policy effects.
It is also worth noting that, while the parameters associated with the assumed childrearing cost structure are calibrated within the model, the underlying cost structure cannot be directly validated using Finnish register data. A strength of this mechanism-based model is that it can incorporate additional mechanisms, such as social adaptation and status effects associated with childrearing, to analyse policy effects under different contextual counterfactuals. For example, stronger competition over per-child investment among higher-income households could weaken the positive fertility effects of cash transfers. Such competition may become more important if demographic change makes access to high-quality goods and education for children increasingly scarce, a topic for future research (Rotkirch et al., in preparation).
Agent based model of fertility outcomes in counterfactual scenarios
- We simulated the fertility effects of Vauvasampo in a model fitted to Finnish register data.
- The interim solution would raise the birth rate by 21 per cent, and Vauvasampo by 85 per cent.
- This would correspond to approximately 7,000 and 17,000 additional children born in Finland each year.
- Social externalities, such as social adaptation or status effect associated with childrearing, may respectively amplify or weaken the income-gradient effects of the bonuses on fertility outcomes.
4. Conclusion: an incentive for fulfilling family aspirations
This working paper has laid out the core idea and mechanisms of Vauvasampo, a new fund for future parents. It is designed to support young adults who want to have children, and to build a new institutional framework to support families in ageing societies.
Although the Nordic countries have long had broad family policies, traditional instruments have not been enough to reverse fertility decline. Finns want around two children on average, but on the current trajectory will end up with around half a child less. The difference between overall societal contributions of parents compared to non-parents is high, almost threefold.
The postponement and decline of first births explain most of Finland’s fertility decline over the past fifteen years. Couple household income is strongly associated with the likelihood to have a first child in the ages when most children are born in today’s Finland. International research evidence indicates that financial support to families is associated with higher fertility, and this association scales with the size of the support.
The unique structure of Vauvasampo enables baby bonuses which are sizeable by international standards. Around €5,000 is invested into the Fund for each newborn, and payouts only start if and when that person has a child of their own. With compound returns over a multi-decade horizon, the lump sums paid to parents at the time of childbearing can reach tens of thousands of euros. Assuming a six-per-cent nominal annual return, the inflation-adjusted payouts per parent would be approximately €13,200 for the first child, €3,900 for the second and €2,800 for the third, if children are born at the ages of 29, 32 and 34. Both parents would receive Vauvasampo payments.
The proposed fund operates on a defined-contribution basis (a €5,000 investment at birth) rather than a defined-benefit basis: the final payout amounts will depend on the year at which an individual has children and on the market return achieved over the investment horizon. The benefit can further be calibrated to encourage earlier childbearing by varying the payout share with age and could be subject to taxation.
Because the fund’s main impact would materialise only in 20–30 years, we propose a complementary interim model. It would provide a more modest, one-off payment per newborn child: €5,000 for the first child, €2,000 for the second, and €500 for the third.
We constructed a synthetic population of female agents that matched the empirical distribution of Finnish-born women in 2021 by age, number of children, and union status. The population projection model was developed as an exploratory framework for assessing the potential effects of the baby bonuses on births over time and their fiscal implications, rather than as a forecasting tool. The model accounts for births in unions (marriages and cohabitations), with annual births modelled as depending on maternal age, birth order, and household disposable income. The calibration suggests that the positive effect associated with the affordability of childbearing plays a key role in reproducing the observed income gradients in births, especially at first birth.
The population projection of the fertility effects of the new bonuses suggests that the interim model alone could raise total fertility from around 1.3 to about 1.6, while the Vauvasampo Fund could raise it to about 2.0, corresponding to the desired family size of young adults in Finland. Childlessness at age 45 would decline, and the gap in first-birth progression between the highest and lowest income quartiles would narrow from about 7.5 percentage points to about 3.0–3.5.
In the initial phase of the policy, the modelling results suggest the total annual cost of the proposal (fund investments and bonuses from the interim model combined) would be approximately €420 million, with the birth rate already around 5,000 children higher than in 2024. Payments to parents from the funded assets begin after about 20 years, when the need for the interim model disappears.
We estimate the average annual cost of the new bonuses would be approximately €325 million over the analysis period (2027–2075), a sum that corresponds to 0.12 per cent of current Finnish GDP, to 0.37 per cent of the annual state budget, to 0.81 per cent of pensions paid, and to 23 per cent of child benefits paid. Vauvasampo is structured to become self-sustaining in the long term, as unused assets remain in the fund and are recycled into future generations.
Vauvasampo bonuses would be large in scale and front-loaded into the first year or first few years after a child’s birth. This is an internationally unique idea, intended as a long-term solution that operates across generations and transfers resources from the older to younger generations. Such an initiative can position Finland as a leading country in the development of family-friendly policy and strengthen its international reputation. The new Fund could also enhance Finland’s attractiveness and retention power among immigrants and the reduce propensity of emigration. Identified key risks include inflation, as a sudden rise in young families’ purchasing power could push up prices in the short term, particularly in consumer goods and housing. To guard against future governments reversing course, the fund should be earmarked so that it cannot easily be dismantled.
To conclude, Vauvasampo and the interim model represent a new initiative to ease the financial uncertainty with regards to family formation. Its key aim is to enable all who wish to become parents to do so before it is too late in life. The fund would also serve to compensate parents for their time and money transfers, and improve child and family wellbeing. Functioning as a ‘reverse pension system’, the Fund addresses public spending in ageing Finland, in which support directed at children has eroded relative to support directed at the elderly.
Our proposal is intended as a new dimension within a broad family policy package, not a substitute for it or a pretext to cut back on other family services and support. Many factors shape people’s wishes and opportunities to have children, and there is no single ‘magic wand’ for reversing long-term global trends (Gietel-Basten, Rotkirch & Sobotka, 2022). The effectiveness of any cash transfers depend on wider family-friendliness: housing and infrastructure, education, equality, digital wellbeing, working life, and the broader cultural climate around parenting.
5. Appendix: Baby bonuses and fertility effects across countries
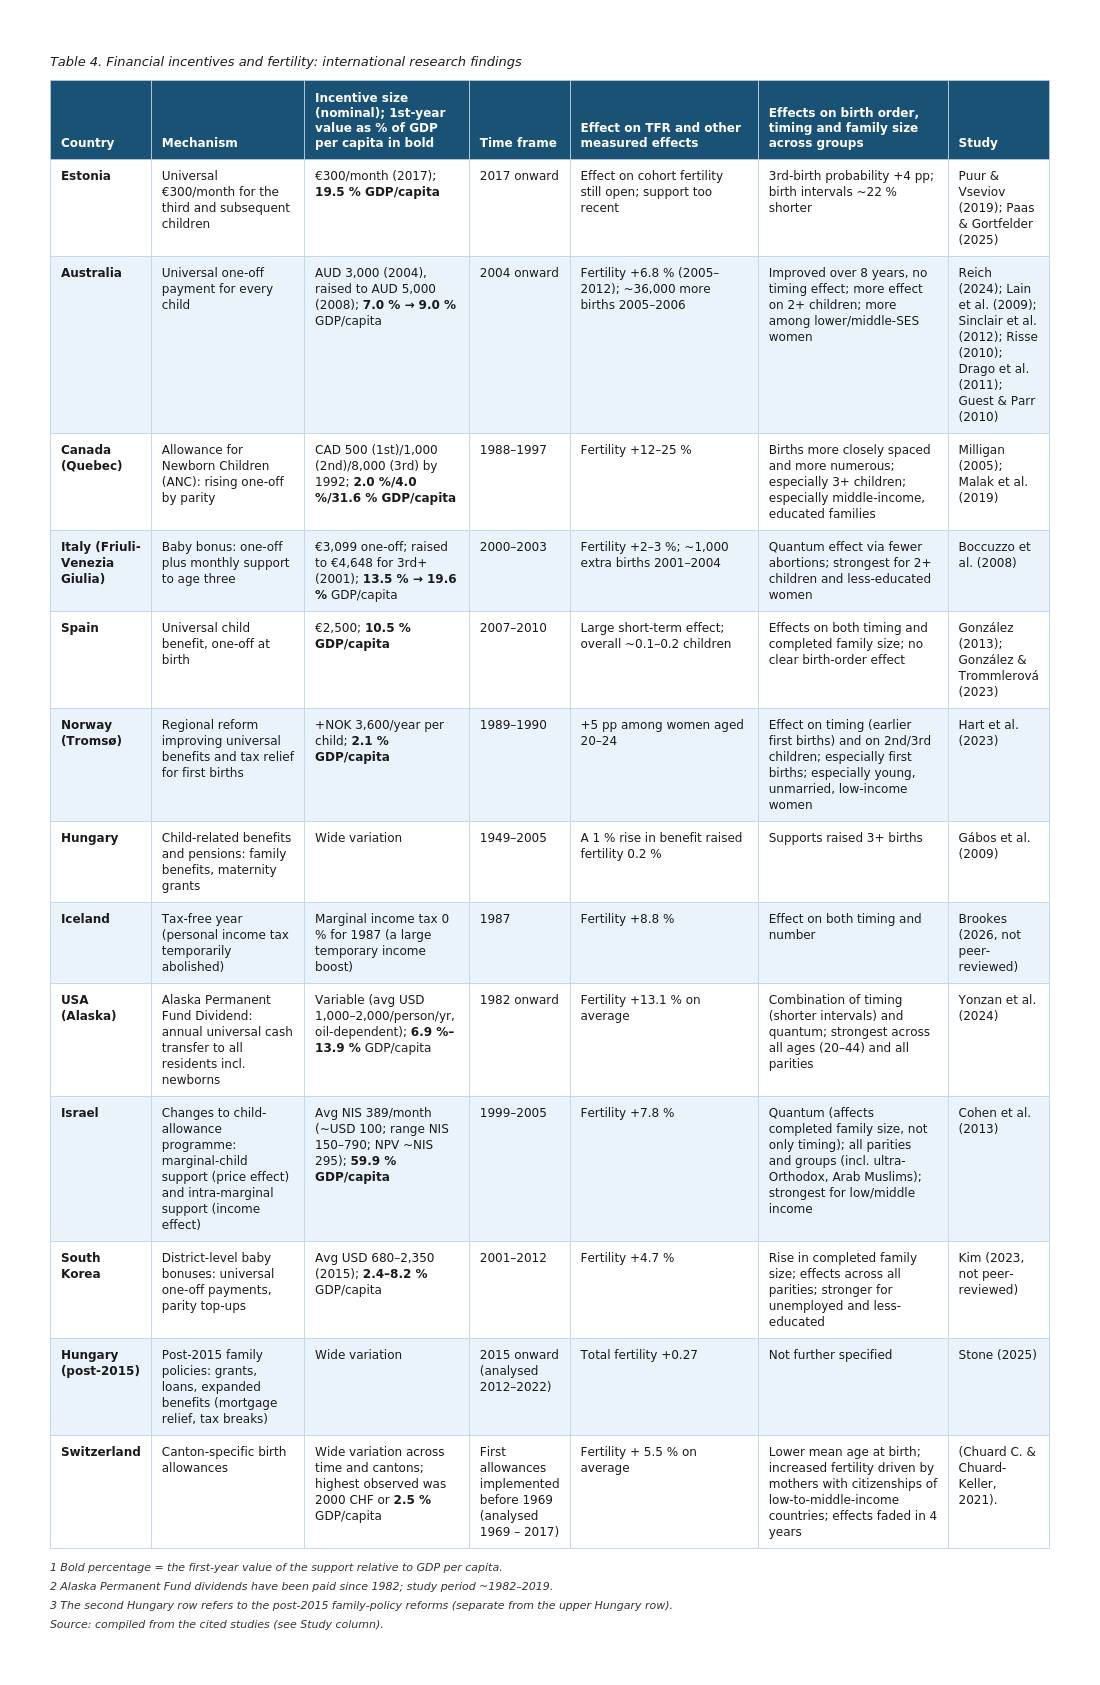
Over recent decades, several different direct cash-transfer (‘baby bonus’) programmes have been tried in Western countries and in Asia. The Appendix summarises briefly the benefits these programmes provided and the main research findings on them. The results are collated in Table 4.
Estonia
In 2017 Estonia introduced a universal monthly benefit of €300 for the third and subsequent children. The reform raised the probability of a third birth by four percentage points and shortened the interval between the third and second birth by almost a quarter. The effect was thus a combination of faster timing and an increase in completed family size (Puur & Vseviov, 2019; Paas & Gortfelder, 2025).
Norway
In Tromsø in 1989–1990 a regional reform combined universal child-targeted benefits and tax reductions. From 1990 the per-child support totalled NOK 3,600 a year, equivalent to about 2.1 per cent of GDP per capita. The reform was associated with a five-percentage-point rise in fertility among unmarried women and lower income groups. (Hart et al., 2023.)
Iceland
Iceland suspended the collection of income tax for one year in 1987, equivalent to a large temporary income transfer. The extra money was associated with an 8.8 per cent rise in fertility. This natural experiment differs from most family-support settings in that it was a universal, unconditional addition to income rather than a benefit targeted at parents. Peer review of Brookes’s (2026) working paper on the effects is still under way.
Hungary
Hungarian family policy can be divided into two eras by the start of Viktor Orbán’s rule. The long-standing family-policy measures applied before Orbán’s era, such as the benefits granted between 1949 and 2005, raised fertility by 0.2 per cent for every one-per-cent increase in the benefit, with the strongest effects for third and higher-order births (Gábos et al., 2009). After 2010 the programme launched by Orbán’s government has included interest-free loans, housing subsidies and tax reliefs, amounting to about five per cent of the country’s GDP. Stone (2025) estimates that the 2012–2022 measures raised total fertility by about 0.27 of a child (TFR 1.25 → 1.59).
Italy
In Friuli-Venezia Giulia a regional baby bonus operated in 2000–2003: a one-off payment of €3,099 (13.5 % of GDP per capita) for the second child and €4,648 (19.6 % of GDP per capita) for the third and subsequent children. Boccuzzo et al. (2008) found a 2–3 per cent rise in total fertility, corresponding to about 1,000 additional births in 2001–2004. The effect was strongest among mothers of several children and among less-educated women. Part of the rise came through a fall in abortions, highlighting an often-overlooked channel: financial support can reduce terminations and thereby raise fertility.
Spain
González and Trommlerová (2023) examine the effect of a €2,500 payment (a ‘birth premium’) introduced in Spain and suggest that, among young women, it is uncertain whether the premium led to earlier first births. Among older women there was also an ‘additional-child effect’, i.e. higher completed family size. Likewise, withdrawing the payment reduced childbearing — even more than introducing it had increased it. The introduction supported childbearing especially among the more highly educated but had little effect among lower-educated parents, whereas its removal a few years ago had a greater effect among lower-educated couples and in poorer provinces or regions where unemployment had risen.
Canada
A classic ‘baby bonus’ example came from Canada in the 1990s. In Quebec, the one-off allowance for newborn children paid between 1988 and 1997 ranged from about €350 to over €5,000 depending on parity and timing. The bonus affected total fertility relative to provinces that did not introduce a comparable reform, and it raised the province’s completed (cohort) fertility by about 3.5 per cent (from about 1.58 to 1.75 children per woman over the life course). The benefit especially supported the fertility of larger families, for whom it was largest (Malak, Rahman & Yip, 2019).
USA
The Alaska Permanent Fund Dividend was associated with an average 13.1 per cent rise in fertility in 1982–1988. The effect increased with women’s age: whereas fertility rose about 12.4 per cent among 20–24-year-olds, it rose about 16.9 per cent among 35–44-year-olds. Teenage fertility and abortion rates were unchanged, suggesting that the rise in fertility was planned (Yonzan et al., 2024).
Israel
Israel’s child-support programme (1999–2005) was analysed for the effect on fertility of changes in support for the next child in the birth order, using a large panel dataset. Increasing the support paid for the next child by the programme’s average amount — 295 new Israeli shekels — was associated with a 7.8 per cent rise in fertility. The effect was positive across all religious and ethnic groups but greatest among low- and middle-income families (Cohen et al., 2013).
Australia
In 2004 Australia introduced a baby bonus that rose from AUD 3,000 to AUD 5,000 by 2008. The direct support differed from, for example, the Estonian and Quebec programmes in that it was paid equally for every child. The programme was associated with a 6.8 per cent rise in Australian total fertility in 2005–2012 (Reich, 2024). The effect was strongest for third and subsequent births and clearest among women in lower income groups (Lain et al., 2009; Sinclair et al., 2012; Risse, 2010; Drago et al., 2011; Guest & Parr, 2010).
South Korea
As part of the country’s programme to support fertility, South Korean districts began introducing one-off childbearing payments after the early 2000s. By 2012 all districts had adopted the programme in some form, and in 2015 their average values corresponded to USD 680, 926 and 2,350 for the first, second and third child. Between 2001 and 2012, according to a causal analysis, district-level bonuses raised total fertility by 4.7 per cent, with a stronger effect among less-educated and unemployed women (working paper, not peer-reviewed; Kim, 2023).
Switzerland
From 1969 onwards, 11 out of 26 of Swiss cantons have implemented varying levels of birth allowances. The values of these payments vary widely and have ranged from 0 to nearly 2100 CHF. On average, the canton-level allowances increased fertility by 5.5 per cent, lowered the mean age at birth by 6 months and increased weight of the newborns by 2.8 per cent. Effects on fertility were stronger for those with a citizenship from a low-to-median-income-country (Chuard C. & Chuard-Keller, 2021).
Table 4. Financial incentives and fertility: international research findings
References
Beaujouan, E., & Neels, K. (2025). Delayed fertility and childlessness. In R. Schoen (Ed.), Advances in Social Demography (pp. 349–364). Springer Nature Switzerland. https://doi.org/10.1007/978-3-031-89737-5_14
Berg, V., & Rotkirch, A. (2014). Faster transition to the second child in late 20th century Finland: A study of birth intervals. Finnish Yearbook of Population Research, 49, 73–86. https://doi.org/10.23979/fypr.48424
Berg, V., Miettinen, A., Jokela, M., & Rotkirch, A. (2020). Shorter birth intervals between siblings are associated with increased risk of parental divorce. PLOS ONE, 15(1), e0228237. https://doi.org/10.1371/journal.pone.0228237
Bergsvik, J., Fauske, A., & Hart, R. K. (2021). Can policies stall the fertility fall? A systematic review of the (quasi-)experimental literature. Population and Development Review, 47(4), 913–964. https://doi.org/10.1111/padr.12431
Boccuzzo, G., Caltabiano, M., Dalla Zuanna, G., & Loghi, M. (2008). The impact of the bonus at birth on reproductive behaviour in a lowest-low fertility context: Friuli-Venezia Giulia (Italy), 1989–2005. Vienna Yearbook of Population Research, 6, 125–147. https://doi.org/10.1553/populationyearbook2008s125
Bradshaw, J., & Attar-Schwartz, S. (2011). Fertility and social policy. In N. Takayama & M. Werding (Eds.), Fertility and public policy: How to reverse the trend of declining birth rates (pp. 185–212). MIT Press.
Brookes, P. (2026). A natural experiment on fertility in Iceland [Working paper]. SSRN. https://doi.org/10.2139/ssrn.6047955
Chuard, C., & Chuard-Keller, P. (2021). Baby bonus in Switzerland: Effects on fertility, newborn health, and birth-scheduling. Health Economics, 30(9), 2092–2116. https://doi.org/10.1002/hec.4366
Cohen, A., Dehejia, R., & Romanov, D. (2013). Financial incentives and fertility. Review of Economics and Statistics, 95(1), 1–20. https://doi.org/10.1162/REST_a_00342
Drago, R., Sawyer, K., Shreffler, K., Warren, D., & Wooden, M. (2011). Did Australia’s baby bonus increase fertility intentions and births? Population Research and Policy Review, 30(3), 381–397. https://doi.org/10.1007/s11113-010-9193-y
Estévez, J. L., & Rotkirch, A. (2026). Fertility trends across migrant generations reexamined: Insights from Finnish register data. European Sociological Review, jcag009. https://doi.org/10.1093/esr/jcag009
Eurostat. (2025). Demography of Europe – 2025 edition. European Commission. https://ec.europa.eu/eurostat/web/products-flagship-publications/-/demography-of-europe-2025
Gábos, A., Gál, R. I., & Kézdi, G. (2009). The effects of child-related benefits and pensions on fertility by birth order: A test on Hungarian data. Population Studies, 63(3), 307–325. https://doi.org/10.1080/00324720903215293
Gál, R. I. & Vanhuysse, P. (in preparation). Parental prisoners of love. In preparation for James Heckman, ed., forthcoming, Frontiers of Fertility. May 30, 2026 version.
Galloway, T. A., & Hart, R. K. (2015). Effects of income and the cost of children on fertility: Quasi-experimental evidence from Norway (Discussion Paper). Statistics Norway.
Gauthier, A. H. (2007). The impact of family policies on fertility in industrialized countries: A review of the literature. Population Research and Policy Review, 26(3), 323–346. https://doi.org/10.1007/s11113-007-9033-x
Gauthier, A. H., & Gietel-Basten, S. (2025). Family policies in low fertility countries: Evidence and reflections. Population and Development Review, 51, 125–161. https://doi.org/10.1111/padr.12691
Gietel-Basten, S., Rotkirch, A., & Sobotka, T. (2022). Changing the perspective on low birth rates: Why simplistic solutions won’t work. BMJ, 379, e072670. https://doi.org/10.1136/bmj-2022-072670
Golovina, K., Nitsche, N., Berg, V., Miettinen, A., Rotkirch, A., & Jokela, M. (2024). Birth cohort changes in fertility ideals: evidence from repeated cross-sectional surveys in Finland. European Sociological Review, 40(2), 326-341. https://doi.org/10.1093/esr/jcad048
González, L., & Trommlerová, S. K. (2023). Cash transfers and fertility: How the introduction and cancellation of a child benefit affected births and abortions. Journal of Human Resources, 58(3), 783–818. https://doi.org/10.3368/jhr.59.1.0220-10725R2
Guest, R., & Parr, N. (2010). The effects of family benefits on childbearing decisions: A household optimising model calibrated to Australia. Economic Record, 86(275), 609–619. https://doi.org/10.1111/j.1475-4932.2010.00663.x
Hart, R. K., Cools, S., & Strøm, M. (2023). Universal transfers, tax breaks and fertility: Evidence from a regional reform in Norway. Population Research and Policy Review, 42(3), Article 34. https://doi.org/10.1007/s11113-023-09793-z
Hart, R. K., Bergsvik, J., Fauske, A., & Kim, W. (2024). Causal analysis of policy effects on fertility. In K. F. Zimmermann (Ed.), Handbook of Labour, Human Resources and Population Economics. Springer.
Hart, R. K., et al. (2024). Fallende fødselstall i Norge: Utvikling og mulige tiltak for unge voksne (Delleveranse fra Fødselstallsutvalget). https://www.regjeringen.no/contentassets/65e2b59e934640dfb7015fe295bc72e5/no/pdfs/q-1262_fallende-fodselstall-i-norge.pdf
Hellstrand, J., Nisén, J., & Myrskylä, M. (2020). All-time low period fertility in Finland: Demographic drivers, tempo effects, and cohort implications. Population Studies, 74(3), 315-329. https://doi.org/10.1080/00324728.2020.1750677
Hellstrand, J., Nisén, J., & Myrskylä, M. (2022). Less partnering, less children, or both? Analysis of the drivers of first birth decline in Finland since 2010. European Journal of Population, 38(2), 191–221. https://doi.org/10.1007/s10680-022-09605-8
Human Fertility Database. Max Planck Institute for Demographic Research (Germany) and Vienna Institute of Demography (Austria). Available at www.humanfertility.org (data downloaded on May 21st, 2026).
Jalovaara, M., & Miettinen, A. (2025). Childlessness trends at different ages by educational attainment for men and women in Finland: A research note. Population Studies, 1–10. https://doi.org/10.1080/00324728.2025.2592578
Kearney, M. (2026, May 1). How will falling fertility rates hurt the economy? With Melissa Kearney [Interview by S. Keynes]. Financial Times.
Kim, W. (2023). Baby bonus, fertility and missing women (Departmental Working Paper No. 2308). Southern Methodist University, Department of Economics.
Kotamäki, M., & Lehtimäki, J. (2025). Getting too old for this: Population ageing and its economic consequences in Finland. Economic Analysis and Policy, 88, 1720–1750. https://doi.org/10.1016/j.eap.2025.10.040
Lain, S. J., Ford, J. B., Raynes-Greenow, C. H., Hadfield, R. M., Simpson, J. M., Morris, J. M., & Roberts, C. L. (2009). The impact of the baby bonus payment in New South Wales: Who is having ”one for the country”? Medical Journal of Australia, 190(5), 238–241. https://doi.org/10.5694/j.1326-5377.2009.tb02382.x
Lappegård, T., Kristensen, A. P., & Dommermuth, L. (2025). Disentangling the relative importance of subjective economic uncertainty for fertility intentions and realisation in Norway. Genus, 81, 37. https://doi.org/10.1186/s41118-025-00278-9
Lesthaeghe, R. (2025). Sub-replacement fertility, population decline and negative growth momentum: Adding focus. https://doi.org/10.13140/RG.2.2.10024.84485
Luci-Greulich, A., & Thévenon, O. (2013). The impact of family policies on fertility trends in developed countries. European Journal of Population, 29, 387–416. https://doi.org/10.1007/s10680-013-9295-4
Mahler, L., Tertilt, M., & Yum, M. (2025). Policy concerns in an era of low fertility: The role of social comparisons and intensive parenting. Centre for Economic Policy Research.
Malak, N., Rahman, M. M., & Yip, T. A. (2019). Baby bonus, anyone? Examining heterogeneous responses to a pro-natalist policy. Journal of Population Economics, 32, 1205–1246. https://doi.org/10.1007/s00148-019-00731-y
Milligan, K. (2005). Subsidizing the stork: New evidence on tax incentives and fertility. Review of Economics and Statistics, 87(3), 539–555. https://doi.org/10.1162/0034653054638382
Neels, K., Theunynck, Z., & Wood, J. (2013). Economic recession and first births in Europe: Recession-induced postponement and recuperation of fertility in 14 European countries between 1970 and 2005. International Journal of Public Health, 58(1), 43–55. https://doi.org/10.1007/s00038-012-0390-9
Norway’s Birth Rate Committee. (2026). Declining birth rates in Norway: Final report from the Birth Rate Committee. https://nettsteder.regjeringen.no/ufvb/english/
Nygård, M., Nyby, J., & Kuisma, M. (2019). Discarding social investment and redistribution in the name of austerity? The case of Finnish family policy reforms 2007–2015. Policy and Society, 38(3), 519–536. https://doi.org/10.1080/14494035.2019.1655834
Olivetti, C., & Petrongolo, B. (2017). The economic consequences of family policies: Lessons from a century of legislation in high-income countries. Journal of Economic Perspectives, 31(1), 205–230. https://doi.org/10.1257/jep.31.1.205
Paas, T., & Gortfelder, M. (2025, June). The impact of increased family benefits on fertility in Estonia [Conference paper]. Nordic Demographic Symposium 2025, Middelfart, Denmark.
Puur, A., & Vseviov, H. (2019). Eesti sündimusareng ja perepoliitika võimalused. Akadeemia, 31(3), 387–429.
Rahnu, L., & Jalovaara, M. (2023). Partnership dynamics and entry into parenthood: Comparison of Finnish birth cohorts 1969–2000. Advances in Life Course Research, 56, 100548. https://doi.org/10.1016/j.alcr.2023.100548
Raute, A. (2019). Can financial incentives reduce the baby gap? Evidence from a reform in maternity leave benefits. Journal of Public Economics, 169, 203–222. https://doi.org/10.1016/j.jpubeco.2018.07.010
Reich, G. (2024). Determining the impact of the 2004 Australian Baby Bonus on fertility rates using a synthetic control analysis. Australian Economic Papers, 63(Suppl. 1), 23–32. https://doi.org/10.1111/1467-8454.12345
Risse, L. (2010). ”…And one for the country”: The effect of the baby bonus on Australian women’s childbearing intentions. Journal of Population Research, 27(3), 213–240. https://doi.org/10.1007/s12546-011-9055-4
Rotkirch, A. (2024). 20 ehdotusta lapsitoiveiden tukemiseksi: Selvitys syntyvyyden laskusta Suomessa. [20 proposals to support fertility Report on the declining birth rate in Finland] (Valtioneuvoston julkaisuja 2024:46). Publications of the Finnish Government 2024:46.
Rotkirch, A. (2025). The TikTok baby bust. https://blnreview.de/en/ausgaben/2025-04/anna-rotkirch-tiktok-baby-bust-fertility
Rotkirch, A. (2026). “Think about it all the time”. Reproductive cues in a late and low fertility setting. Vienna Yearbook of Population Research. https://www.austriaca.at/0xc1aa5572_0x00416d45
Rotkirch, A., Zaretckii, S., Heino, M., Mäki, M & Mace, R. (in preparation). The rising bar of family formation in Finland: A parental investment perspective. In preparation for James Heckman, ed., forthcoming, Frontiers of Fertility. March 30, 2026 version.
Savelieva, K., Jokela, M., & Rotkirch, A. (2023). Reasons to postpone childbearing during fertility decline in Finland. Marriage & Family Review, 59(3), 253–276. https://doi.org/10.1080/01494929.2022.2083283
Shaw, S. J. (2025). On a microdemographic framework for decomposing contemporary fertility dynamics. Scientific Reports, 15(1), 30726. https://doi.org/10.1038/s41598-025-11522-9
Sinclair, S., Boymal, J., & de Silva, A. (2012). A re-appraisal of the fertility response to the Australian baby bonus. Economic Record, 88, 78–87. https://doi.org/10.1111/j.1475-4932.2012.00805.x
Sobotka, T., Skirbekk, V., & Philipov, D. (2011). Economic recession and fertility in the developed world. Population and Development Review, 37(2), 267–306. https://doi.org/10.1111/j.1728-4457.2011.00411.x
Sobotka, T., Matysiak, A., & Brzozowska, Z. (2019). Policy responses to low fertility: How effective are they? (Working Paper No. 1). UNFPA. https://www.unfpa.org/publications/policy-responses-low-fertility-how-effective-are-they
Sorsa, T., Lehtonen, N., & Rotkirch, A. (2023). Kuka haluaa lapsia 2020-luvulla? Perhebarometri 2022. Väestöliitto. https://www.vaestoliitto.fi/verkkojulkaisut/kuka-haluaa-lapsia-2020-luvulla/
Sosiaali- ja terveysministeriö. (2022). Lasten ja perheiden sosiaaliturva (Liite 3). https://stm.fi/documents/1271139/134362878/Liite+3+Lasten+ja+perheiden+sosiaaliturva.pdf
Stone, L. (2025). Expand the child tax credit: Pronatal policy works, and America can’t afford to forego it. Institute for Family Studies. https://ifstudies.org/ifs-admin/resources/briefs/ifsbrief-expand-the-child-tax-credit-2.pdf
Terveyden ja hyvinvoinnin laitos. (2026). Sosiaaliturvan menot ja rahoitus 2024 (Tilastoraportti 1/2026). Suomen virallinen tilasto. https://thl.fi/data-ja-tilastot/sote-talous/sosiaaliturvan-menot-ja-rahoitus
Thomas, J., Rowe, F., Williamson, P., & Lin, E. S. (2022). The effect of leave policies on increasing fertility: A systematic review. Humanities and Social Sciences Communications, 9(1), 262. https://doi.org/10.1057/s41599-022-01270-w
Tiitinen, A. (2022). Lapsettomuus. Terveyskirjasto. https://www.terveyskirjasto.fi/dlk00151
UNFPA. (2025). The real fertility crisis: The pursuit of reproductive agency in a changing world (State of World Population 2025). United Nations Population Fund. https://www.unfpa.org/swp2025
Vanhuysse, P., Medgyesi, M., & Gál, R. I. (2023). Taxing reproduction: The full transfer cost of rearing children in Europe. Royal Society Open Science, 10, 230759. https://doi.org/10.1098/rsos.230759
Vignoli, D., Minello, A., Bazzani, G., Matera, C., & Rapallini, C. (2022). Narratives of the future affect fertility: Evidence from a laboratory experiment. European Journal of Population, 38(1), 93-124.
Yonzan, N., Timilsina, L., & Kelly, I. R. (2024). Economic incentives surrounding fertility: Evidence from Alaska’s permanent fund dividend. Economics & Human Biology, 52, 101334. https://doi.org/10.1016/j.ehb.2023.101334
Yoo, S. H., & Sobotka, T. (2018). Ultra-low fertility in South Korea: The role of the tempo effect. Demographic Research, 38(22), 549–576. https://doi.org/10.4054/DemRes.2018.38.22