Life-histories in Finland
First results from the Survey of Health, Ageing and Retirement in Europe
The Finnish population is ageing. This demographic shift changes societies, bringing about new ways of life. Citizens, researchers, practitioners and policy-makers observe this development with great interest. This book investigates Finnish population ageing from a life-course perspective. This means that is looks into how lives unfold over time. This perspective helps us better understand the reasons for population ageing, and it gives us an idea of how societies will continue to change in the future. The topics of health and disability, health care, work and retirement, the financial situation, the family situation, and housing are discussed. The better we understand these topics, the better we can prepare for what the future holds for us.
Publication information
| Publisher | Väestöliitto |
|---|---|
| Author | Kathrin Komp-Leukkunen, University of Helsinki |
| ISBN | 978-952-226-211-0 |
| Publishing House | Väestöliitto |
| Layout | Lena Malm |
| Pages | 88 |
Summary - Tiivistelmä
The Finnish population is ageing quickly. This demographic shift changes the lives of Finns, who now have to plan for a longer life. It also changes Finnish society, which has to restructure its labor market, care arrangements, and urban planning, among other things. Researchers, practitioners, and the Finnish citizens wonder what changes they can expect. This book provides the first answer. It outlines the situation among older Finns and traces their life-courses. Life-courses describe developments over time in our lives. Thereby, they give us a deeper understanding of the current situation and an indication of what the future may hold. The information in this book stems from the Survey of Health, Ageing and Retirement in Europe. Finland first collected data within this survey in 2017. Thanks to this development, it now has in-depth data on the Finnish situation, and the data that shows how Finland ranks in international comparisons. This book introduces the Finnish data collection within the Survey of Health, Ageing and Retirement in Europe. Moreover, it presents an analysis of this data. It explores the health and health care use of older Finns. Additionally, it studies their work, retirement, and income situation. Finally, it examines their personal relationships and housing situation. The findings help us better understand and respond to the on-going social change in Finland.
Suomen väestö ikääntyy nopeasti. Tämä väestörakenteen muutos tuo elämänmuutoksia suomalaisille, joiden on nyt suunniteltava elämäänsä pidempää elinaikaa varten. Se muuttaa myös suomalaista yhteiskuntaa, jonka on muokattava muun muassa työmarkkinoitaan, hoitojärjestelyjään ja kaupunkisuunnitteluaan. Tutkijat, asiantuntijat ja Suomen kansalaiset ihmettelevät, mitä muutoksia he voivat odottaa. Tämä kirja antaa ensimmäisen vastauksen. Siinä hahmotellaan ikääntyneiden suomalaisten tilanne ja havainnollistetaan heidän elämänkaariaan. Elämänkaaret kuvaavat elämämme kehitystä ajan myötä. Siten ne antavat meille syvemmän käsityksen nykyisestä tilanteesta ja merkkejä siitä, mitä tulevaisuudelta voidaan odottaa. Tämän kirjan tiedot ovat peräisin Survey of Health, Ageing and Retirement in Europe -käyntihaastattelututkimuksesta. Suomi keräsi tietoja tähän paneelitutkimukseen ensimmäisen kerran vuonna 2017. Tämän kehityksen ansiosta sillä on nyt syvällistä tietoa Suomen tilanteesta ja tietoa siitä, että miten Suomi sijoittuu kansainvälisissä vertailuissa. Tämä kirja esittelee Survey of Health, Ageing and Retirement in Europe -tutkimuksen Suomen aineistoa. Lisäksi siinä esitetään analyysi tästä aineistosta. Se käsittelee ikääntyneiden suomalaisten terveyttä ja terveydenhuollon käyttöä. Lisäksi se tutkii heidän työ-, eläkeja tulotilanteitaan. Lopuksi siinä tarkastellaan heidän henkilökohtaisia suhteitaan ja asumistilanteitaan. Löydöt auttavat meitä ymmärtämään paremmin käynnissä olevaa yhteiskunnallista muutosta Suomessa ja paremmin vastaamaan siihen.
1. Finnish life-courses: A phenomenon of central interest in times of population ageing (Komp-Leukkunen)
Kathrin Komp-Leukkunen, University of Helsinki
The Finnish population is ageing. Every fifth Finn today is aged 65 years or older, and by 2050, already every fourth Finn will be in this age group. These numbers place Finland among the countries with the oldest and the fastest ageing populations worldwide (United Nations, 2019). This type of demographic shift changes societies. It shrinks the workforce and, at the same time, creates options for work after retirement. It increases the need for health care and the number of older people who may provide health care. Moreover, it brings about new ideas and ways of life. Citizens, researchers, practitioners and policymakers observe this development with great interest. How population ageing progresses will also influence the way our lives progress. The better we understand population ageing, the better we can prepare for what the future holds for us.
Life-courses play a central role in understanding population ageing. Life-courses describe how the lives of individuals unfold over time, from birth until death. They follow characteristic developments, in which childhood circumstances inform middle-age, which in turn inform old age. Therefore, they show how a person’s experiences at a younger age make them who they are when they are old. Past developments shape the current situation. Thus, one needs to understand the lives of older individuals to understand what the older population is like today. A closer look at life-courses helps us to collect the knowledge needed (Komp & Johansson, 2016).
At the same time, life-course influences entail that one cannot influence population ageing by addressing older individuals only. Some of the activities, life situations, and preferences of older individuals result from their previous experiences. To influence these activities, life situations, and preferences, one would need to influence the experiences causing them. This is impossible when it comes to today’s older individuals, because we cannot go back in time. However, it is still possible when it comes tomorrow’s older individuals, because we can influence them while they are still young and middle-aged. Consequently, policies on population ageing should consider the situation of individuals of all ages – youths, middle-agers, and older individuals. The life-course perspective helps us understand this necessity (Komp & Johansson, 2016).
Considering the insight that life-courses bring, research on them is crucial in Finland right now. Finland is experiencing a rapid progress of population ageing due to its short baby boom (Karisto, 2007; Komp-Leukkunen, 2018). As a consequence, the social changes due to population ageing will occur rapidly in Finland – whenever the baby boom generation experiences the next critical event or situation in their lives. For example, when they retired, the pension system experienced a shift in their balance between contributions and benefits. Another example, when the boomers’ health declines, the health care system will experience an increase in their users. Because of the rapid progression of population ageing, Finnish policymakers and practitioners need to react quickly. While other countries with a slow progression of population ageing have time to try to new solutions, reforms, and ideas in a process of trial-and-error, Finland does not have this luxury. It has to find solutions quickly, which means that it needs a solid basis of information on population ageing. The Survey of Health, Ageing and Retirement in Europe (SHARE) can help researchers to generate this information. SHARE is the largest pan-European panel study in the social sciences. It has been collecting data since 2004, and since 2017 also in Finland. When Finland joined SHARE, it opened up opportunities for extensive new ageing research that may benefit Finland’s response to the ageing of its population. SHARE allows for country-comparison, including Finland, and for single-country studies that tease out the specificities of the Finnish case. Moreover, it allows for life-course studies and for research that focusses on snapshots of one point in time. Given these rich options for research, we can expect the findings from SHARE Finland to enhance our scientific and societal debates and our decision-making. This book presents the first findings from the Finnish life-course data in SHARE to start the debate.
In the next chapter, Miika Mäki, Henri Mikkola, and Sakari Sandqvist provide an introduction to SHARE Finland. They characterize the SHARE survey, describe how the Finnish data for SHARE was collected, and what information in contains. Moreover, they explain how the dataset is structured. Therefore, this chapter serves as an excellent introduction for researchers who wish to start working with the dataset.
Afterwards, two chapters look into the health situation of older Finns. Initially, Jenni Kulmala, Inna Lisko, and Zhen Im explore the health status of Finland’s population. They underline that population ageing in Finland will speed up over the next years, leading to a considerable increase in the number of the oldest-old. Yet, this demographic shift does not predetermine the development of health among older Finns. Changes to their diet and lifestyle can still make a difference, and such changes are easy to implement. Then, Kathrin Komp-Leukkunen investigates the use of health care services. She shows that the use of health care services is not yet that pronounced among older Finns, even though she expects it to increase over the coming years. The use of these services is higher among women than among men. This is partly due to gender-differences in the life-expectancy, and partly due to gender-specific social roles.
Then, two chapters take a closer look at the question of work among older Finns and retirement. Kathrin Komp-Leukkunen investigates their participation in work and retirement. She shows that from a life-course perspective, Finland has an exceptionally high labour market participation. Over time, work in Finland got physically less demanding while increasingly involving computer use. Today, most older workers are satisfied with their working time, but some wish they could work shorter hours. Next, Kati Kuitto, Aart-Jan Riekhoff and Liisa-Maria Palomäki explore the financial situation of older Finns. They show that even though most older Finns had experienced financial hardship at some point of their lives, they are in an overall good financial situation now. Married and healthy older individuals with a high educational level can make ends meet particularly easily. In contrast, divorced and unemployed individuals with health problems struggle to make ends meet.
Subsequently, two chapters explore the home life of older Finns. Anna Erika Hägglund and Anna Rotkirch study their family situation. They highlight that over historical time, cohabitation and remarrying became more common. Nowadays, widowhood is concentrated among very old women. Those who are in a relationship appreciate it especially because of the love and respect for their partner. Finally, Henri Mikkola and Juho Hänninen investigate housing and geographical differences across the life-course in Finland. They show that the majority of older Finns were born in a village or rural area. Yet, many moved to the city with the urbanization process. Nowadays, the majority of the Finns aged 50 years and older owns their own place.
References
Karisto, A. (2007). Finish baby boomers and the emergence of the third age. International Journal of Ageing and Later Life, 2, 91–108. https://doi.org/10.3384/ijal.1652-8670.072291
Komp, K., & Johansson, S. (2016). Population ageing in a lifecourse perspective: Developing a conceptual framework. Ageing and Society, 36(9), 1937–1960. https://doi.org/10.1017/S0144686X15000756
Komp-Leukkunen, K. (2018). Working-age life-courses in Finland: A comparison of the cohorts born 1945-51 and 1961-67. Research on Finnish Society, 11, 8–23.
United Nations (2019) World population prospects 2019. Retrieved from https://population.un.org/wpp/Download/Standard/Population/ on November 16, 2020.
2. SHARELIFE interviews in Finland (Mäki, Mikkola & Sandqvist)
Miika Mäki, Family Federation of Finland
Henri Mikkola, Family Federation of Finland
Sakari Sandqvist, Taloustutkimus
This chapter introduces the Survey of Health, Ageing and Retirement in Europe (SHARE), focusing particularly on its life history interviews in Finland. SHARE is the world’s largest study on ageing. It encompasses 380,000 face-to-face interviews of 140,000 individuals and couples aged 50 years and over from 28 European countries. The infrastructure is a unique source for comparing the lives of ageing Europeans. Thanks to its multidisciplinary panel structure, SHARE can be harnessed to study the interaction of health, economics, work, and social relations over time (for more information and data access, see: SHARE-ERIC, 2020). SHARE has served as the data source for over 2,000 publications. Many of those studies have been crucial in making informed policy decisions nationally, in Europe as well as globally. Thus, SHARE plays an important role in tackling one of the hardest societal challenges in the developed countries of the 21st century, rapid population ageing.
SHARE was created after the European Commission acknowledged population ageing as one of the biggest issues for the future of Europe and signaled that Europe lacked an infrastructure that would help in understanding individual and population ageing (Brussels, 21.12.2000; COM (2000) 846 final & Council Document 6997/01). The first wave was gathered in 2004. Already in 2011, SHARE became the first European Research Infrastructure Consortium (SHARE-ERIC). SHARE is a landmark of the European Strategy Forum on Research Infrastructures and provides a foundation for empirical research on ageing through many disciplines (ESFRI, 2016). SHARE is harmonized with similar panel surveys across the world.
Finland joined SHARE together with the remaining EU Countries in 2016, when the EU extended the coverage of the SHARE survey to all Member States with a minimum sample size, allowing a better monitoring of ageing (VS/2016/0135) incorporated more countries into the infrastructure. As Finland is one of the most rapidly ageing countries in the world, it is crucial to be part of a research project that provides the most extensive and comparable data on the subject worldwide.
SHARE rests on the following four pillars. First, there is a possibility to compare trends cross-nationally and infer policy implications. Secondly, longitudinal design enables interviewing the same respondents every two years, capturing ageing as a process and not merely as a stage. Thirdly, having variables from multiple scientific fields allows for studying life courses holistically. Finally, combining both objective and subjective information is a gold mine for intriguing research questions.
Thus, SHARE can be used to answer questions with high academic and policy relevance, such as: How are socioeconomic status and health linked over the life course? What are the micro- and macro-level implications of increasing the retirement age? How are working conditions, retirement, and cognitive functioning interrelated? How are intergenerational relationships affected by the increase in the dependency ratio? (SHARE-ERIC, 2018)
An infrastructure that combines information from different domains across time and nations is ideal for acquiring a holistic understanding about population and individual ageing. For example, wellbeing is associated with social relationships, partnership status, welfare state support, economic situations, occupation, living arrangements, individual differences in behavior, and health, which in turn are in complex interaction with one another (Börsch-Supan et al., 2019). SHARE provides an opportunity to gain knowledge about these processes.
An existing research infrastructure in times of crises is also essential for recovering from societal shocks. SHARE has contributed to understanding the economic crisis in 2008, as the study has followed the respondents through the 2000s. The same applies to the COVID-19 pandemic: the eighth wave of SHARE was gathered just before the lockdown, and a COVID-19 telephone survey was conducted at the end of the first wave of the pandemic. A second COVID-19 survey will be carried out in the spring of 2021, which means that SHARE will have micro-level information about the social, economic and health conditions of Europeans aged 50+ at all stages of the pandemic.
Implementation of wave 7 fieldwork in 2017
“We have laughed and cried with the respondents when they have recounted the stories of their lives” A Finnish Interviewer
Preparations for the first wave of the Finnish SHARE started in 2016 with the establishment of the Finnish Country Team (see more under “The organization of SHARE in Finland and in Europe”). SHARE is collected as a Computer Assisted Personal Interview (CAPI). The pretest and field rehearsal rounds were carried out by Taloustutkimus in August and in November/December 2016, respectively. Taloustutkimus is a Finnish survey agency established in 1971. It is currently the second largest full-service market and opinion research company in Finland. Taloustutkimus has 60 full-time employees and anationwide interviewer network with nearly 300 interviewers. The company has extensive experience in international surveys and, in addition to SHARE, it has completed the data collection of surveys such as the European Values Survey, the European Working Conditions Survey, and the European Minorities and Discrimination Survey.
Taloustutkimus was responsible for all tasks related to data collection and fieldwork, such as sample design and management, installing and maintaining the sample distributor, printing and sending the advance letters, panel care (thank you letters, birthday and Christmas cards), and producing and translating training materials. The survey company also sent 2–3 survey specialists (Sakari Sandqvist, Jari Kääriäinen, and Tuomo Turja) to “Train the Trainer” events before each stage of the data collection. These specialists then trained the interviewers for pretesting, field rehearsal, and main data collection. More than 50 interviewers were trained, and 41 interviewers participated in the main data collection. Some interviewers covered rather large geographical areas, especially in Northern and Central Finland. The interviews were conducted in Finnish or Swedish.
Quality control was mainly handled as callbacks. At least 10% of the interviews of each interviewer were verified by a quality controller of the survey agency. Also, the length of the interview and contact sheet entries were monitored regularly. If the interviewers encountered problems or challenges, they were offered support and additional training. The main data collection was carried out between March and September 2017.
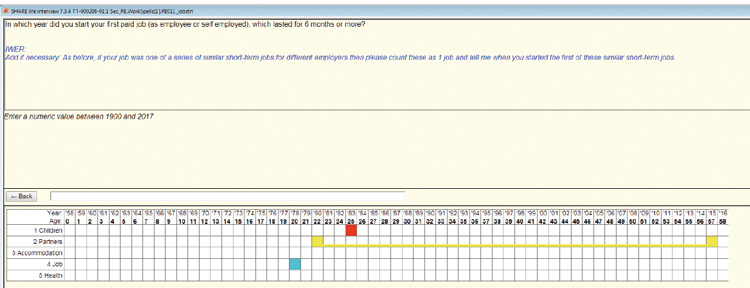
The study uses many tools to support the flow of the interview. For instance, any names mentioned in the survey are stored, which enables the interviewer to link the same persons across modules. Of course, the names are not published. For example, a child or a partner can be mentioned in modules dealing with children, partner, social support, social networks, or financial transfers across multiple waves. Each event along the life course is stored in a calendar that both the interviewer and respondent can access (Figure 2.1). This makes it easier to remember when a life event has happened as it can be compared to other important events surrounding it.
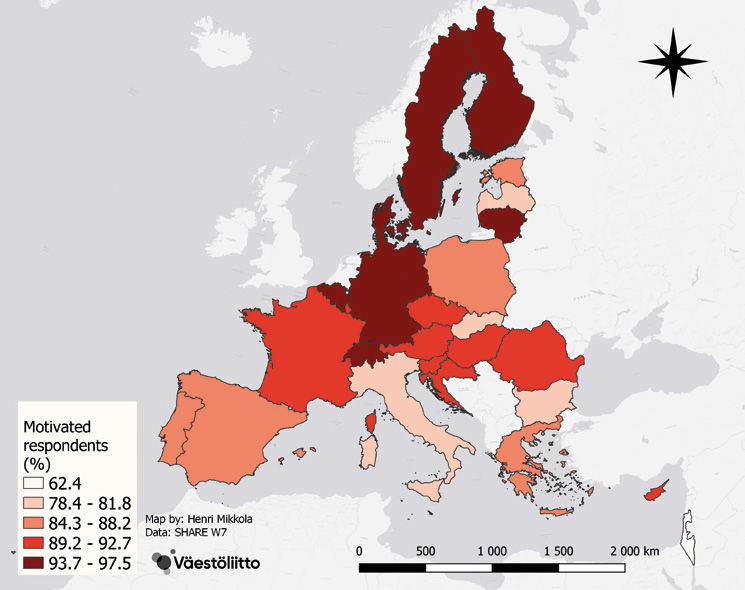
In European comparison, Finns were among the most willing to answer the survey (Figure 2.2). The interviewers were also committed, as they perceived SHARE as a meaningful and important project, according to the interviewers. The respondents shared both their joys and sorrows with the interviewers: “We have laughed and cried with the respondents when they have recounted the stories of their lives,” reports one Finnish interviewer.
Sample
The baseline sampling of SHARE in Finland is a two-staged stratified sample from the population register. First, zip code areas are used as sampling units. The sample covers continental Finland; the autonomous Åland islands is excluded from the survey. Second, households with at least one person aged 50 years or over are randomly drawn from within the sample units. Persons belonging to the target population are randomly included into the study sample in proportion to the population in different regions and levels of urbanization. In addition to individuals included in the sample, their partner who lives in the same household is interviewed whenever possible. In Finland, the net sample was 2,000 respondents with the response rate of 53 percent. One fourth of the interviews were of respondents who did not have a partner living in the household, the rest were couple households. Even partners that are under 50 years of age were interviewed. A total of 77,263 interviews were conducted in all SHARE countries in wave 7. For more information about SHARE sampling in all SHARE countries, see Bethman, Bergmann and Scherpenzeel (2019).
Organization of SHARE in Finland and in Europe
The Population Research Institute (PRI) of the Family Federation of Finland is the Scientific Partner Institution (SPI) of SHARE in Finland. The research focus of the PRI is family sociology and demographic change, which makes it a natural home for the infrastructure.
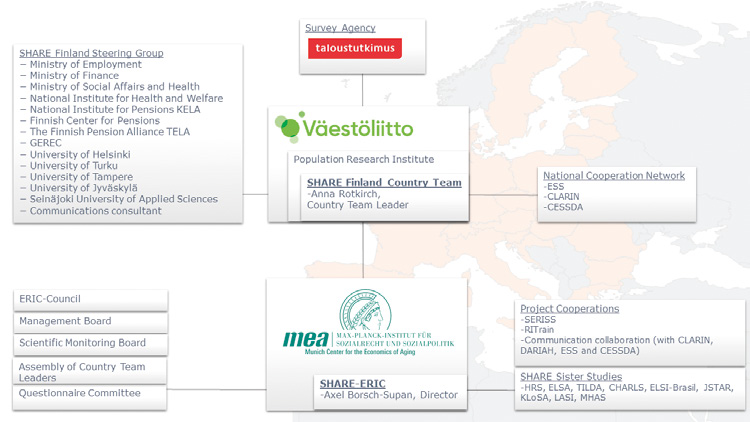
The Finnish Country Team consists of the Country Team Leaders Anna Rotkirch and Miika Mäki, Country Team Operator Henri Mikkola, Research Assistants Amanda Pitkänen and Milja von Lerber, Communication Specialist Tiina Helamaa, and Senior Researcher Mirkka Danielsbacka. The country team is in charge of the implementation of the survey in Finland. This includes acquiring funding, translating the questionnaires, planning a country-specific paper and pencil questionnaire, testing the interviewing instruments, providing user support, and promoting the possibilities of the data for researchers and decision makers alike. Figure 2.3 shows the organization of the Finnish SHARE team and its European headquarters.
The Finnish infrastructures in social sciences and humanities¹ co-operate to take advantage of synergies and promote the datasets in joint events. Similar co-operations exist internationally between other infrastructures and SHARE’s sister studies².
The Munich Center for the Economics of Ageing (MEA) coordinates the infrastructure internationally. MEA is a department of the Max Planck Institute for Social Law and Social Policy. Six teams focusing on questionnaire development, operations, data base management, survey methodology, finances, and public relations are responsible for the central coordination. All strategic scientific and financial matters are decided by the SHARE Management Board. The SHARE-ERIC Council supervises the operations, approves budgets, and schedules and selects the members of the SHARE management board.
¹ Common Language Resources and Technology Infrastructure (CLARIN), European Social Survey (ESS), Consortium of European Social Science Data Archives (CESSDA)
² Health and Retirement Study (HRS), English Longitudinal Study of Ageing (ELSA), The Irish Longitudinal Study on Ageing (TILDA), Chinese Health and Retirement Survey (CHARLS), Estudo Longitudinal de Saúde do Idoso (ELSI-Brasil), The Japanese Study of Aging and Retirement (JSTAR), The Korean Longitudinal Study of Aging (KLoSA), The Longitudinal Aging Study in India (LASI), Mexican Health and Aging Study (MHAS)
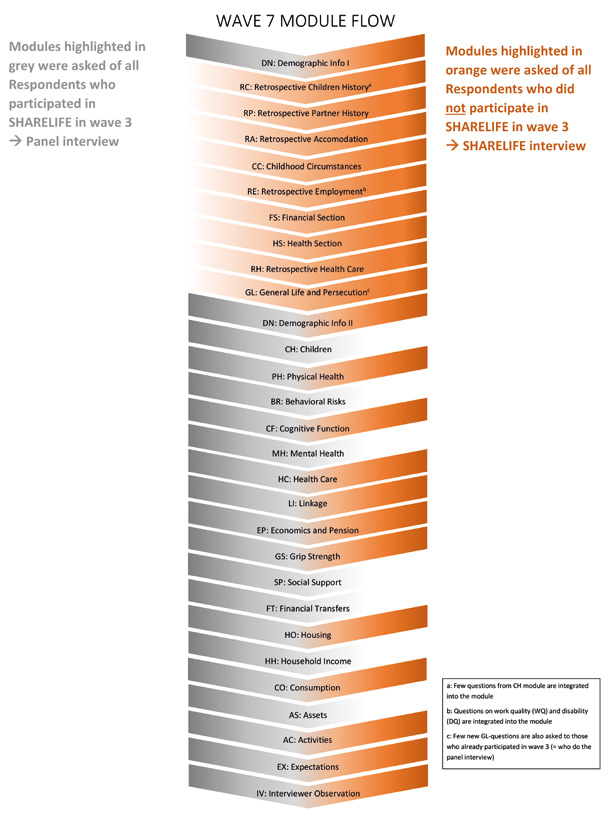
Contents of the SHARELIFE interviews
As a panel study, SHARE gathers information on respondents’ current situation biannually. However, the third and the seventh wave introduced a series of modules for retrospective life history data on a vast range of life course areas (SHARELIFE). Figure 4 depicts the flow of the questionnaire. During the 90-minute face-to-face interview, the respondents lay out their lives from multiple perspectives. While there are also some general questions, the majority of the interview deals with life histories: hence the name SHARELIFE. After gathering basic demographic information about the respondents and their immediate family, the interviewer starts inquiring about significant life events: the children they may have had, both biological and adopted, whether the birth was followed by parental leave, and how long a break the parent took from paid work.
The subsequent retrospective partner module introduces researchers to the relationship history of older Europeans: whether the respondents have ever been married, cohabited or had dating partners, and when all of this has happened. For instance, if they were married, the data tells when the relationship started, when they moved in together and got married. In case the relationship ended, the reason for that is also reported. This feature allows researchers to study the dynamics of partnership trajectories.
Living arrangements are an integral part of the life of an individual. The retrospective accommodation module journeys with the respondents as they move out of their parents’ residence, establish their own household, move in with in-laws or whenever they move from one place to another. In addition, this module documents contentment with the living arrangements.
The childhood circumstances module consists of living conditions and significant incidences mainly in young adolescence. How many people, rooms or books were in the dwelling where each respondent lived when they were ten years of age? Were both parents present and were there relatives or step siblings in the household? What was the socioeconomic situation of the household? How well did they do in school? How about the relationship with the people who raised the respondents? Did physical punishment take place? Loneliness? These are just a few of the items that are at the disposal of the researcher when trying to understand the background of older Europeans.
The following sections encompass rich data about employment and finances: where people have worked, how much they have earned, and what kind of investments they have made during their lives. Not only are the occupations classified according to the International Standard Classification of Occupations (ISCO; ILO, 2016), but even episodes outside the labor force are reported, whether as housewife or husband, studying, managing assets, incarcerated or exiled.
The questionnaire also covers qualitative aspects of work episodes. The work quality module offers detailed characteristics with regards to the current or – in case of retired respondents – the main job of their work career. These include, but are not limited to, physical demands, time pressures, conflicts, autonomy, atmosphere, sense of fairness, and adequacy of salary.
The next sections extensively cover health and health care. Both sections start off with a few questions related to childhood: self-assessed childhood health, extensive periods out of school or in a hospital, vaccinations and dentist visits, to name a few. Thereafter, respondents are asked to report on possible physical diseases, injuries and forgone care during their entire life course. Not only are the individual health conditions listed, but also the consequences thereof – how they affected personal and work life, for example, by making social life more difficult or having to work on tasks below one’s qualifications.
In addition to retrospective health accounts, SHARE also collects biannually both objective and subjective health measures, such as grip strength, word recall, and self-assessed health. Well-being in a more general sense can be studied with items such as life satisfaction, looking back at life happily, future prospects, sense of control, and whether age or lack of money prevent the respondents from doing things they desire.
The life trajectories are complemented with the general life module. The respondents are asked when they have been the happiest, under more stress, under more financial hardship, or if they have been discriminated for any grounds. Questions on extreme life events such as war and persecution for both the respondents and their parents aid in further understanding the makeup of individual lives.
The remainder of the questionnaire offers a range of miscellaneous research opportunities. The consumption module gives us information about the amount of money people use for food in and outside of the household and whether they consume vegetables, fruit or meat that they have grown, produced, caught or gathered themselves. The activities module offers a window to leisure activities. There is also a section on the Big Five personality traits for the psychologically oriented researchers.
Finally, Finland has a country specific paper and pencil questionnaire, which deals mainly with relationship quality: whether respondents are (dis)satisfied in their relationships and how much they argue about money, sex, time consumption, or household chores. For an exhaustive review, please have a look at Hägglund & Sorsa (forthcoming).
The following chapters provide a window to the trends of SHARE wave 7 data with special focus on Finland. For a more general overview of the preliminary results of wave 7, see Börsch-Supan et al. (2019).
Acknowledgements
We would like to thank our funders, the Finnish Center for Pensions ETK, the National Institute for Pensions KELA, Yrjö Jahnsson’s foundation, the Local Government Pensions Institution KEVA, the Finnish Culture Foundation, the Ministry of Economic Affairs and Employment, the Ministry of Social Affairs and Health and DG Employment, for their generous support. A special thanks to our host organization, the Family Federation of Finland, who also contributes to the funding and supports the implementation of the survey in Finland by taking care of many of the sometimes tedious and complicated administrative tasks of an EU project.
References
Bethmann, A., Bergmann, M., & Scherpenzeel, A. (2019). SHARE sampling guide – wave 8. SHARE Working Paper Series, 33. Munich: SHARE-ERIC.
Börsch-Supan, A., Bristle, J., Andersen-Ranberg, K., Brugiavini, A., Jusot, F., Litwin, H., & Weber, G. (2019). Health and socio-economic status over the life course. First results from SHARE waves 6 and 7. Oldenbourg: De Gruyter. https://doi.org/10.1515/9783110617245
ESFRI (2016). Strategy Report on Research Infrastructures. Roadmap 2016. Brussels: European Commission.
Hägglund, A. E., & Sorsa, T. (forthcoming). Ikäihmisten parisuhteet. Perhebarometri 2021 [Relationships of older people. Family barometer 2021]. Helsinki: Väestöliitto.
ILO (2016). ISCO – International Standard Classification of Occupations. Retrieved from www.ilo.org/public/english/bureau/stat/isco/isco08/ on November 26, 2020,
SHARE-ERIC (2018). Annual Activity Report 2017/18. Munich: SHARE-ERIC.
SHARE-ERIC (2019a). SHARELIFE calendar facilitating sequential and cross-dimensional recall methodology [Image]. In: Bergmann, M., Scherpenzeel, A., & Börsch-Supan, A. (Eds.), SHARE Wave 7 Methodology: Panel Innovations and Life Histories. Munich: Munich Center for the Economics of Aging.
SHARE-ERIC (2019b). Wave 7 Module Flow [Image]. Retrieved from www.share-project.org/fileadmin/pdf_questionnaire_wave_7/SHARE_Moduleflow_wave_7.pdf on November 26, 2020.
SHARE-ERIC (2020). SHARE – Survey of Health, Ageing and Retirement in Europe. Retrieved from www.share-project.org/ on November 26, 2020.
3. Exploring the lives of older Finns
Next chapters explore the lives of older Finns.
3.1 Health and disability across the life-course (Kulmala, Lisko & Im)
Jenni Kulmala, Tampere University, Finnish Institute for Health and Welfare, Karolinska Institutet (Sweden)
Zhen Im, University of Helsinki
Inna Lisko, University of Jyväskylä, Karolinska Institutet (Sweden)
Ageing and health
to support healthy ageing, not just adding years to life. In upcoming years, especially the amount of the oldest old population is rapidly increasing. In Finland, the number of people aged 85 and over is currently about 150,000, and it has been estimated that this number will almost double by the year 2035 (Statistics Finland 2020a, 2020b, 2020c). Health and functional capacity in old age include several aspects, which all provide slightly different information. In this chapter, we provide preliminary results from the SHARE wave 7 and report the descriptive statistics showing the current state of self-rated health, prevalence of common long-term illnesses and difficulties in performing daily activities in this population, focusing mainly on Finnish cohort.
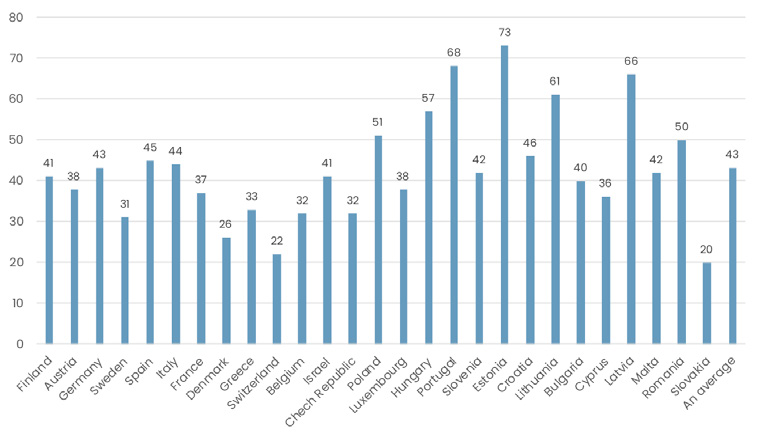
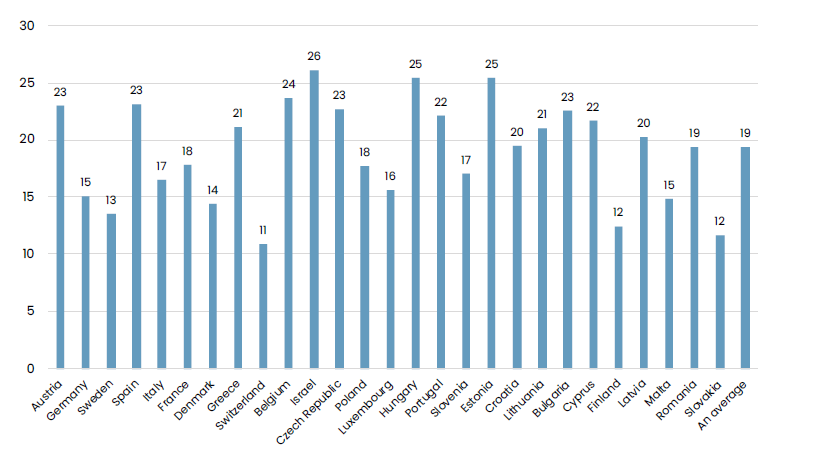
One common way to assess the health of older people is to examine their self-rated health by asking: “How is your health in general? Is it excellent, very good, good, fair, or poor?” Self-rated health is a strong predictor of future health events and is associated with functional decline, well-being, clinical diagnoses and mortality across different populations and ages (Jylhä, 2009). In SHARE population, self-rated health was assessed using a similar Likert-scaled item. Answers were dichotomized into good health (good or better) and poor health (less than good). The preliminary findings showed that there were slight differences on self-rated health in different countries. Figure 3.1.1 presents the percentages of persons reporting poor self-rated health across countries. The highest percentage of poor health was reported in Estonia (73% of the SHARE population). Relatively high percentages were observed also in Hungary, Latvia, and Lithuania. In Finland, 41% out of 1,965 respondents reported poor self-rated health.
In previous cross-national reports from mid-2000’s, the proportion of poor/fair self-rated health among older adults in four European countries have ranged from 36% (65–74-year-olds in the Netherlands) to 72% (75–84-year-olds in Spain), thus showing similar numbers as here (Bardage et al., 2005). Findings from the Finnish Health 2001 and 2011 Surveys show that self-rated health has improved in time in all age groups over 10 years (Koskinen et al., 2012). However, in all, when interpreting results from different studies on self-rated health, it is important to take into account that cultural conventions in expressing positive and negative opinions vary and partly affect health rating (Jylhä, 2009).
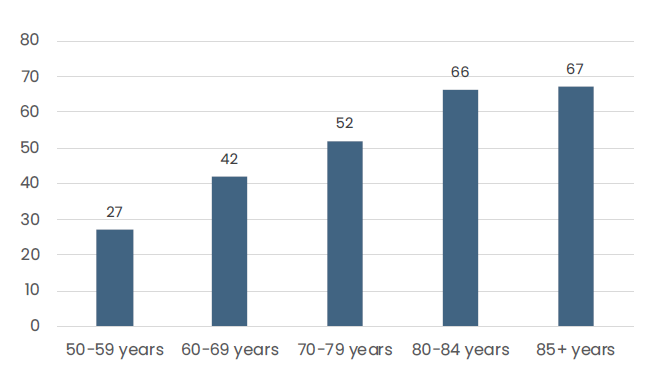
In the Finnish cohort, percentages of respondents reporting poor self-rated health increased with increasing age among both men and women. In men (n=915), poor self-rated health was reported by 27% in the youngest age group (50-59 years), but the amount increased up to 67% among persons aged 85 years and over (Figure 3.1.2). Similar findings have also been reported before. Among Finnish men, the proportion of less than fairly good self-rated health ranged from 31% (55–64-year-olds) to 54% (age 75+) in 2011 (Koskinen et al., 2012). Yet, these results are not fully comparable due to different age groups and wordings.
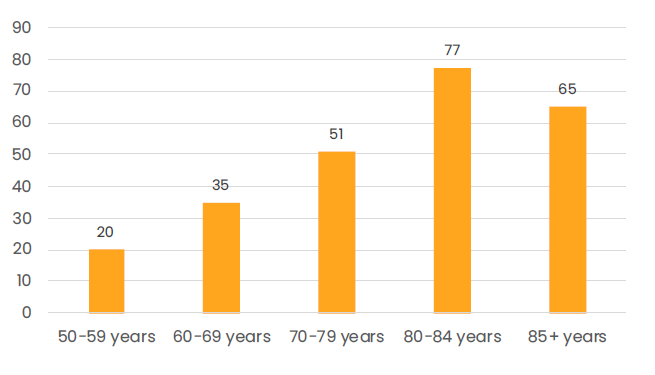
Among Finnish women (n=1050), poor self-rated health was relatively rare in the youngest age groups (20%), but increased with age, being 77% among people aged 80-84 years. The results are fairly similar to previous observations among Finnish women, where the proportion of less than fairly good self-rated health ranged from 27% (55–64-year-olds) to 57% (age 75+) in 2011 (Koskinen et al., 2012). In the oldest old (aged 85 and over) age group, the percentage of women reporting poor self-rated health was 65% (Figure 3.1.3). Since poor self-rated health was very common in older age groups and it is known to be a significant indicator of adverse health outcomes, this high number deserves further attention in future studies.
When it comes to older people, self-rated and objective health are usually not exactly the same thing. Objective health can be regarded, for example, as a medical diagnosis, while self-rated health is also influenced by social and biological pathways that mediateinformation to individual consciousness (Jylhä, 2009). Even though people in higher age groups tend to rate their health worse than younger people, as people get older, they also lower their standards on what they consider as good health and they adjust their health ratings accordingly (Jylhä et al., 2001). Especially among the oldest old, discrepancies exist between objective health and self-rated health. Findings from a Danish study show that the oldest old have high prevalence of self-reported disability and functional limitations, but still most of them consider their health to be good and are satisfied with their life (Nybo et al., 2001).
Objective health is often assessed by investigating the number of chronic illnesses or conditions. With increasing age, comorbidity becomes more and more common. Common long-term illnesses, which in many cases also lead to functional decline, include cardiovascular diseases, which are still the most common cause of death, hypertension, cancer (the second leading cause of death), osteoarthritis, diabetes, and osteoporosis. For people aged 65 and over, it is also very common to have more than one chronic disease simultaneously, which further increases the risk of functional decline and need for care (Jaul & Barron, 2017).
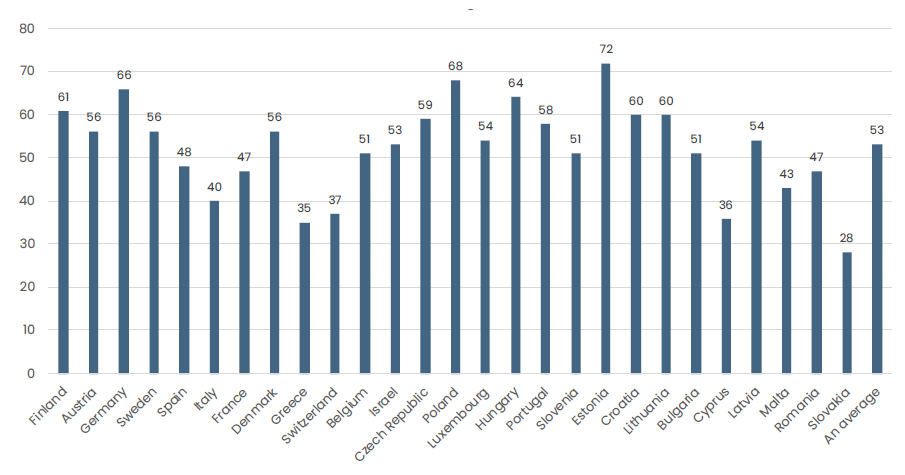
Of the total SHARE population, 53% of people aged 50 and over reported having at least one long-term illness (heart attack, high blood pressure, high blood cholesterol, stroke or cerebrovascular disease, diabetes or high blood glucose, chronic lung disease, cancer or malignant tumor taken into account). When comparing the countries, the highest percentages of people reporting at least one long-term illness were found in Estonia (72%), Poland (68%), and Germany (66%) (Figure 3.1.4). Of the Finnish SHARE population, a total of 61% of people aged 50 or over reported having at least one longterm illness.
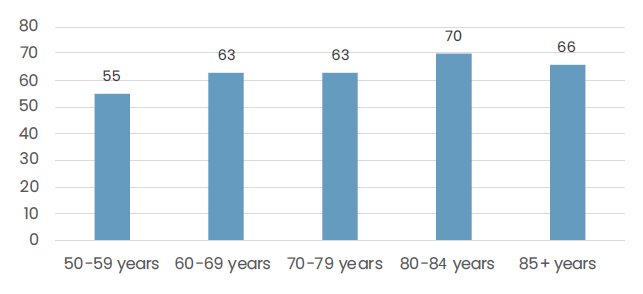
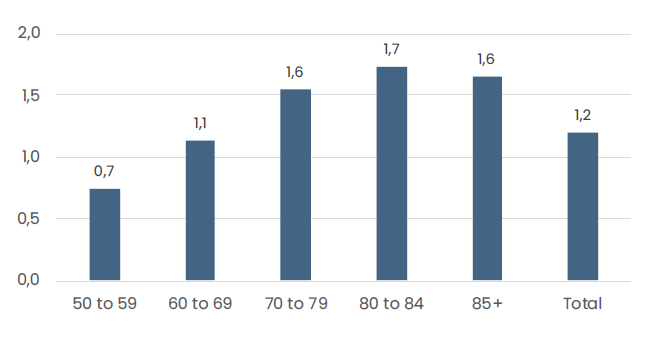
When looking at the Finnish SHARE cohort, only a slight increase in the prevalence of long-term illnesses with increasing age was observed. In the youngest age cohort (50-59 years), the prevalence of at least one long-term illness was 55%, and the highest prevalence was observed among those aged 80-89 years (70%; Figure 3.1.5). When looking at comorbidity in the Finnish SHARE cohort, the average number of long-term illnesses was 0.7 among 50–59-year-olds and 1.6–1.7 among people aged 80+ (Figure 3.1.6). Altogether, these numbers show that most of Finnish older adults live with long-term illnesses and therefore proper health care is important in order to maintain functional capacity and independency despite of these conditions.
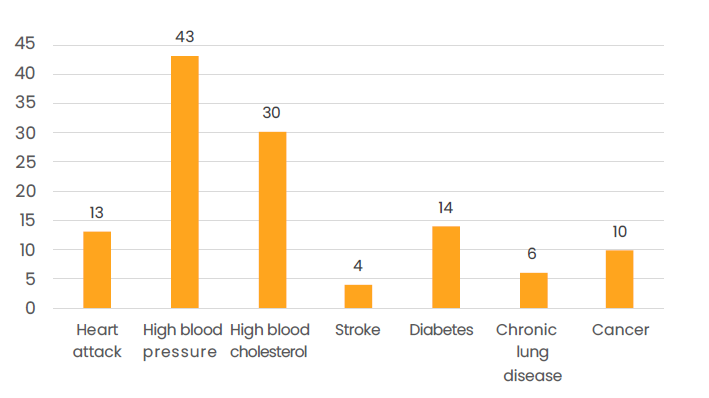
When looking at the long-term illnesses more closely, it was observed that especially high blood pressure and high cholesterol were relatively common in Finnish population. High cholesterol was reported by 30% and high blood pressure by 43% (Figure 3.1.7).
Disability in old age
Disability commonly refers to difficulties or need for help in performing activities of daily living (ADL), including basic activities (bathing, dressing, eating, getting in and out of bed) and more complicated instrumental activities of daily living (IADL; handling finances, shopping, using public transportation, doing housework) (Guralnik et al., 1996). In research, a distinction is often made between functional limitations, indicating difficulties in performing activities, and disability, indicating inability to independently perform activities. Disability prevalence increases with age, and based on a sample of Finnish older adults aged 90+ years, 23 percent have disability in basic daily activities and 58 percent in mobility (Enroth et al., 2020). However, recent studies have shown that the functional capacity and cognitive performance of older people have increased in recent decades. New results from the AGNES study showed that among 75- and 80-year-old men and women, performance in maximal functional capacity tests and several cognitive tests has significantly increased in 28 years (Koivunen et al., 2020; Munukka et al., 2020). Researchers offer various explanations for these changes. Overall, people born in later years got to benefit from several social reforms and had more favorable life-course exposures. People born in earlier years went through two wars, started working at a younger age, had poorer nutrition and hygiene, and less education. Furthermore, higher education is linked to better jobs, better economic situation, and better psychological resources. The differences may also be partly explained by improved medical care and access to health care.
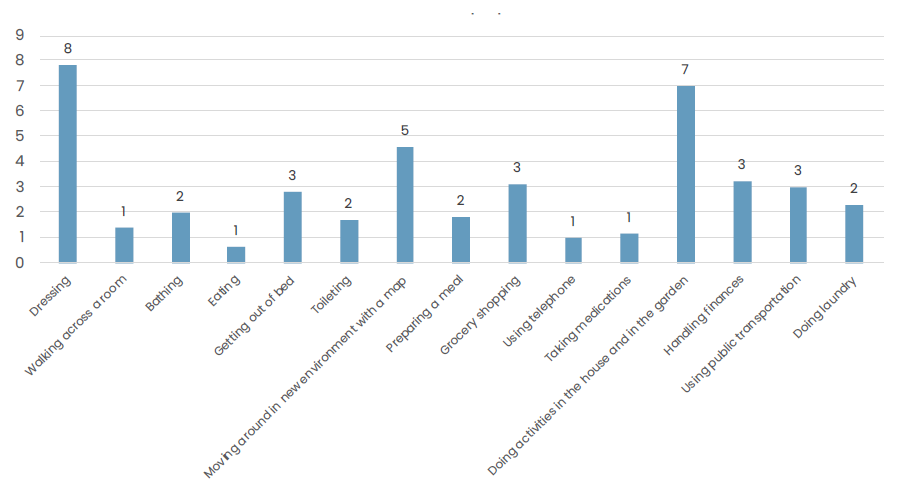
In the SHARE population, difficulties in daily activities were assessed using fifteen basic and instrumental activities of daily living. The assessed activities included dressing, walking across the room, bathing, eating, getting out of bed, toileting, moving around in a new environment with a map, preparing a meal, grocery shopping, using a telephone, taking medication, doing activities in the house and in the garden, handling finances, using public transportation, and doing laundry.
The number of participants with difficulties in at least one ADL task was relatively low in all countries (Figure 3.1.8). The highest numbers were observed in Portugal (22%) and Romania (18%). For IADL, the highest prevalence for difficulties in at least one IADL item were observed in Israel (26%), Hungary (25%) and Estonia (25%; Figure 3.1.9).
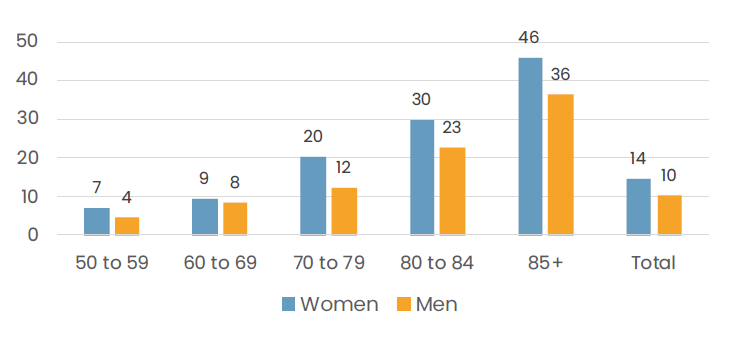
Men and women report to have a similar amount of difficulties in ADL, although the prevalences are some units of percentages higher in men throughout the age groups (Figure 3.1.10). However, in IADL a slightly higher number of difficulties was reported by women, especially in older age groups (3.1.11).” This trend of women being more disabled than men is observed in many studies. The reasons for this are explained by the longer duration of disability among women, higher prevalence of non-fatal chronic disease, lower muscle strength and bone density, and life-style factors such as physical inactivity or obesity (Leveille et al., 2000).
When looking at different daily activities, the most common activities where people reported having difficulties were dressing, moving around in a new environment with a map, and doing activities in the house and in the garden (Figure 3.1.12).
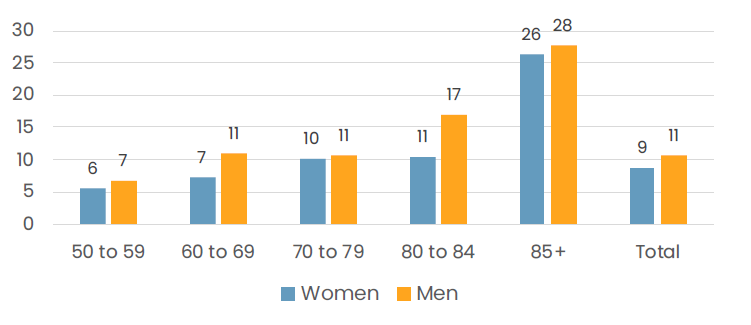
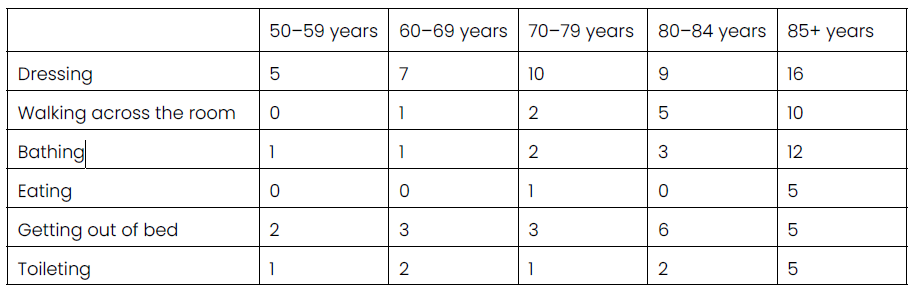
The percentage of persons reporting difficulties in daily activities increased with age. Difficulties in basic daily activities (dressing, walking across the room, bathing, eating, getting out of bed, toileting) were rare in the youngest age group, but among persons aged 85 years and over, 16% percent reported difficulties in dressing, 10% in walking across the room, and 12% in bathing (Table 3.1.1).
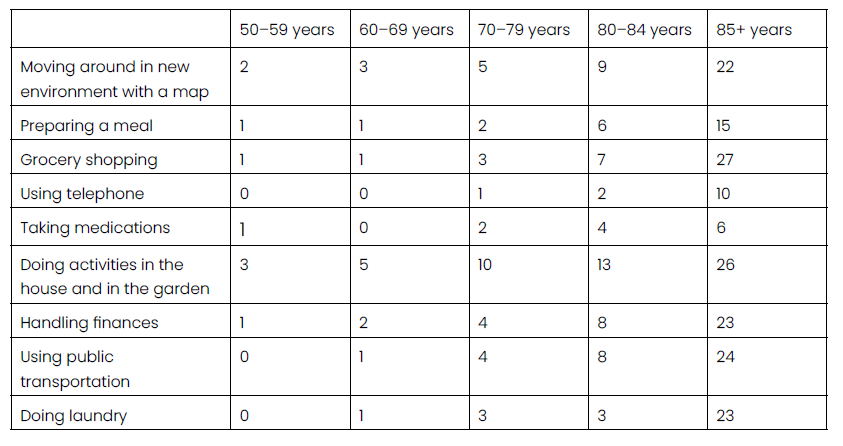
Also, in more complex instrumental activities of daily living, the percentage of people reporting difficulties was highest among those aged 85 and over. The most difficult tasks were grocery shopping (27% in the highest age group reported difficulties), activities in the house and in the garden (26% in the highest age group reported difficulties), and using public transportation (24% in the highest age group reported difficulties; Table 3.1.2).
Life-course factors promoting older age health and physical functioning
Current scientific literature has identified a large number of lifestyle-related factors associated with better health and physical functioning in old age. Physical activity is one of the most effective ways to support functional capacity. A review and meta-analyses by Tak et al. (2013) showed that a medium or high level of physical activity significantly reduced the risk of incident disability in basic activities of daily living based on nine longitudinal studies involving a total of 17,000 participants who were followed for 3-10 years. Also, a healthy diet supports healthy, active and independent old age. The components of a healthy diet are widely acknowledged, including vegetables, fruits, whole grain, fish and unsaturated fats. Several different diets include these components, but the Mediterranean diet is one of the most commonly studied and has been shown to have beneficial effects on both physical functioning and cognition. Social engagement and cognitive activities have been shown to be linked with many health-related outcomes. Evidence from observational studies and non-randomized interventions suggest that social activities may reduce the risk of disability and dementia through psychosocial, behavioral – such as time spent walking – and cognition-related pathways (Kuiper et al., 2016; Otsuka et al., 2018). Similarly, evidence from randomized controlled trials has shown positive effects of psychosocial interventions and social interaction on cognitive abilities (Duan et al., 2018). Finland has shown how to effectively promote cognitive and physical functioning among older people. The Finnish Intervention Study to Prevent Cognitive Decline and Disability, the FINGER trial, was the first large randomized controlled trial that showed that if we effectively modify dementia-related risk factors among older at-risk individuals, we are able to achieve significant beneficial effects on several cognitive domains and improve the physical functioning and quality of life of older adults (Ngandu et al., 2015).
In summary, SHARE wave 7 results about health, diseases and disability showed that the prevalence of diseases and disabilities increases with age. Poor self-rated health is very common especially among the oldest old population, and many older people are living with long-term illnesses. But still, the prevalence of self-reported difficulties in daily activities is relatively low. This means that people are able to live independent and active life even with health problems and diseases. However, living with chronic conditions and reporting poor self-rated health increase the likelihood of functional decline, so adequate health care and preventive interventions and support to maintain daily activities are needed. With effective preventive actions, active and independent life can be maintained even in the presence of age-related deterioration in health.
Reference
Bardage C., Pluijm, S., Pedersen, N., Deeg, D., Jylhä M., Noale, M., Blumstein T., Otero A. (2005) Self-rated health among older adults: A cross-national comparison. European Journal of Ageing, 2(2), 149-158. https://doi.org/10.1007/s10433-005-0032-7
Duan, Y., Lu, L., Chen, J., Wu, C., Liang, J., Zheng, Y., Wu, J., Rong, P., & Tang, C. (2018). Psychosocial interventions for Alzheimer’s disease cognitive symptoms: A Bayesian network meta-analysis. BMC Geriatrics, 18(1), 175. https://doi.org/10.1186/s12877-018-0864-6
Enroth, L., Raitanen, J., Halonen, P., Tiainen, K., & Jylhä, M. (2020). Trends of physical functioning, morbidity and disability-free life expectancy among the oldest old: Six repeated cross-sectional surveys between 2001 and 2018 in the vitality 90+ study. The Journals of Gerontology, Series A. Published online ahead of print. https://doi.org/10.1093/gerona/glaa144
Guralnik, J.M., Fried, L.P., & Salive, M.E. (1996). Disability as a public health outcome in the aging population. Annual Review of Public Health, 17, 25-46. https://doi.org/10.1146/annurev.pu.17.050196.000325
Jaul, E., & Barron, J. (2017). Age-related diseases and clinical and public health implications for the 85 years old and over population. Frontiers in Public Health, 5, 335. https://doi.org/10.3389/fpubh.2017.00335
Jylhä, M. (2009). What is self-rated health and why does it predict mortality? Towards a unified conceptual model. Social Science & Medicine, 69(3), 307-316. https://doi.org/10.1016/j.socscimed.2009.05.013
Jylhä M., Guralnik J., Balfour J., & Fried L. (2001). Walking difficulty, walking speed, and age as predictors of self-rated health: the women’s health and aging study. Journals of Gerontology, A Series, 56(10), M609-M617. https://doi.org/10.1093/gerona/56.10.M609
3.2 Health care across the life-course (Komp-Leukkunen)
Kathrin Komp-Leukkunen, University of Helsinki
The question of health care is discussed heatedly whenever a population ages. The reason is that old age was traditionally associated with declining health. Consequently, it was also associated with an increased need for health care. Some draw the conclusion that population ageing will also increase the need for health care. Countries with ageing populations had to face higher health care costs, and the middle-agers in these countries had to provide a higher amount of care to their frail parents and grandparents (Beard & Bloom, 2015). However, nowadays people stay healthy until an increasingly old age. Some researchers even suggest splitting old age into two consecutive phases nowadays: one phase of good health, and a second phase of deteriorating health (Komp, 2013). Those older people who are in good health can be and are active, and they contribute to society in many ways. Some even provide health care to their frail partners, parents, or grandparents. This activity makes older people a source of health care, and it lowers the amount of health care that public services need to provide (Komp, 2011). Thus, nowadays population has a twofold influence on health care: it increases the need for health care, but it also increases the resources for providing health care.
Health care for older Finns makes for a rather interesting case within Europe. Finland is part of the sociodemographic welfare regime, which is characterized by a well-developed public health care system (Eikemo et al., 2008). Therefore, one would expect a high number of health care services to be provided to older Finns. However, the Finnish population has a unique age structure. It is ageing rapidly, especially due to the baby boomers reaching old age. Yet, the baby boom was comparatively short in Finland, lasting roughly from 1945 to 1950 (Komp-Leukkunen, 2018; Van Bavel & Reher, 2013). Individuals in this birth cohort were aged between 67 and 72 years in 2017, when the SHARE data was collected. This means that most of them were still in the healthy, first phase of old age (GBD 2016 DALYs and HALE collaborators, 2017). Many of them were providing health care, whereas few of them were in need of intensive health care services (Karisto & Haapola, 2015; Komp-Leukkunen, 2018). Therefore, Finland does have a rapidly ageing population, but this demographic shift did not yet dramatically increase the need for health care.
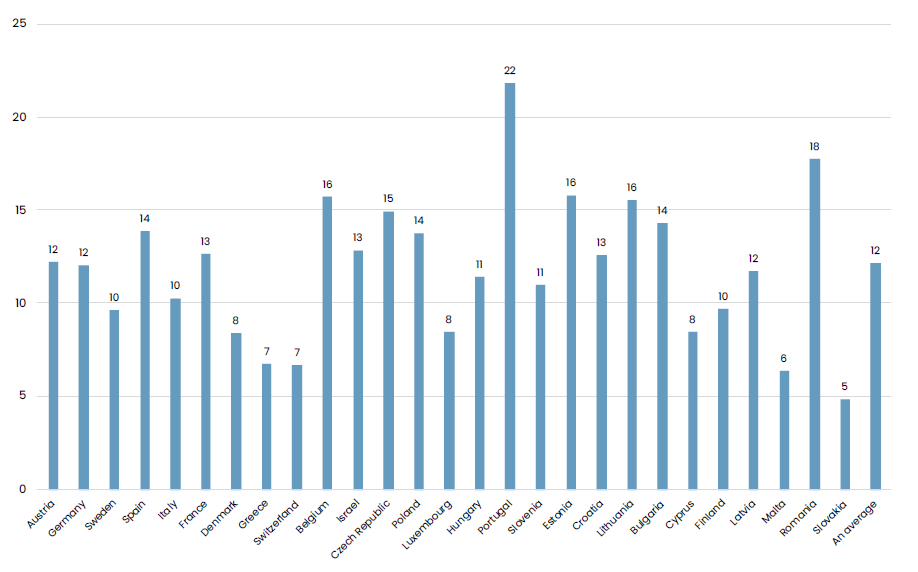
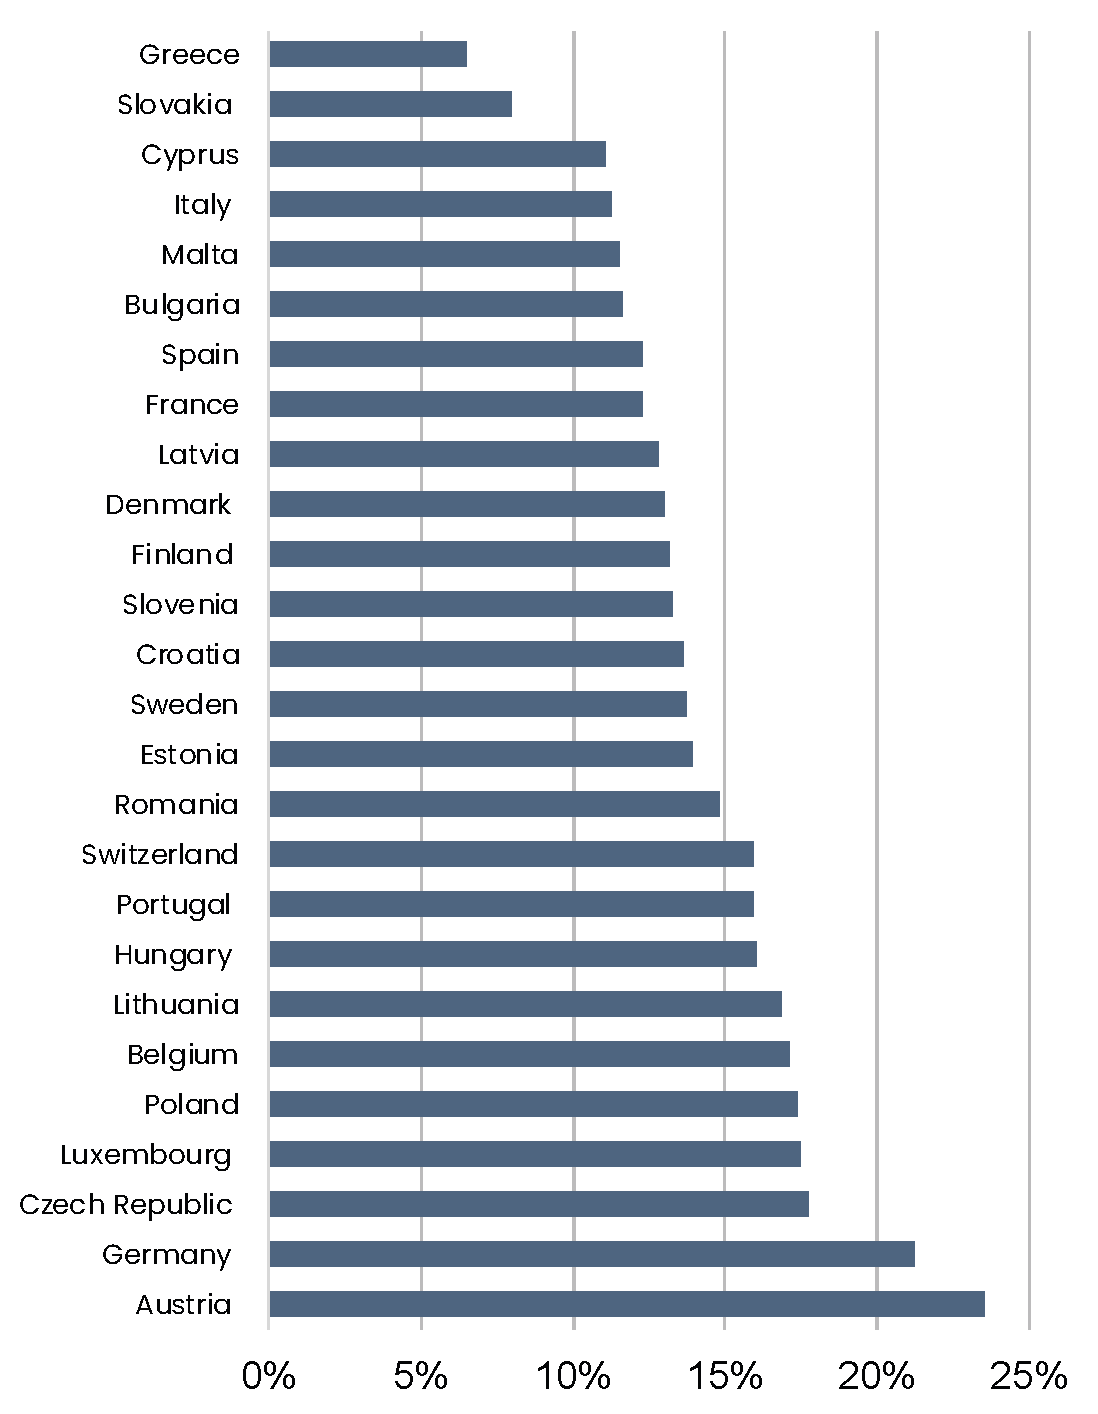
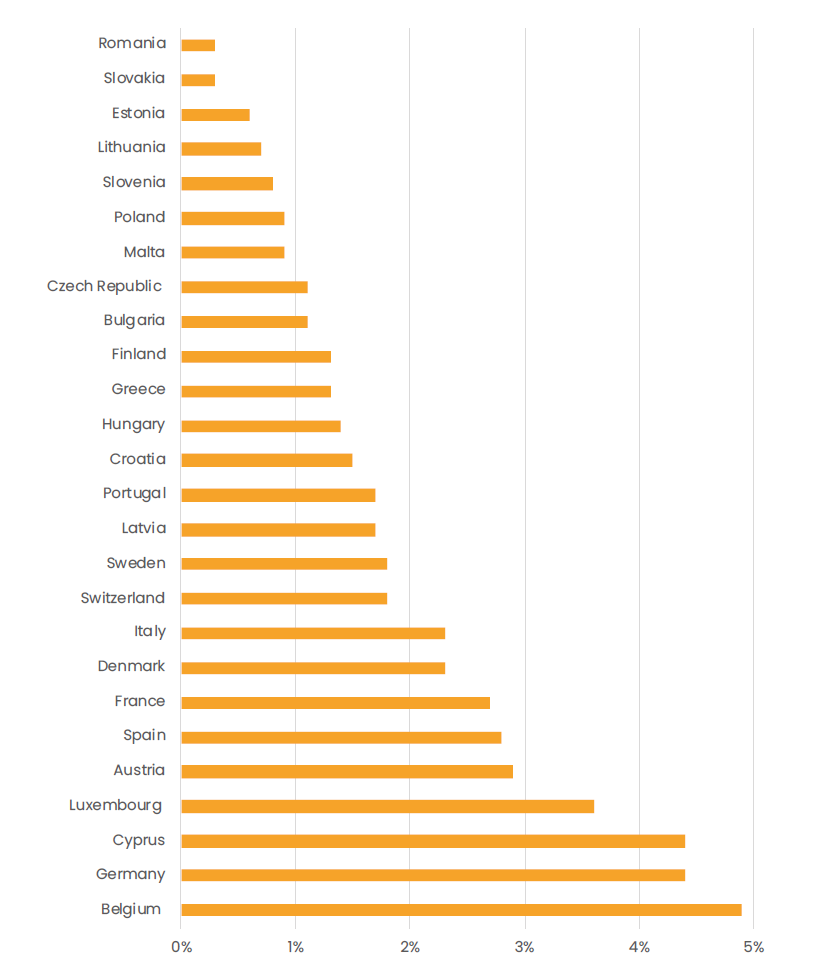
Figures 3.2.1 and 3.2.2 show how Finland ranks in European comparisons on health care. The first figure displays how many individuals aged 50 years or over spent a night in a hospital during the last twelve months. On average, the individuals in this age group across Europe had spent 15 nights in a hospital. Austria had the highest number with 24 nights, and Greece had the lowest number with seven night. Finland was in the middle of the ranking, with its older citizens having spent on average 13 nights in a hospital. The second figure shows how many individuals aged 50 years or over received professional personal care at home. Belgium had the highest share with five percent,nwhereas Romania had the lowest share with less than half a percent. Again, Finland came in around the middle of the ranking, with a bit more than one percent having receivednprofessional personal care. The fact that Finland ranks in the middle of Europe nin the use of health care services is due to the aforementioned high number of health service available within a population with comparatively low health care needs.
Note: The data was weighted with a population weight.
Note: The data was weighted with a population weight.
Institutional health care
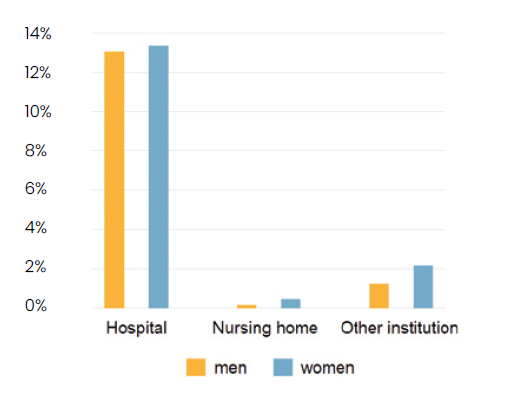
Institutional health care is an important part of health care in Finland. This health care comprises of various types of care. First, there is health care provided in hospitals, which targets individuals with acute and severe health problems, for example, heart attacks. Second, there is health care provided in nursing homes, which targets individuals with chronic health problems that require long-term care, such as dementia (Fassmer & Hoffmann, 2020). Third, there is care provided by other institutions, such as day care centers for older individuals. Figure 3 gives an overview of how many Finns aged 50 years and over used any of these types of institutional care within the last 12 months. The figure clearly reveals that hospital care is by far the most used type of health care. About 13 percent of the individuals in the sample used it, whereas less than one percent used nursing homes and about two percent used other health care services. The use of institutional health care among women was slightly higher than among men for all types of care. The clear preference for health care provided in hospitals is partly due to the comparatively young age profile of older Finns. It is also partly due to the design of the SHARE dataset, which only interviews individuals who do not live in institutions. Thus, all those older Finns who live in nursing homes are not included, whereas those who only spent a short period of time there are included. Therefore, the numbers in Figure 3.2.3 should be interpreted as a representation of how many individuals spent a short amount of time in a nursing home during the last 12 months and were released afterwards – not as a representation of the total amount of older individuals in nursing homes in Finland.
Note: The data was weighted with a population weight.
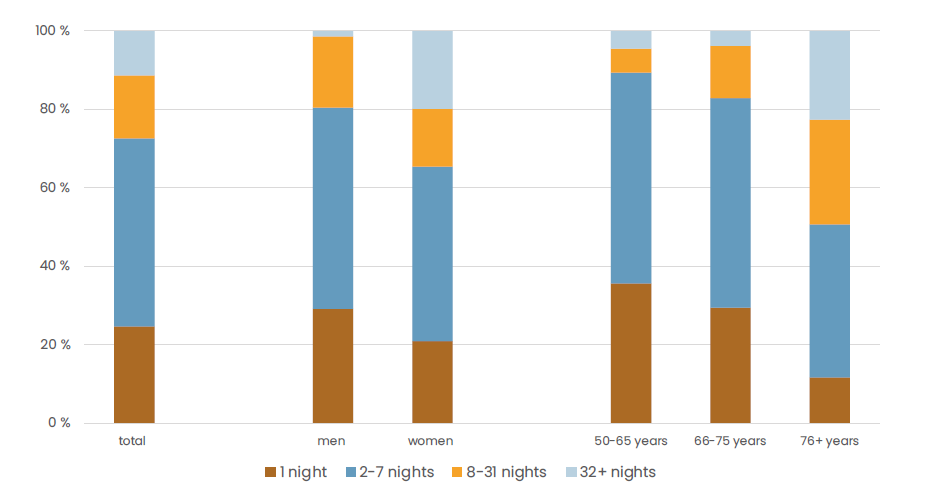
When it comes to hospital stays, the question of their length is of high interest. After all, a short stay indicates smaller health problems, whereas a longer stay indicates more serious health problems. Moreover, a short stay drives the national health care costs less than a longer stay (Baek et al., 2018). Figure 3.2.4 takes a closer look at how long older Finns stayed in a hospital in the last 12 months. About half the Finns aged 50 years and over that had stayed in a hospital stayed for 2 to 7 nights within the year. One out of four stayed for one night only. The other ones stayed for a total of more than a week. These numbers differ considerably across genders and ages. A comparison of men and women shows that women clearly spend more nights in a hospital than men. On average, men spent six nights in a hospital, whereas women spent 15 nights. This difference is mainly due to the difference between very short and very long stays.
The frequency of staying for an intermediate number of nights, between two and seven nights, is nearly identical for men and women. It amounts to half of the older Finns who stayed in a hospital overnight in 2017. However, the remaining men are in the other categories of short times spent in a hospital: one quarter spent only one night, and most of others spent between a week and a month. In contrast, the remaining women are mainly in the categories of very short stays (one night) and very long stays (more than a month). Intermediate stays of two to seven nights occurred less often. The gender difference in the number of nights spent in a hospital can be explained in two ways. First, women grow older than men (Statistics Finland, 2020). Health challenges typically increase with age. Therefore, health challenges are more prevalent among women than among men. Second, women are the main informal caregivers, also in Finland. This means that they are more likely to provide care to their frail spouses than men (Kuuppelomäki et al., 2004; Toljamo, Perälä, & Laukkala, 2012). Consequently, older women with health problems have a higher need for institutional health care than men with health problems.
Note: The data was weighted with a population weight.
The number of nights spent in a hospital also differs across age groups. Figure 4 illustrates these differences. It shows that with increasing age, the number of nights spent in a hospital increases. The youngest group was aged between 50 and 65 years in 2017. The individuals in this age group that spent time in a hospital did so for four nights on average. More than one third of these individuals stayed for one night only, and more than half of the individuals stayed between two and seven nights. The intermediate group was aged between 66 and 75 years. The individuals in this group stayed an average of eight nights in a hospital. Among them, the share of people staying for one night only is lower than in the youngest age group, and the share of people staying between one week and a month is higher. The oldest group was aged 76 years or over. The individuals in this group stayed an average of 17 nights in a hospital. In this age group, more than one third of the individuals stayed between two and seven nights, a quarter stayed between a week and a month, and almost a quarter stayed longer than a month. Thus, the individuals with very long stays are concentrated here. This finding is in line with the finding from previous studies that health challenges increase with age (GBD 2016 DALYs and HALE collaborators, 2017).
Health care services provided at home
Recent discussions in health care have stressed that it would be preferable if individuals with health challenges stayed at home as long as possible. This would improve the well-being of the individuals. It would also allow them to stay in their familiar environment and only make minor adjustments to their accustomed way of living (Turjamaa et al., 2014). Additionally, this approach can help to lower health care costs, which is a major concern for ageing populations (Beard & Bloom, 2015). For these reasons, health care services that are provided at home receive increasing attention.
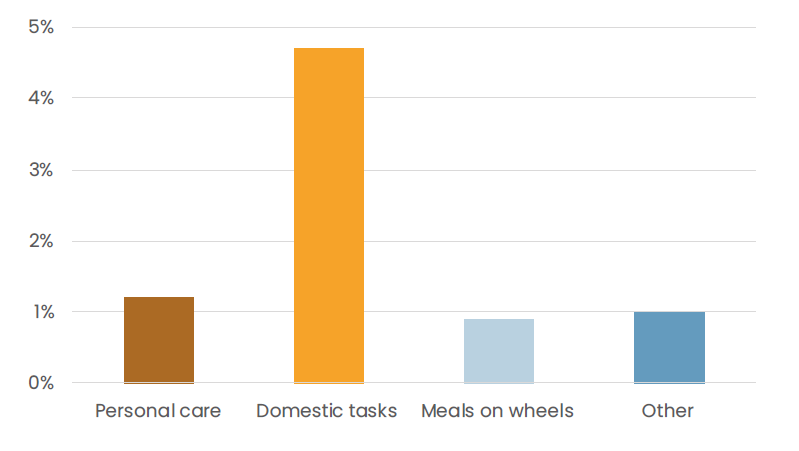
Figure 3.2.5 show how many Finns aged 50 years and over use care services at home. It shows the use of personal health care and related and supportive services: support for domestic tasks, meals on wheels, and other services. The figures show that personal health care is by far not the most common service used at home. Only a little more i than one percent of the individuals used this kind of service. The numbers of meals on wheels and other care services were only slightly lower. However, the use of supportnservices for domestic tasks succeeded the use of all other services. Almost five percent of all individuals in the sample used these services. This finding is in line with the insight that older Finns are still rather healthy. Their health needs can still be met with a comparatively low level of health care services provided at home. Instead of health care, their primary need is with support for domestic tasks. This preference shows that many of the health issues that older Finns face are in the area of instrumental activities of daily living. These activities describe practical tasks that older individuals carry out in their daily lives, such as performing housework, going shopping, managing money, and preparing one’s own meals. Limitations in these activities are considered an indication of disability (Carmona-Torres et al., 2019; Katz, 1983).
Note: The data was weighted with a population weight.
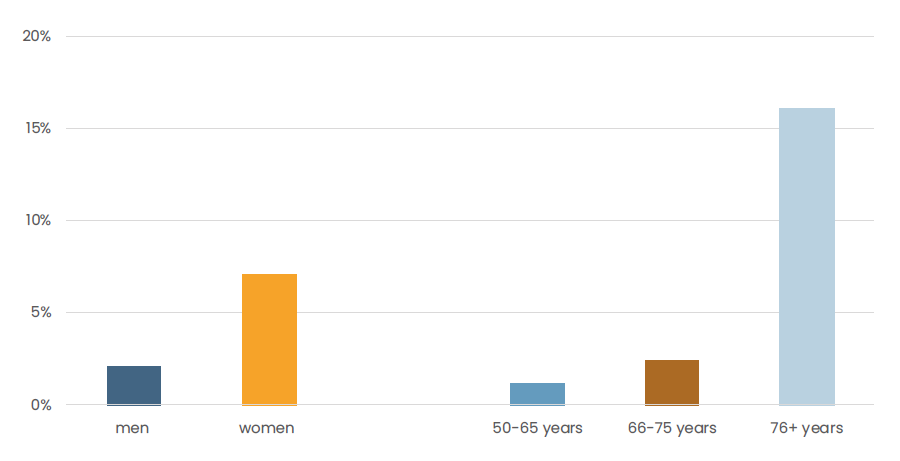
The use of support with domestic tasks differs across gender and age groups. Figure 3.2.6 shows how many Finns aged 50 years and over use services that support them with these tasks. It highlights that women are by far the biggest users of support services. They are more than three times as likely to use these services than men. The share among men is about two percent, whereas it is about seven percent among women. This gender difference aligns with the gender-difference found for the use of hospital care: women were the main users in both cases. The explanations for the gender difference in hospital care can also be applied to the use of support with domestic tasks: women are, on average, older – and thus frailer. In addition, they receive less practical support from their partners than men (Toljamo, Perälä, & Laukkala, 2012; Statistics Finland, 2020). Likewise, the comparison across birth cohorts shows distinct differences. In general, the older individuals are, the more they use support services for domestic tasks. Individuals in the youngest age group, who were between 50 and 65 years old, received only little support. Only slightly more than one percent of them utilized services for domestic tasks. Individuals aged 66 to 75 years already received twice as much support. Yet, the vast majority of the support services for domestic tasks that were provided in private households went to the oldest age group. The individuals in this group were aged 76 years and over. More than 16 percent of these individuals used services helping them with domestic tasks. This age gradient is in line with the observation that health challenges increase with age (GBD 2016 DALYs and HALE collaborators, 2017).
Note: The data was weighted with a population weight.
Conclusion
Health care services are becoming increasingly important due to the ageing of the Finnish population. In 2017, their use was still moderate due to baby boomers only yet having reached old age. However, as the baby boom generation ages, their use of health care services will also increase. An important insight is that the use of health care services is not equally distributed among older Finns. Women and older individuals are the main users. These social differences result from physical changes with age, and from the division of tasks within households. Thus, the future development of health care services is not pre-defined by physical needs alone. Instead, it also reflects behaviors, habits, and gender-specific social roles. Therefore, social developments need to be considered together with demographic changes when considering the future of health care services. How we behave and support one another will make a considerable impact on what health care services we will consume.
References
Baek, H., Cho, M., Kim, S., Hwang, H., Song, M., & Yoo, S. (2018). Analysis of length of hospital stay using electronic health records: A statistical and data mining approach. Plos ONE, 13(4), e0195901. https://doi.org/10.1371/journal.pone.0195901
Beard, J.R., & Bloom, D.E. (2015). Towards a comprehensive public health response tonpopulation ageing. The Lancet, 385(9968), 658-661. https://doi.org/10.1016/S0140-6736(14)61461-6
Carmona-Torres, J.M., Rodriguez-Borrego, M.A., Laredo-Aguilera, J., Lopez-Soto, P.J., Santadruz-Salas, E., & Cobo-Cuenca, A.I. (2019). Disability for basic and instrumental activities of daily living in older individuals. PLOS ONE, 14(7), e0220157. https://doi.org/10.1371/journal.pone.0220157
Fassmer, A.M., & Hoffmann, F. (2020). Acute health care services use among nursing home residents in Germany: A comparative analysis of out-of-hours medical care, emergency department visits and acute hospital admissions. Aging Clinical and Experimental Research, 32, 1359-1368. https://doi.org/10.1007/s40520-019-01306-3
GBD 2016 DALYs and HALE collaborators (2017). Global, regional and national disability- adjusted life-years (DALYs) for 333 diseases and injuries and healthy life expectancy (HALE) for 195 countries and territories, 1990-2016: A systemic analysis for the Global Burden of Disease Study 2016. The Lancet, 390(10100), 1260-1344. https://doi.org/10.1016/S0140-6736(17)32130-X
Eikemo, T.A., Bambra, C., Joyce, K., & Dahl, E. (2008). Welfare state regimes and income- related health inequalities: A comparison of 23 European countries. European Journal of Public Health, 18(6), 593-599. https://doi.org/10.1093/eurpub/ckn092
Karisto, A., & Haapola, I. (2015). Generations in ageing Finland: Finding your place in the demographic structure. In: K. Komp & S. Johansson (Eds.), Population ageing from a lifecourse perspective: Critical and international approaches (pp.45-64). Bristol: Policy Press. https://doi.org/10.1332/policypress/9781447310716.003.0004
Katz, S. (1983). Assessing self-maintenance: Activities of daily living, mobility, and instrumental activities of daily living. Journal of the American Geriatrics Society, 31(12), 721-727. https://doi.org/10.1111/j.1532-5415.1983.tb03391.x
Komp, K. (2011). The political economy of the third age. In: D. Carr & K. Komp (Eds.), Gerontology in the era of the third age (pp. 51-66). New York: Springer.
Komp, K. (2013). Reimagining old age in Europe: The effects of changing work and retirement patterns. In: S. Daniel, & Z. Zimmer (Eds.), Global ageing in the 21st century (pp. 175-193). Aldershot: Ashgate. https://doi.org/10.1007/978-94-007-6134-6
Komp-Leukkunen, K. (2018). Working-age life-courses in Finland: A comparison of the cohorts born 1945-51 and 1961-67. Research on Finnish Society, 11, 8-23.
Kuuppelomäki, M., Sasaki, A., Yamada, K., Asakawa, N., & Shimanouchi, S. (2004). Family carers for older relatives: Sources of satisfaction and related factors in Finland. International Journal of Nursing Studies, 41(5), 497-505. https://doi.org/10.1016/j.ijnurstu.2003.11.004
Statistics Finland (2020). Age structure of population on 31 December. Retrieved from https://www.stat.fi/tup/suoluk/suoluk_vaesto_en.html on December 13, 2020.
Toljamo, M., Perälä, M.-L., & Laukkala, H. (2012). Impact of caregiving on Finnish family caregivers. Scandinavian Journal of Caring Sciences, 26(2), 211-218.
https://doi.org/10.1111/j.1471-6712.2011.00919.x
Turjamaa, R., Hartikainen, S., Kangasniemi, M., & Pietilä, A.-M. (2014). Living longer at home: A qualitative study of older clients’ and practical nurses’ perceptions of home care. Journal of Clinical Nursing, 23(21-22), 3206-3217. https://doi.org/10.1111/jocn.12569
Van Bavel, J., & Reher, D.S. (2013). The baby boom and its causes: What we know and what we need to know. Population and Development Review, 39(2), 257-288.
https://doi.org/10.1111/j.1728-4457.2013.00591.x
3.3 Work across the life-course and retirement (Komp-Leukkunen)
Kathrin Komp-Leukkunen, University of Helsinki
Work and retirement are of central importance in today’s societies. We currently live in work-centered societies, which means that work is shaping our lives. It allows us to make a living, it structures our life-courses, and it provides us with an identity (Kohli, 2007; Komp-Leukkunen, 2019). Retirement is the end of work. Consequently, also retirement plays a role in shaping our life-courses. It changes our income source, gives us a high amount of unstructured time, and removes an important part of our previous identity (Wanka, 2020). Therefore, it comes as no surprise that work and retirement are common topics in everyday discussions. Researchers are likewise interested in these topics due to population ageing. This demographic change lowers the number of individuals in the workforce while increasing the number of pensioners. Researchers fear the workforce may become too small for the number of job openings that have to be filled. Moreover, the number of pensioners may become so high that the financial basis of pension schemes erodes. Policymakers try to extend working careers and delay retirement to prevent these problems (Komp, 2018). Finland is a remarkable case in this context.
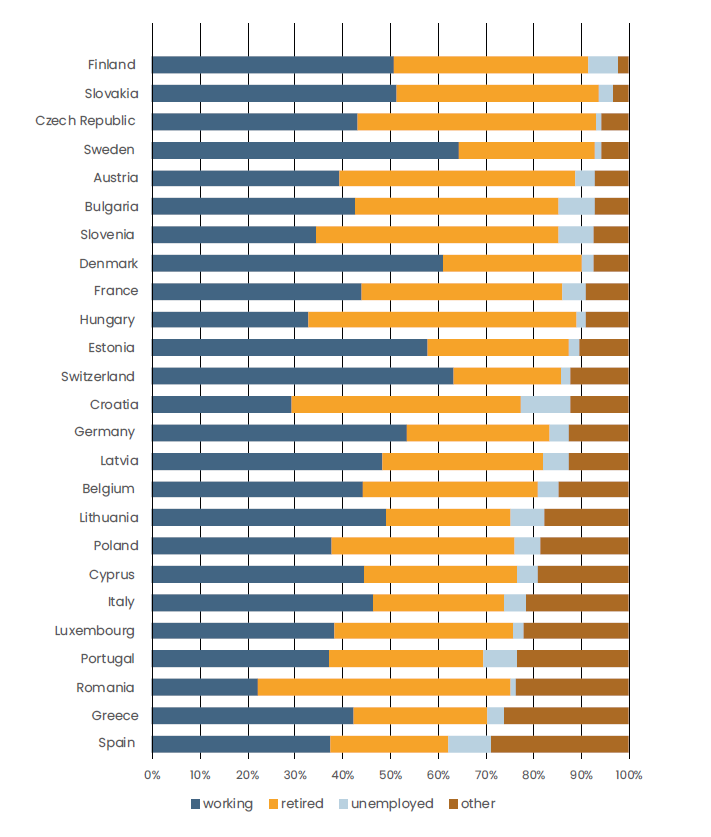
What makes the Finnish situation unique is its high number of later lives that are structured around work and retirement. In 2017, Finland had an exceptionally high share of citizens aged 50-70 years who were or had been part of the labor market. Figure 1 shows this information in a European country-comparison using the SHARE dataset. It reveals that in 2017, Finland led the list of all SHARE countries when it comes to the share of individuals who were retired or part of the labor market, be it by working or by being unemployed. Only about two percent of the individuals aged 50-70 years structuredmtheir lives around other activities, such as being ill or homemaking. Other countries that also had a low share were Slovakia and the Czech Republic. In contrast, Greece and Spain had a high share of individuals who structured their later lives around other activities. In these countries, the share amounted to about 30 percent. Figure 3.3.1 also provides more detailed information on what individuals were doing. It shows that in 2017, about every other person aged 50-70 years was working in Finland. About forty percent of the individuals were retired, and only six percent were unemployed. The share of working individuals is in the highest quarter of the countries analyzed, and the share of retired individuals is in the highest one-third. To better understand these numbers, we need to have a closer look at the situation within Finland.
Note: The data was weighted with a population weight.
How work and retirement developed over time
The pattern of work and retirement in Finland went through a unique historical change within Europe. Finland was an agricultural society until a comparatively late point of time: It was the most agrarian Western European country until the 1960 (Antikainen & Kauppila, 2002). From there on, it transitioned into an industrial society and soon continued the transition further on into a postindustrial society (Karisto, 2007). These historical societal changes influenced how the life-courses in Finland progressed. The workforce participation rate increased as women streamed into the labor market. Moreover, individuals postponed having children, which led to an increasing number of childless workers (Komp-Leukkunen, 2018). These developments went hand-in-hand with further changes in work and retirement.
Table 3.3.1 captures some of these historical developments in numbers. It compares key characteristics of the working life across cohorts. Cohorts are groups of people that were born around the same time. In this table, three cohorts are compared: those born in 1952-67, who were aged 50-65 years in 2017; those born in 1942-51, who were aged 66-75 years in 2017; and those born in 1923-41, who were older than 75 years in 2017. The table shows that the share of individuals working in agriculture clearly dropped across the cohorts. About every fourth person born in 1923-41 worked in agriculture at some point between age 15 and 50. In the two younger cohorts, only one out of ten did so. Likewise, 14 percent of the oldest cohort worked in agriculture between the age of 51 and 65, whereas only 6 percent did so in the second-oldest cohort. The concentration of agricultural work in younger age groups (15-50 years) results from the fact that this work is physically demanding, and it can therefore be carried out more easily at younger ages. Likewise, the table shows that the use of computers increased across the cohorts. While only every third person of the oldest cohort used a computer at work, about nine out of every ten persons in the youngest generation did so. Therewith, we can clearly see that the character of the work has been changing historically. However, the beginning and end of working life changed less. The age at which individuals first worked hardly changed across the cohorts, and the age when people last worked increased only slightly. The slight increase is interesting, because Finnish policymakers carried out various pension reforms, hoping to extend working careers (Kangas et al., 2010; Tikanmäki et al., 2015). Table 3.3.1 documents that these reforms have led to small and slow changes in the length of working careers.
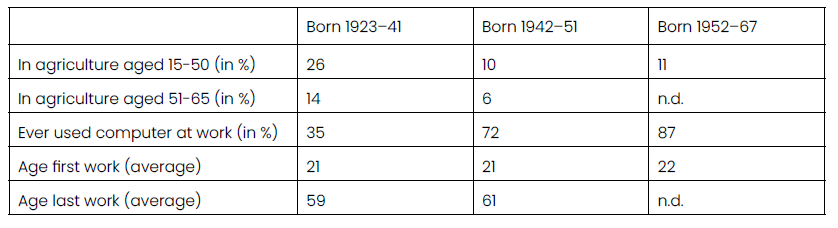
Note: “n.d.” means note defined. It is assigned to cells for which the values cannot be calculated, because the individuals in the respective cohort did not meet the age range studied. The data was weighted with a population weight.
Some of the historical changes affected men and women differently. Today, women are more likely to work in the public sector and to work part-time. However, men are more likely to be self-employed (Haussen & Schlegel, 2019; Lorentzen et al., 2019; Riekhoff & Järnefelt, 2017). Table 3.3.2 shows how this situation has developed over historical time. It documents that over historical time, the kinds of employment shifted. Fewer individuals work in the private sector between the ages 15 and 50, while more individuals in this age range work in the public sector. The number in self-employment changed very little. Between the ages of 51 and 65, Finland saw a small increase in the number of people working in the public sector, no change in the private sector, and a small decline in self-employment. Moreover, the share of individuals working part-time increased in both age groups. If we look at these numbers for men and women separately, we can clearly see some gender-specific developments. Women are more likely than men to work in the public sector and to work part-time. In contrast, men are more likely to work in the private sector and choose self-employment. Over historical time, the share of women working in the public sector, the private sector and part-time jobs increased. However, their share in self-employment decreased. This pattern is visible across both age groups. In contrast, men aged 15 to 50 years streamed into self-employment and part-time work, whereas men aged 51 to 65 years participated less in the private sector and more in the public sector. Only the number of individuals who never worked remained remarkably low across cohorts and genders, ranging at around one percent in all groups (not shown in the Table).
These findings show that Finnish men and women took different paths through the process of social change. Women increasingly find a niche in the public sector labor market, where they find employment protection to a degree that the private sector does not provide. Moreover, the public sector also makes it easier for them to work part-time (Riekhoff & Järnefelt, 2017). In contrast, men choose self-employment more often, while maintaining their engagement in the private sector. Only after the age of 50 years do their stream into the public sector, which offers higher employment protection (Niemi & Komp, 2018).
Perspectives on work and retirement
Life-courses exist in facts and perceptions. While facts give them an objective and measureable structure, perceptions help us interpret the structures. They indicate what individuals consider important and influential, and what they find pleasant and what they do not. Thus, knowledge on subjective perceptions is just as important as knowledge on objective facts (Barrett & Montepare, 2015). To better understand the facts presented, we will now look at how older individuals think about work and retirement.
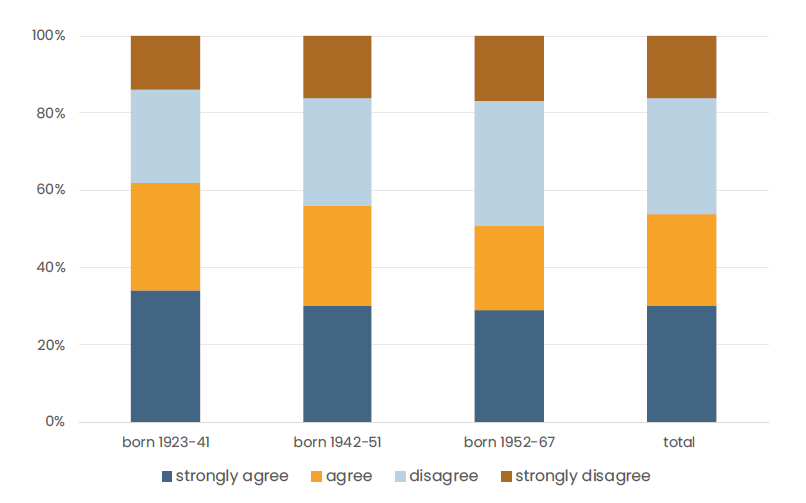
Older Finns have diverse opinions on whether or not their work was physically demanding. Figure 3.3.2 shows the opinions of Finns aged 50+ years on this topic. It shows that in total, about one third of the older individuals disagreed with this statement, one third strongly agreed, and the other third split up into those who strongly disagreed and those who agreed. This assessment does not differ between men and women. Therefore, the figure does not display any gender differences. However, the assessment differs across cohorts. Therefore, the figure shows the assessment for all people together and additionally for each cohort separately.
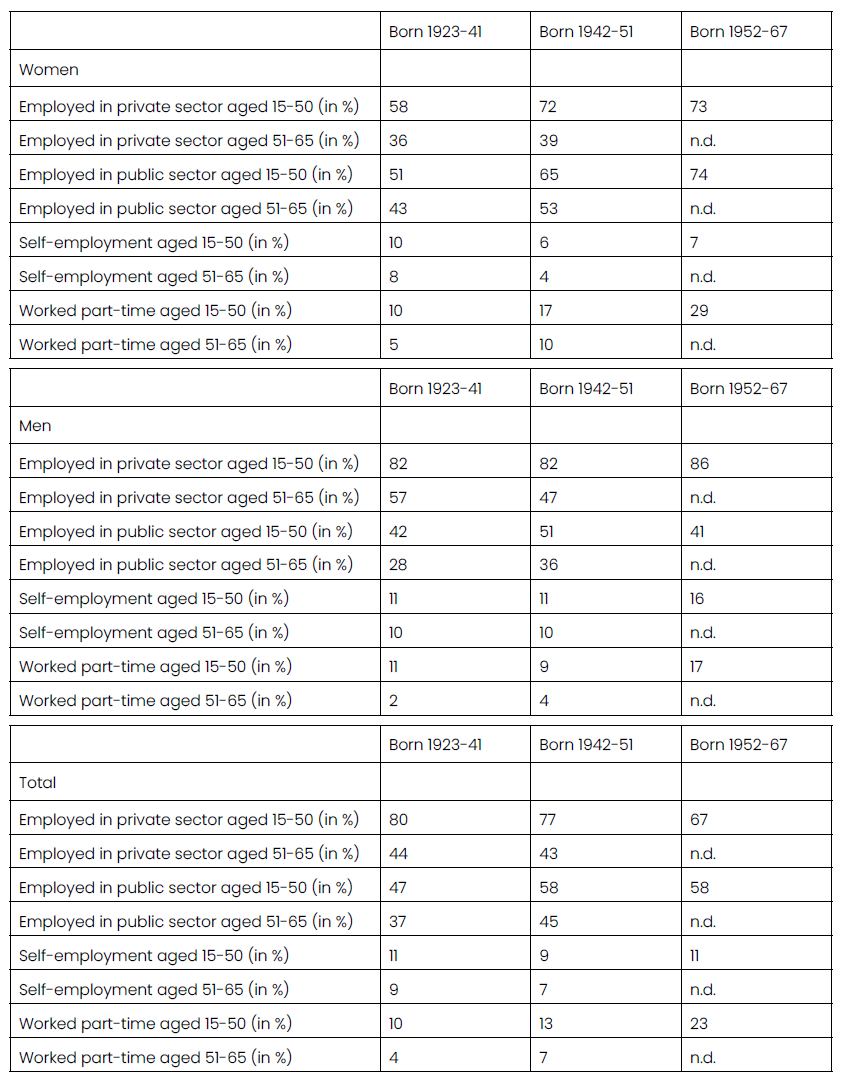
Note: “n.d.” means note defined. It is assigned to cells for which the values cannot be calculated, because the individuals in the respective cohort did not meet the age range studied.
The data was weighted with a population weight. People could carry out multiple types of employment in the same age range.
Note: The data was weighted with a population weight.
The cohort-comparison shows that over time, fewer and fewer people perceive their work as physically demanding. In the oldest cohort, almost two out of every three individuals perceived their work as physically demanding. However, in both younger cohorts, more than half of the individuals disagree with this statement. The changing perception about how physically demanding work is goes hand in hand with the changing character of work. We previously saw that over historical time, fewer and fewer people were working in agriculture, whereas an increasing share of people were working in the public sector. These developments mean that work shifted towards office tasks, which are typically less demanding than the rather physical tasks that have to be carried out in agriculture. Moreover, we saw that an increasing number of jobs involved the use of computers, which is also an indicator for a shift towards less physically demanding office tasks. The findings in Figure 3.3.2 demonstrate that individuals see the results of this historical change in their everyday work. Their experience of work changes, which means that also the differentiation between work and retirement changes. This differentiation become less of a contrast between a physically demanding time and a time of physical recovery. Instead, other aspects become more important for
defining the difference, for example the amount of structured time a person has and their sources of identity.
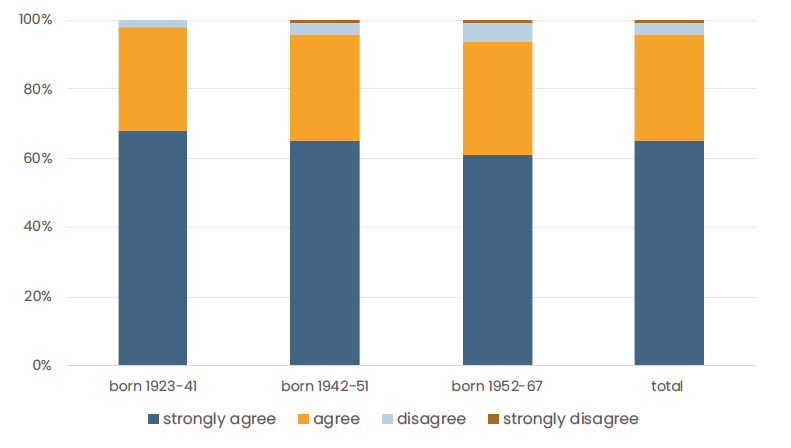
Interestingly, the easier physical demands did not translate into a higher job satisfaction. Previous research showed that individuals with a physically demanding job have a lower job satisfaction (Sousa-Poza & Sousa-Poza, 2000). Therefore, one would expect that as physical demands decreased over historical time, people’s job satisfactionincreased. However, this is not what happened. Figure 3.3.3 shows the job satisfaction by cohort. This figure highlights two important facts. First, the overall job satisfaction among older individuals in Finland is rather high. More than nine out of every ten older Finns report that they are respectively satisfied with their job. Second, the satisfaction declined slightly across cohorts. The decline is only minimal, amounting to three percentage points. Yet, the remarkable aspect is that it is a decline, not an increase. This circumstance suggests that while the physical demands of work decreased, other aspects of work also changed. These additional changes lower work satisfaction, and their influences are so strong that they even out the positive influence of the decreasing physical demands. These additional changes could, for example, be the increasing use of information technologies or an increasing workload. Future research still needs to provide a definitive answer as to what these developments are that lower job satisfaction over historical time.
Note: The data was weighted with a population weight.
The changes in the character of work can influence whether or not older individuals want to work. Figure 3.3.4 provides an overview of whether or not they would like to change the amount of time they spend on paid work. On average, only one out of every five individuals would like to make a change. However, these numbers differ strongly across the cohorts. An important reason for these cohort differences is the phrasing of the question. In contrast to the other questions discussed before, this question does not ask about the preferences concerning one’s last job. Instead, it asks about the preferences concerning one’s current situation – and the current situation differs across the cohorts. The members of the two older cohort were been 66 and 94 years old when the SHARE data was collected in 2017. This means that most of them had already stopped working. In contrast, the members of the youngest cohort were between 50 and 65 years old when the data was collected. Most of them were still working. Thus, the question meant something different for each of the cohorts: for the older cohorts it meant whether they would like to return to work; for the youngest cohort it meant how they would like to adapt their current working time.
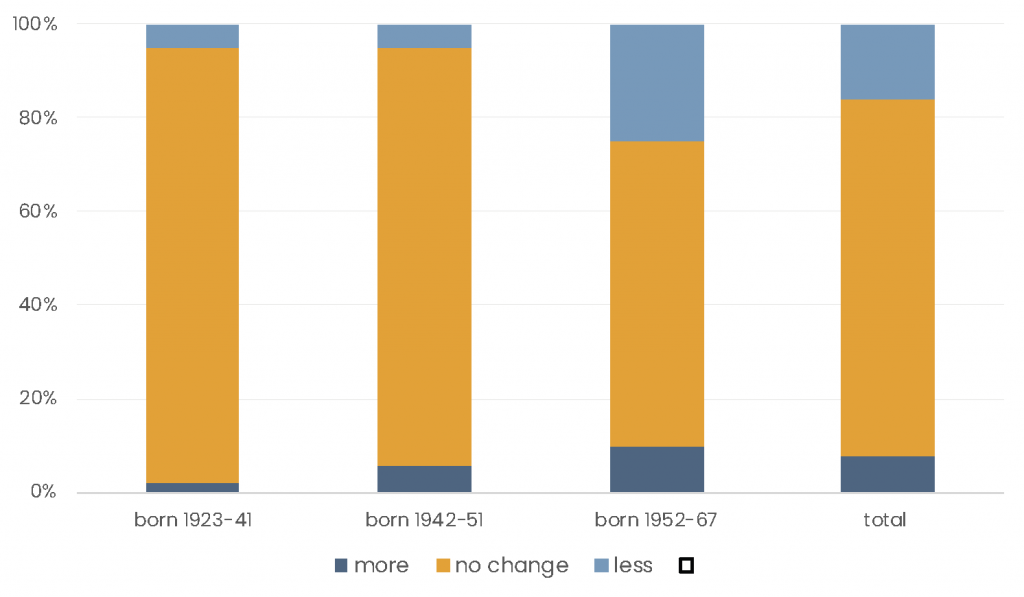
Note: The data was weighted with a population weight.
The cohorts had different preferences when it comes to changing the time they currently spend on paid work. The members of the older cohorts largely wanted to maintain their status quo. About nine out of ten individuals stated that they wanted to leave their working time as it was. The few individuals who wanted to make a change had different preferences. Some wanted to work more, while others wanted to work less. The situation of the youngest cohort is remarkably different. Only two third of individuals in this cohort were satisfied with their current working time. One quarter of the individuals wanted to work less, and the remaining ten percent wanted to work more. These preferences are particularly interesting in times of efforts to extend working careers. Longer careers are only feasible if there is enough work for older individuals to carry out. Otherwise careers cannot be extended, no matter what the plans and intentions are. The fact that numerous working-age individuals would be interested in spending less time working can provide a solution to this conundrum: if middle-aged individuals worked less, then older individuals could work more. Such an arrangement could, for example, be implemented through an increase in part-time work.
Conclusion
Questions of work and retirement become more pressing in times of population ageing. In particular, many older Finns are or have been participating in the labor market, which makes Finland a role model for other European countries. However, it achieved some of the high labor force participation through a self-selection of women into the public sector and part-time employment. Thus, despite its positive features, also the Finnish labor market is segregated into groups with different inclusion levels. Over time, work in the agricultural sector and the physical demands at work decreased while the use of computers increased. Yet, job satisfaction also decreased slightly, and numerous older Finns wish they could reduce their working time. If employers and policymakers were to create more opportunities for part-time work, the labor market
segregation may increase. However, at the same time it may improve the possibilities to extend working careers – which is an important concern nowadays. Thus, there is a trade-off between labor market segregation and longer careers. Policymakers need to consider this trade-off when deciding how to deal with the challenges of population ageing in the labor markets and pension schemes.
References
Antikainen, A., & Kauppila, J. (2002). Educational generations and the future of adult education: A Nordic experience. International Journal of Lifelong Education, 21, 209-219.
https://doi.org/10.1080/02601370210127828
Barrett, A.E., & Montepare, J.M. (2015). ”It’s about time”: Applying life span and life course perspectives to the study of subjective age. Annual Review of Gerontology & Geriatrics, 35(1), 55-77. https://doi.org/10.1891/0198-8794.35.55
Haussen, T., & Schlegel, M. (2019). Unemployment reduction through solo self-employment: A gender question? Empirical Economics. Published online ahead of print. https://doi.org/10.1007/s00181-019-01754-w
Kangas, O., Lundberg, U., & Ploug, N. (2010). Three routes to pension reform: Politics and institutions in reforming pensions in Denmark, Finland and Sweden. Social Policy & Administration, 44(3), 26-284. https://doi.org/10.1111/j.1467-9515.2010.00713.x
Karisto, A. (2007). Finish baby boomers and the emergence of the third age. International Journal of Ageing and Later Life, 2, 91-108. https://doi.org/10.3384/ijal.1652-8670.072291
Kohli, M. (2007). The institutionalization of the life course: Looking back to look ahead. Research in Human Development, 4(3-4), 253-271. https://doi.org/10.1080/15427600701663122
Komp, K. (2018). Shifts in the realized retirement age: Europe in times of pension reform and economic crisis. Journal of European Social Policy, 28(2), 130-142. https://doi.org/10.1177/0958928717709174
Komp-Leukkunen, K. (2018). Working-age life-courses in Finland: A comparison of the cohorts born 1945-51 and 1961-67. Research on Finnish Society, 11, 8-23.
Komp-Leukkunen, K. (2019). Capturing the diversity of working age life-courses: A European perspective on cohorts born before 1945. Plos ONE, 14(2), e0212400. https://doi.org/10.1371/journal.pone.0212400
Lorentzen, T., Bäckman, O., Ilmakunnas, I., & Kauppinen, T. (2019). Pathways to adulthood: Sequences in the school-to-work transition in Finland, Norway and Sweden. Social Indicators Research, 141, 1285-1305.
https://doi.org/10.1007/s11205-018-1877-4
Niemi, T., & Komp, K. (2018). Retirement timing in a future welfare state: A Finnish Delphi study. International Journal of Sociology and Social Policy, 38(11-12), 1071-1085. https://doi.org/10.1108/IJSSP-04-2018-0067
Riekhoff, A.-J., & Järnefelt, N. (2017). Gender differences in retirement in a welfare state with high female labour market participation and competing exit pathways. European Sociological Review, 33(6), 791-807.
https://doi.org/10.1093/esr/jcx077
Sousa-Poza, A., & Sousa-Poza, A.A. (2000). Well-being at work: A cross-national analysis of the levels and determinants of job satisfaction. The Journal of Socio-Economics, 29(6), 517-538. https://doi.org/10.1016/S1053-5357(00)00085-8
Tikanmäki, H., Sihvonen, H., & Salonen, J. (2015). Distributional effects of the forthcoming pension reform – a dynamic microsimulation approach. International Journal of Microsimulation, 8(3), 75-98. https://doi.org/10.34196/ijm.00122
Wanka, A. (2020). Continuity and change in the transition to retirement: How time allocation, leisure practices and lifestyles evolve when work vanishes in later life. European Journal of Ageing, 17(1), 81-93. https://doi.org/10.1007/s10433-019-00526-w
3.4 The financial situation across the life-course (Kuitto, Riekhoff & Palomäki)
Kati Kuitto, Finnish Centre for Pensions
Aart-Jan Riekhoff, Finnish Centre for Pensions
Liisa-Maria Palomäki, Finnish Centre for Pensions
Introduction
The economic well-being of older people is gaining in importance as populations age rapidly in most European societies. The income and economic well-being of retirees in European welfare states are not only dependent on the generosity of the pension system, but also increasingly on circumstances during working life and even earlier during the life course. From previous studies we know, for example, that the financial situation in midlife is strongly reproduced after retirement (Riekhoff & Järnefelt, 2018) and that growing up in economic hardship has consequences for well-being in adult life (Bask et al., 2020). Assessing the economic well-being at older age therefore requires a life course perspective. Adding subjective perceptions of older peoples’ situation to the objective measures provides one important perspective on assessing the adequacy of pensions and other social security benefits (Pettinicchi & Börsch-Supan, 2019).
Studies on the economic well-being of older people and retirees have traditionally focused on objective measures such as income and consumption (for Finland, see, e.g., Hagfors et al., 2003; Kautto, 2011; Kuivalainen et al., 2017; Uusitalo, 2006). Recently, attention has been paid increasingly to measures of peoples’ own perception of their well-being (Stiglitz et al., 2009). In Finland, subjective financial well-being was first studied among a representative sample, which also included older people, from the perspective of making ends meet (Kautto et al., 2009; Palomäki, 2011), but since 2017, the perspective has broadened and now includes views on, for example, financial satisfaction, the use of money, and solutions to financial hardship (Ahonen et al., 2018). These have been associated with, amongst others, retirement routes, employment before and during retirement as well as regional differences (Ahonen et al., 2019).
Although there is a relatively large amount of literature on the financial situation and subjective economic well-being of Finnish retirees, several gaps in our knowledge can still be identified. First, there are relatively few studies that examine the subjective perceptions of retirees’ economic well-being in Finland from a comparative perspective. Comparisons of older Finns are mainly based on EU-SILC data and focus on poverty and income adequacy (Ahonen et al., 2017; Palomäki, 2018).
Second, whereas Finland has rich longitudinal data on individual and household finances from registers, longitudinal studies on changing subjective economic well-being are still rare due to the limited data available. Changes in the perceptions of economic well-being over time have been analyzed retrospectively, for example by asking recipients of the national pension about their experiences of financial hardship during youth and working age (Airio et al., 2013), or how retirees feel that their income situation has changed during retirement or compared to their working lives (Palomäki, 2019).
In this chapter, we first provide a comparative picture of how Finnish older people’s economic well-being across the life course looks like in European comparison. Here we concentrate on the perceived ability to make ends meet among the respondents over 50 years of age and the financial hardship they report having had during the life course. We then describe the economic well-being of Finns across the life course by focusing on childhood circumstances, financial hardship over the life course and current financial situation by several socioeconomic background variables. We use the data for all respondents of the SHARE wave 7 in Finland, thus taking advantage of the full potential of the data for assessing the economic situation across the life course.
The financial situation across the life course in Finland in international comparison
In order to assess how Finland fares in comparison with the other European countries with regard to people’s financial situation across the life course, we consider three indicators that are available in the SHARE data. First, for assessing the current financial situation, we look at the ability to make ends meet (Figure 3.4.1). Overall, more than half of Europeans said they can make ends meet fairly easily or easily, but there is great variation across the countries. The financial situation was best in the Nordic and the Continental European welfare states of Switzerland, Austria, Germany and Luxembourg. Older people in the post-communist Central and Eastern European and Mediterranean countries had the most problems in making ends meet. Finland is one of the third countries with the lowest share of reported difficulties, but the share of those answering “easily” (32 %) was lower than in the other well-performing countries. Then again, with 42 percent of Finns reporting they can make ends meet “fairly easily”, the share was the highest of all countries. A similar picture of perceived financial situation in cross-country comparison applies when asking whether the respondents feel that shortage of money stops them from doing things they would have otherwise done (cp. Palomäki, 2020).
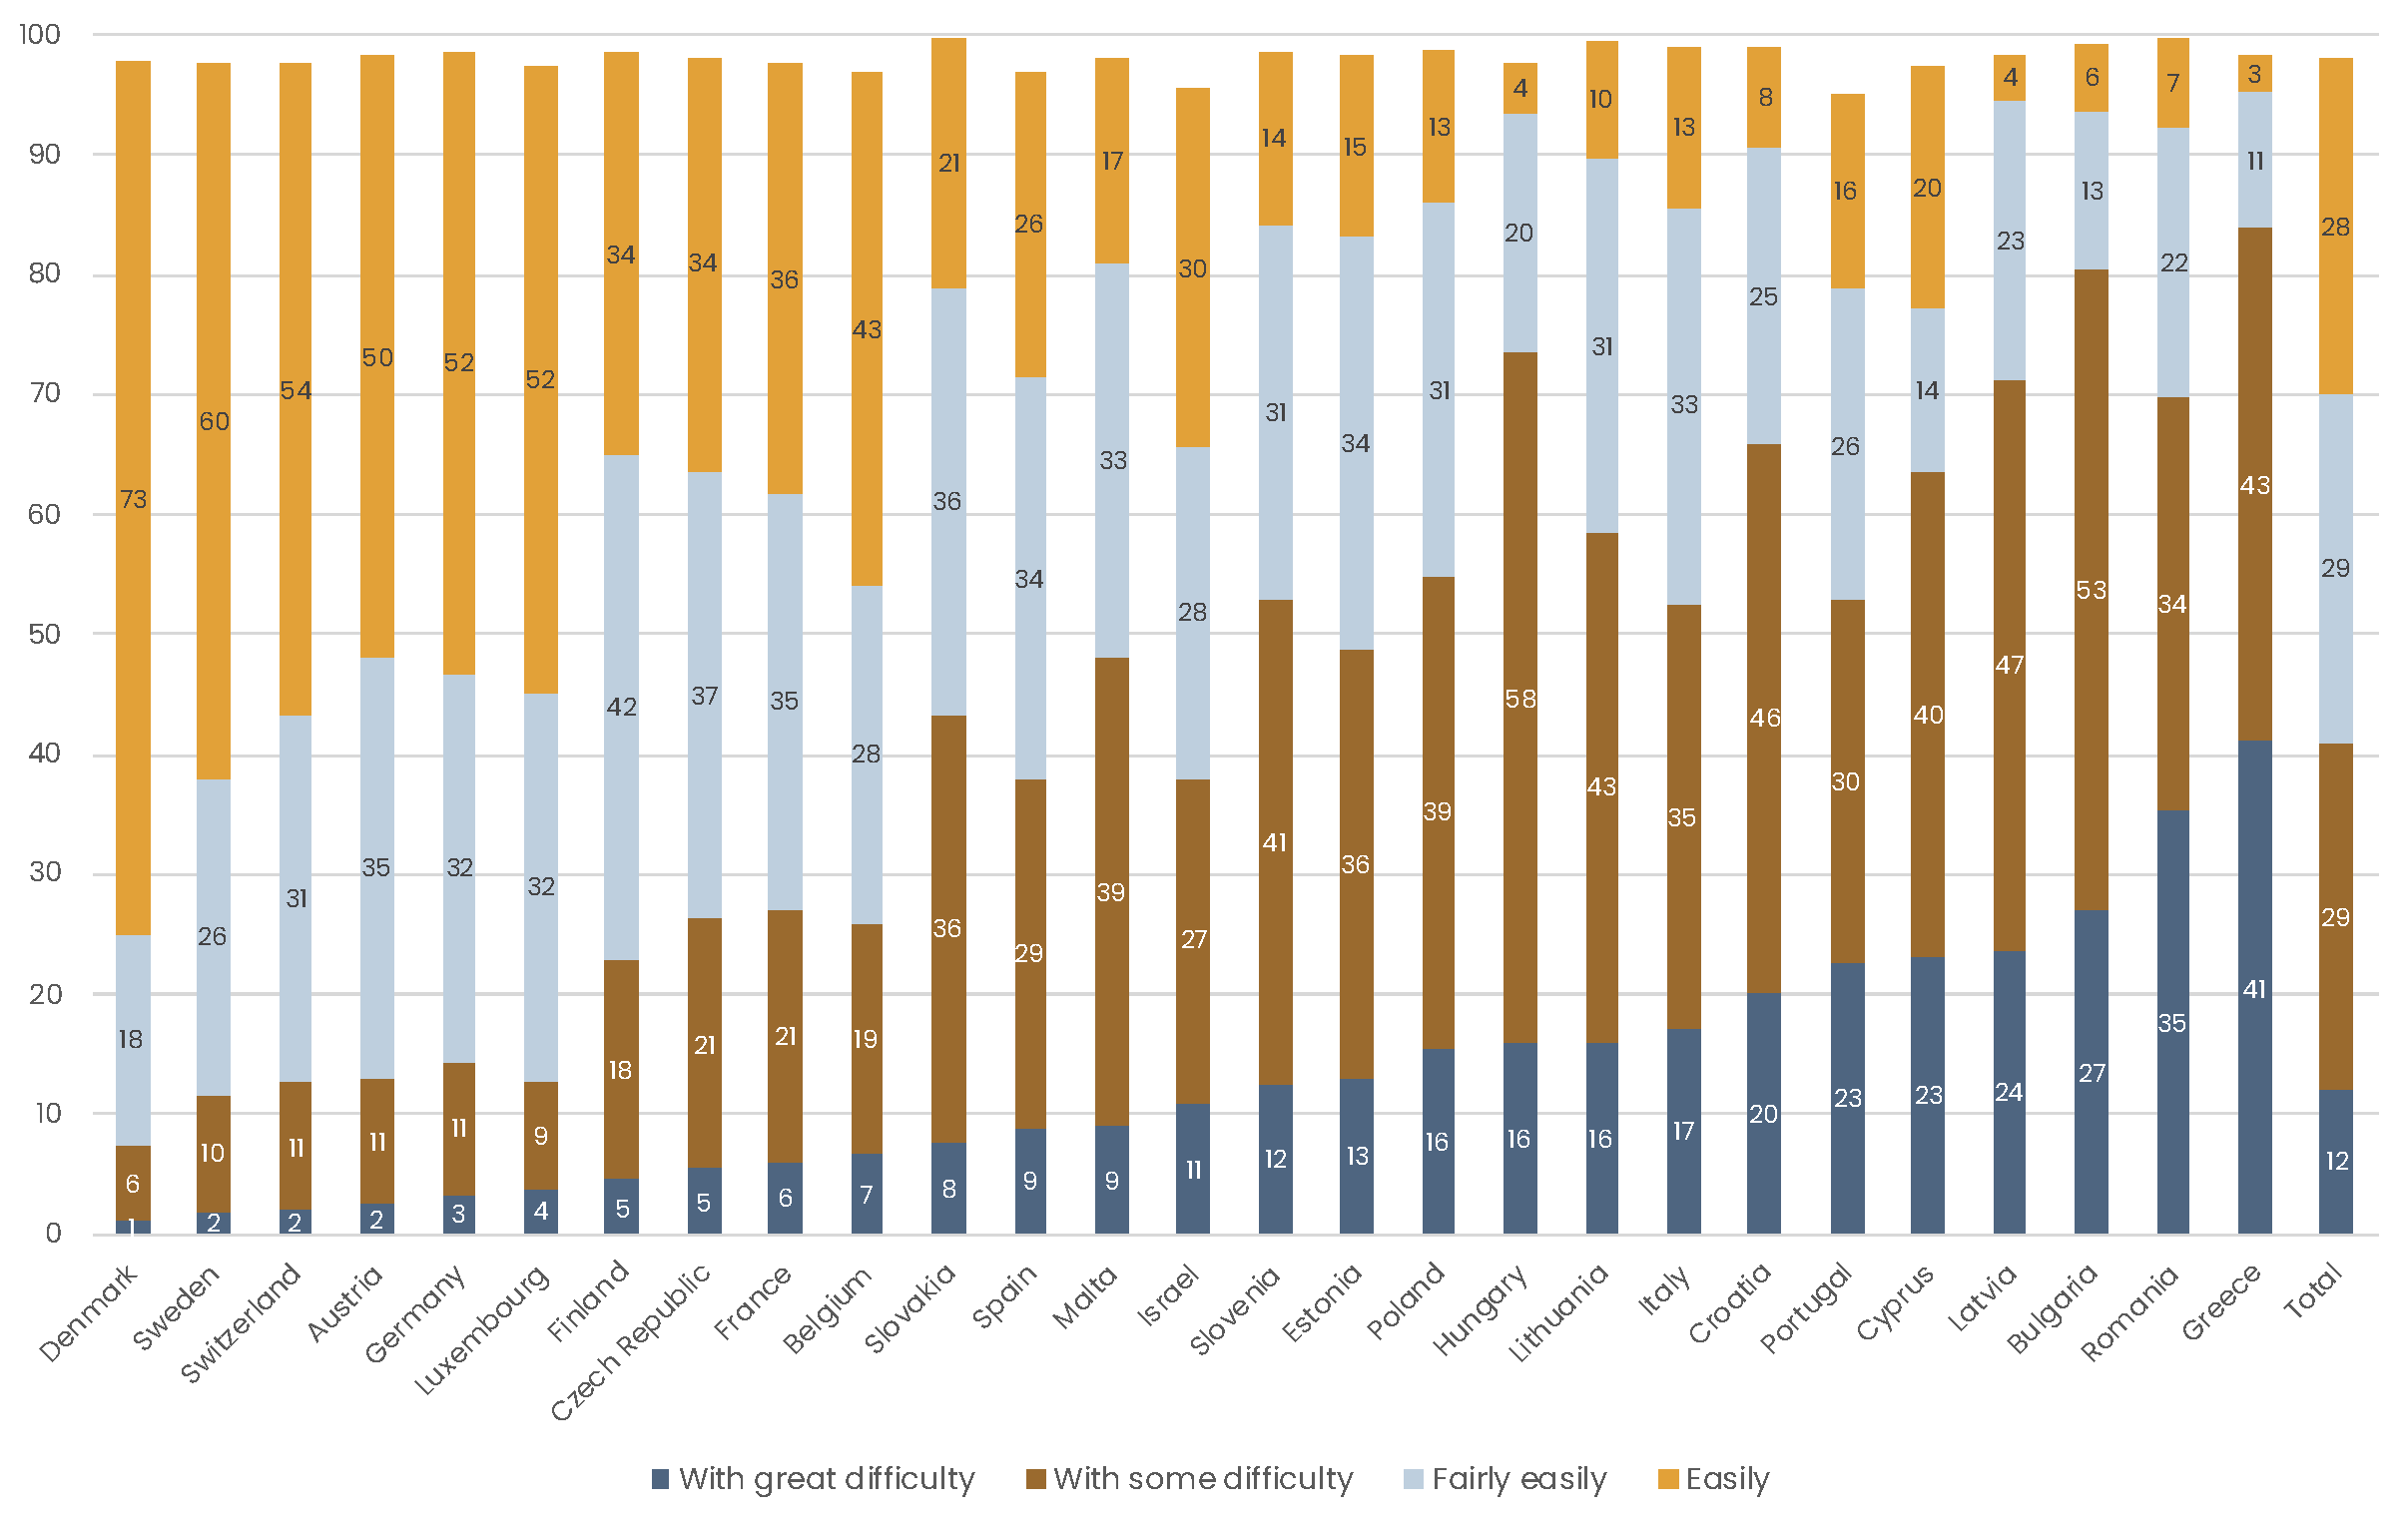
Note: Values not summing up to 100 due to missings.
When asked retrospectively about their financial well-being during the life course, over two-third of the European respondents reported that they have experienced a period of financial hardship at some point in their lives (Figure 3.4.2). While Southern and Central Eastern European countries showed more difficulties in making ends meet currently, countries with the least experienced hardship during the life course included Slovakia, Malta, Slovenia, Spain, Italy, and the Czech Republic. The other Nordic countries scored around the average in European comparison, but in Finland, a considerably greater share of respondents (40%) reported having had a period of financial hardship in their life than the European average (30%). However, of those who experienced hardship, the length of the period was comparably low in Finland (about 8 compared to 11 years on European average; Figure 3.4.3).
The differences in the prevalence and length of experienced financial hardships may in part be explained by the economic development in the European countries during the life course of the cohorts included in the SHARE survey. The older generations in Finland have lived their childhood, youth and early adulthood when Finland was rather poor after the Second World War and the welfare state was not yet developed. Compared to many other Northern and Western European countries, Finland only caught up later. On the other hand, extensive and rather generous welfare policies may have cushioned financial hardship better in the Nordic welfare states, shortening the period of hardship for many (Kautto & Kuitto, 2020).
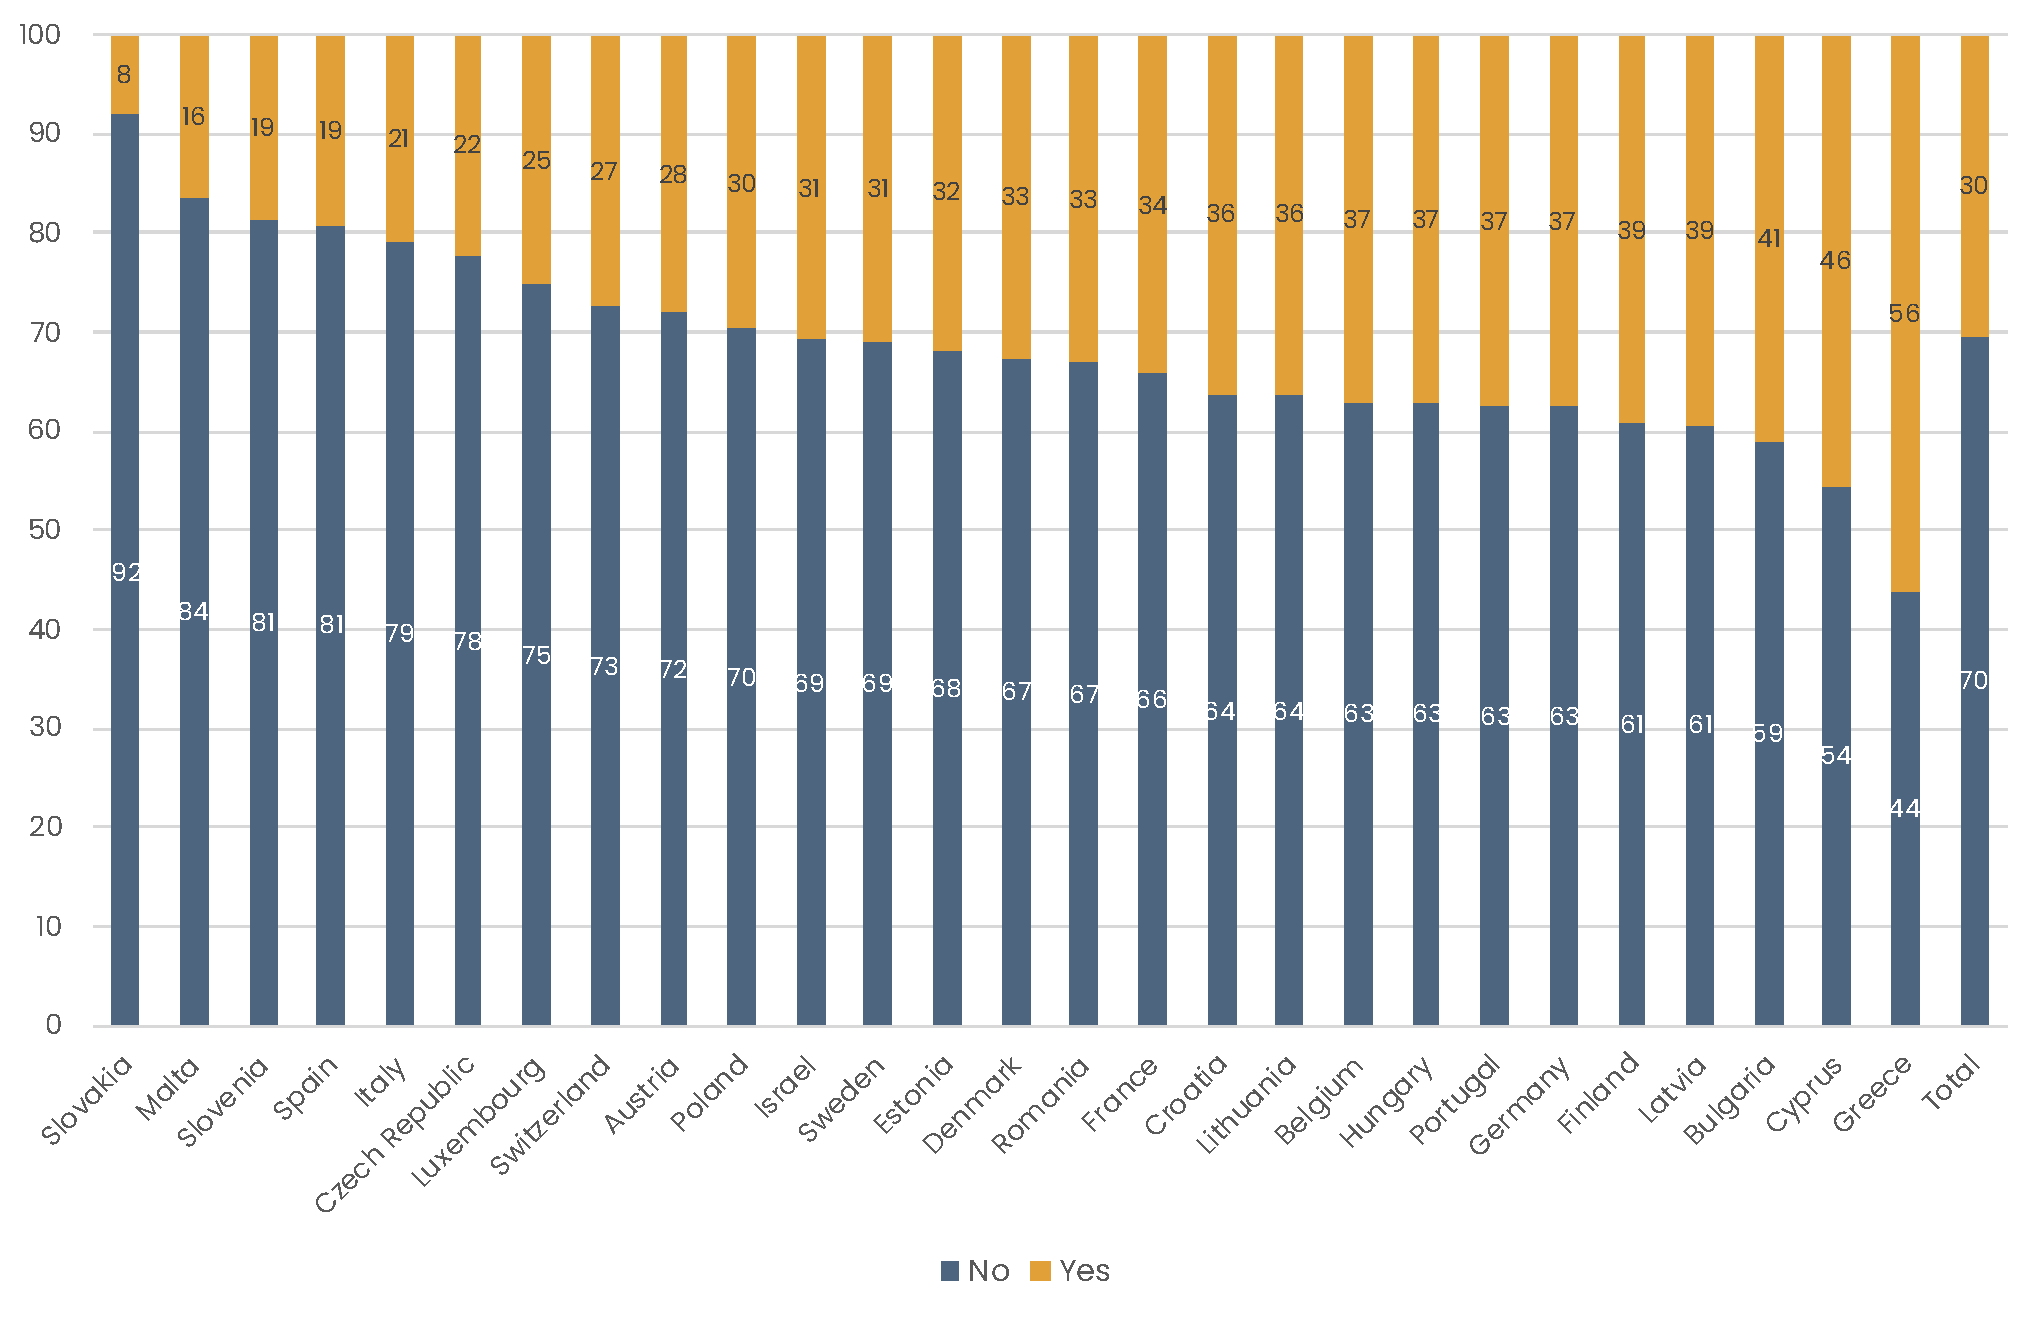
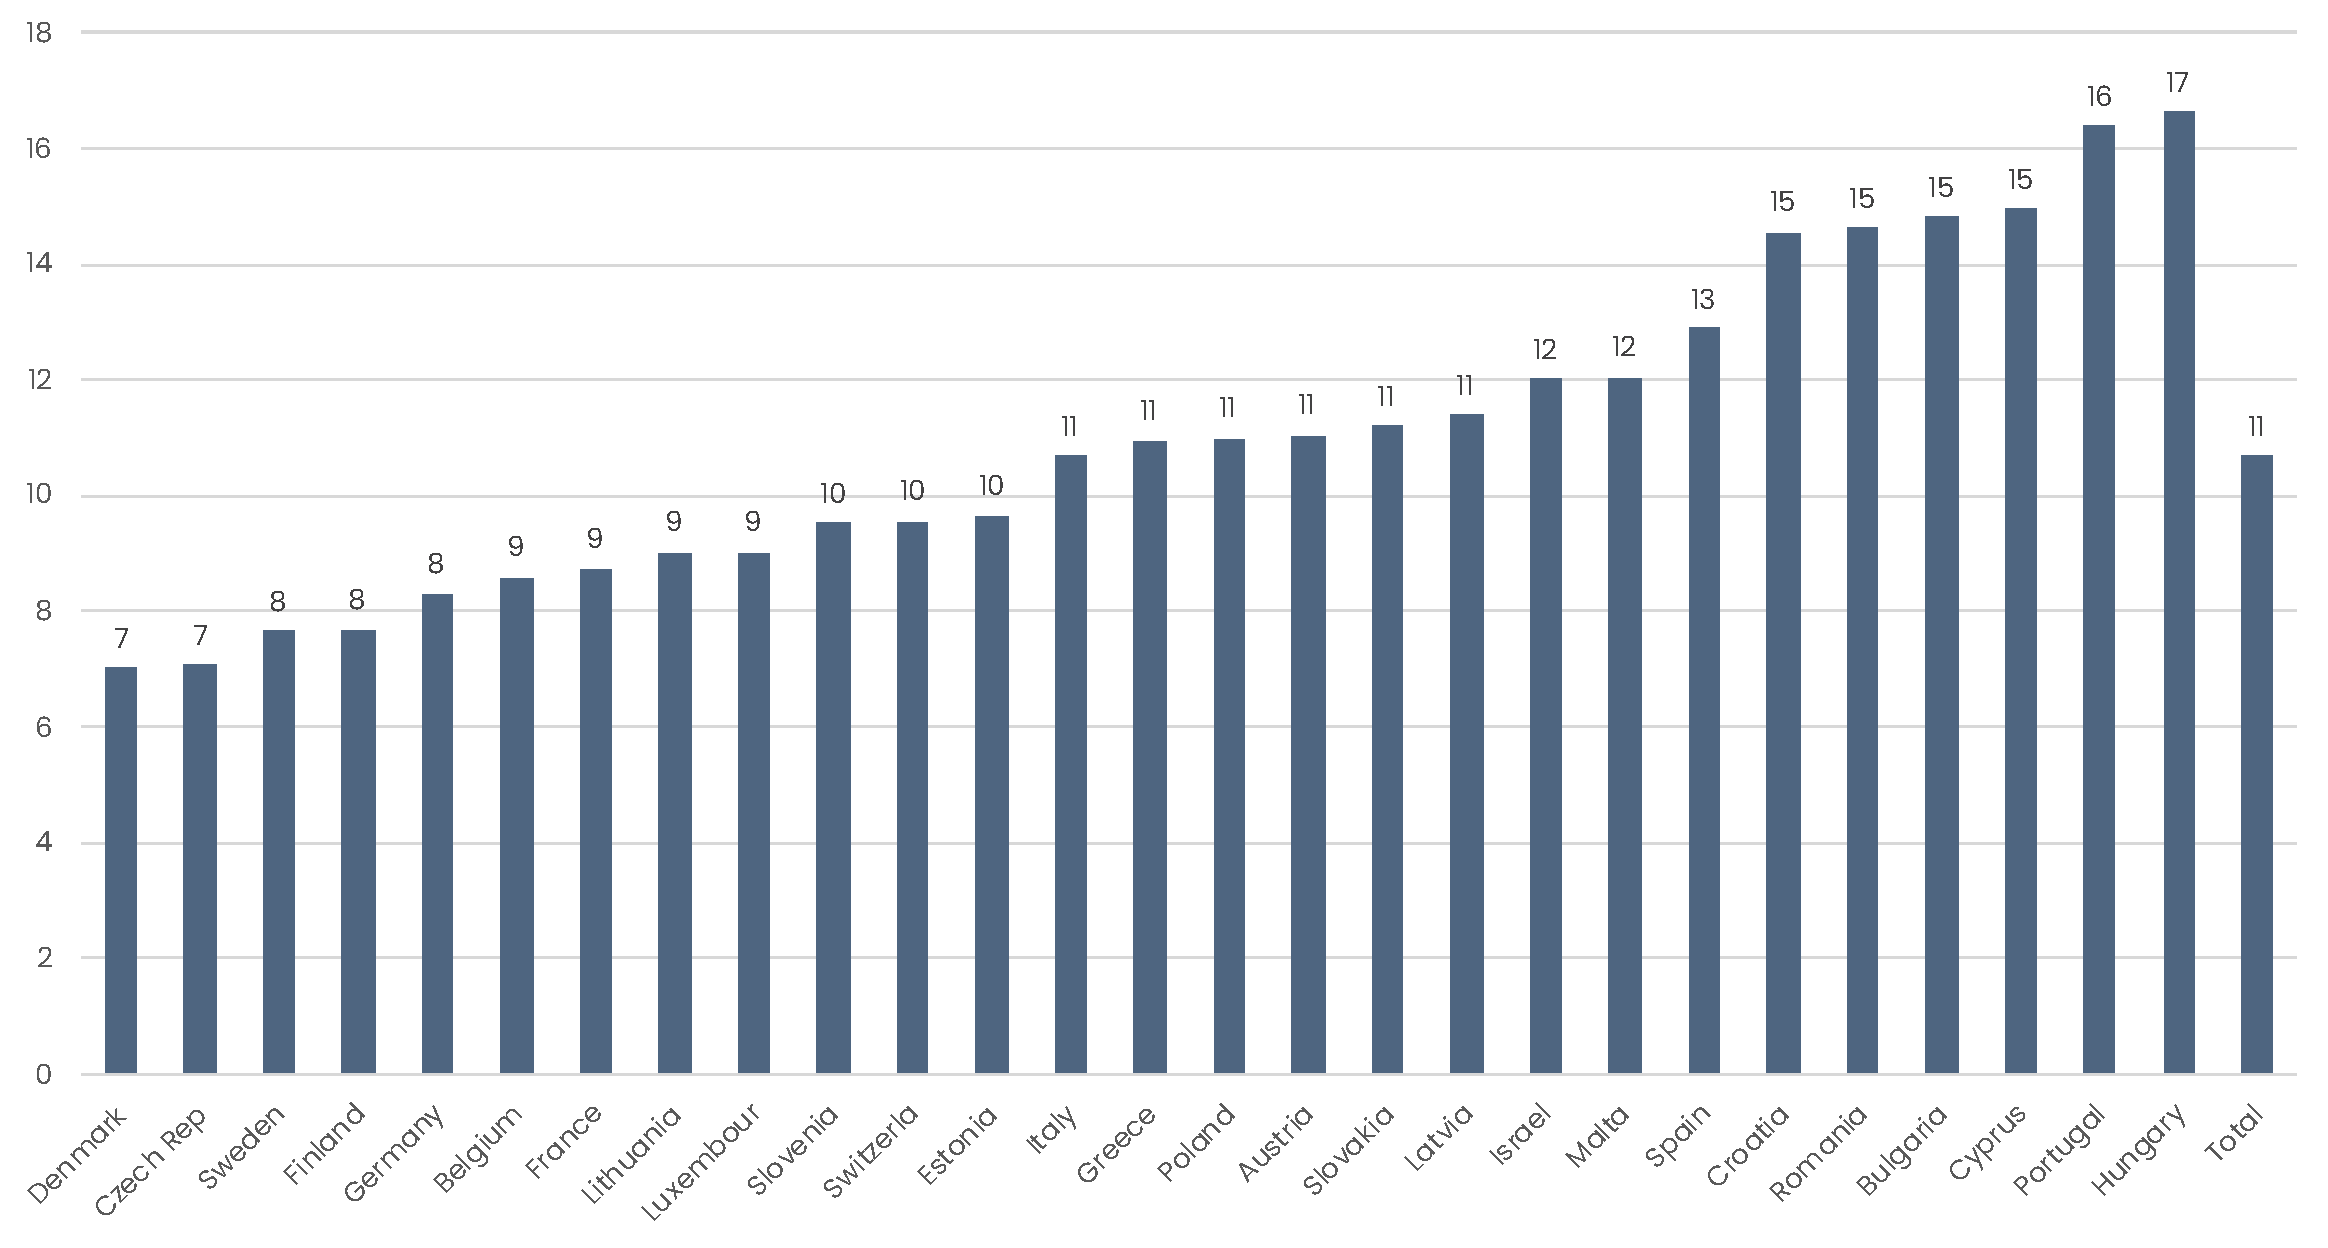
Financial situation over the life course in Finland
Financial circumstances in childhood
The survey includes a question about the situation while growing up and before the age of 16: “Would you say your family was pretty well off financially, about average, or poor during that time?”. Among all Finnish respondents, 5 percent indicated that they were well off, 64 percent responded “about average”, and 27 percent considered themselves poor. A bit less than 4 percent indicated that it varied. Figure 3.4.4 shows how these circumstances differed by cohort, as growing up in different times might change circumstances. The share indicating that they were poor decreased from one-third of the respondents born before 1940 to around one-fifth of the respondents born in 1960 or later. The group indicating that their circumstances were about average increased from 56 percent among the oldest cohorts to 72 percent among the youngest cohort. The share suggesting that they were pretty well off remained relatively stable or even declined somewhat. The latter could also be due to a social gradient in health and cumulative advantage across the life course: those who are well off in childhood have better prospects of healthy ageing and longer lives, resulting in their overrepresentation among the oldest cohorts in the sample.
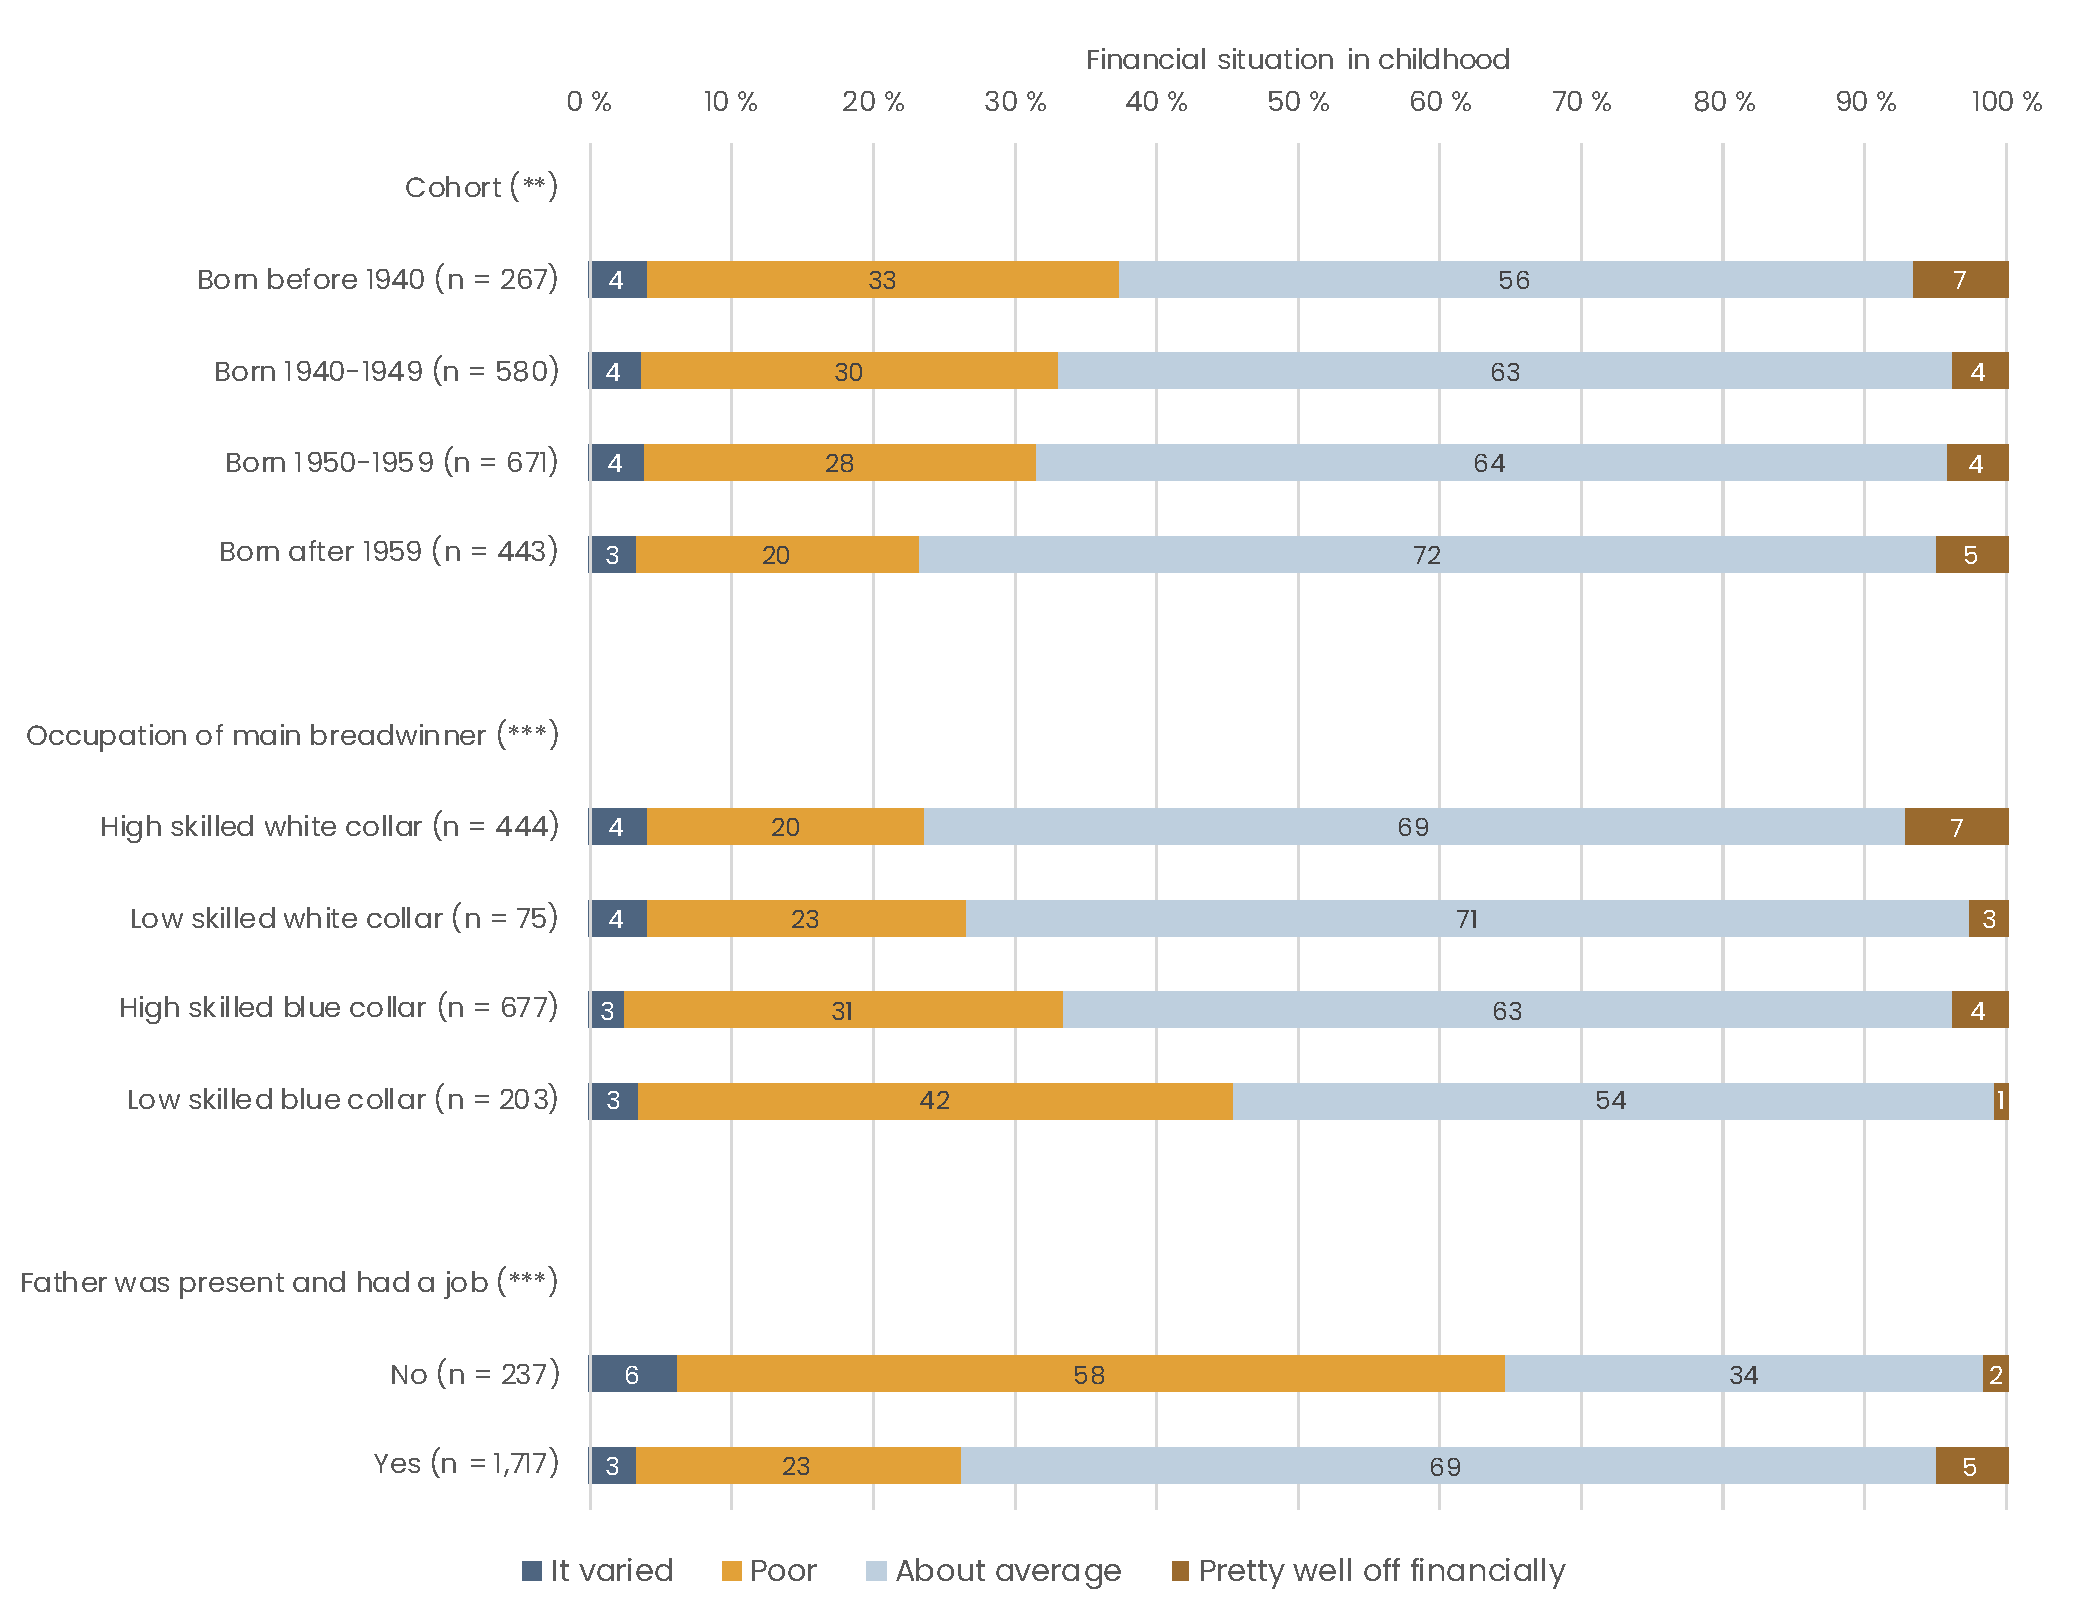
Note: ** p < 0.01, *** p < 0.001 in Pearson’s Chi-square test
Figure 3.4.4 also shows that the occupational status of the household’s main breadwinner at that time mattered. The share of respondents indicating that the family was poor during childhood ranged from 20 percent among high skilled white-collar workers to 42 percent among low skilled blue-collar workers. In addition, the presence and employment of the father mattered. In families where the father was present and employed, the incidence of poverty was much lower: 23 percent, compared 58 percent among those who indicated that the father was unemployed or absent around the respondent’s age of ten.
Financial hardship during adult life
Figure 3.4.2 indicated that around 40 percent of the Finnish respondents experienced a period of financial hardship during their life. In Figure 3.4.5, information on the occurrence of financial hardship was used to plot the percentage of the respondents in hardship at each age, showing the distribution of financial hardship across the life course. Overall, the number of respondents reporting financial hardship did not reach a level of more than 12 percent at any age. Financial hardship has been quickly rising around the age of 19 with the entry into adulthood, especially among women. Its incidence has tended to reach its zenith at the age of 34 for men and 36 for women, after which it starts to decline. Fewer respondents reported financial hardship at older age. It should be noted that the size of the sample becomes quite small after the age of 70.
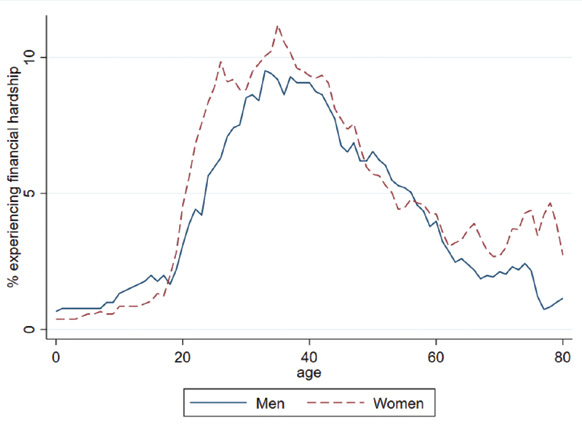
Figure 3.4.3 indicated that, although in international comparison the incidence of financial hardship in Finland has been relatively high, the average duration of spells of financial hardship have been relatively short. Figure 3.4.6 shows that in most cases, the spells lasted only a few years. After five years, less than half continued to experience hardship. After ten years, this share was around one-fourth. However, exit from hardship slowed down after ten years, indicating that a substantial group experienced deprivation for a large part of their lives. The figure shows no substantial differences between men and women.
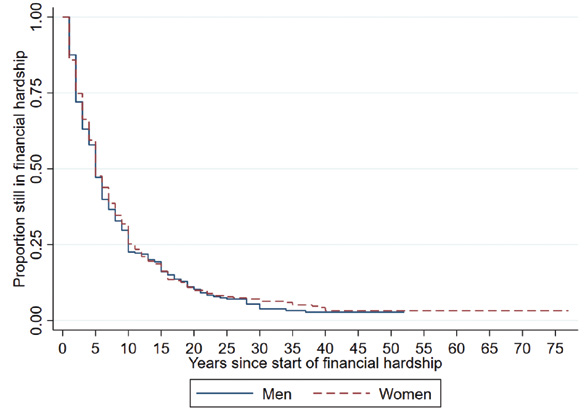
Ability to make ends meet at older age
In analyzing who is able to make ends meet at an older age, the study population in this section is limited to those aged 50 or over. Figure 3.4.7 provides bivariate descriptive statistics of how the ability to make ends meet differs by sociodemographic and socioeconomic background. There were no substantial differences between men and women or between age groups. The latter finding indicates that financial well-being remains relatively stable even as people age, retire and become more dependent on pensions, health care and the support of others. This has also been described as the “income satisfaction paradox”: older people often manage with lower income levels than younger people (Hansen et al., 2008; Palomäki, 2018).
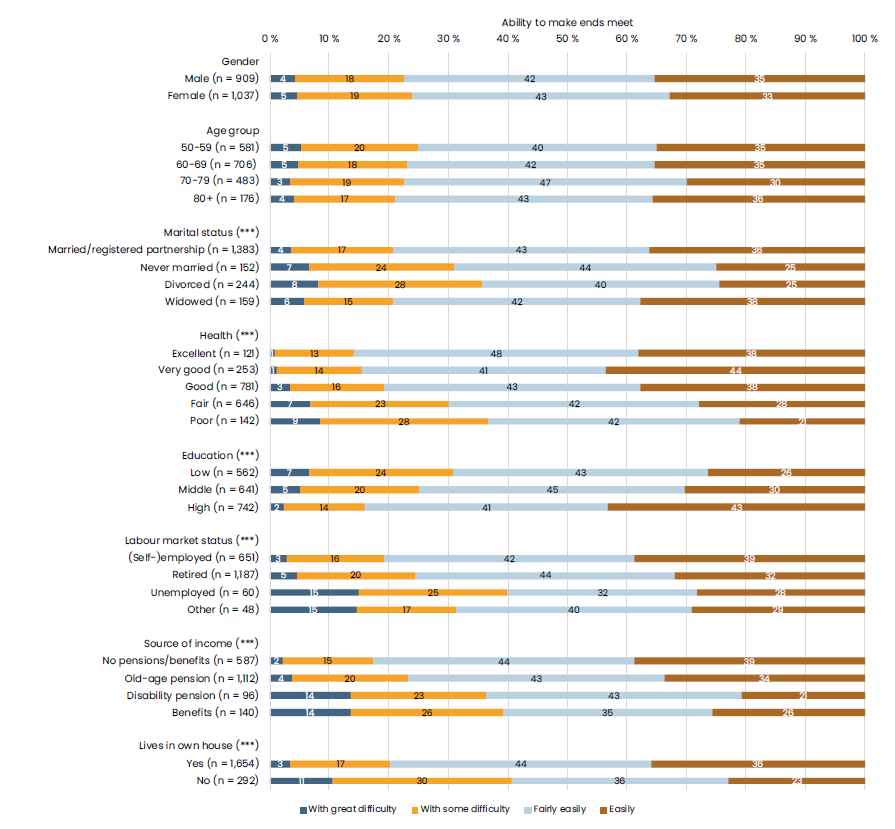
Note: *** p < 0.001 in Pearson’s Chi-square test
Those who had never married or who were divorced felt worse off than those who were married or widowed. This is in line with previous research showing that living with a spouse increases economic well-being due to having two incomes and the possibility to share expenses (Ahonen, Palomäki et al., 2018). In the case of widow(er)s, it is possible that the Finnish survivor pension provide an adequate income supplement or that these are primarily older persons who have adjusted their consumption to a possibly lower income level.
The relation between health and financial well-being is relatively strong as the ability to make ends meet declined as experienced general health worsened. Among those in excellent and very good health, around 15 percent indicated to have some or great difficulties to make ends meet, whereas among those in fair or poor health this share was over 30 percent. The relationships between socioeconomic status, income, health behaviors and health are well known, although complex (Polvinen et al., 2013). In addition, at older age, those in poorer health might have higher expenses on healthcare and medication, contributing to greater difficulties to make ends meet (Vaalavuo, 2020).
The link between socioeconomic status and subjective financial well-being can also be seen when comparing levels of education. Among the lower educated, around 30 percent of the respondents had some or great difficulties to make ends meet, whereas among the higher educated this share was only 16 percent. The differences in the ability to make ends meet between those who were employed or self-employed and those who were retired are relatively small, although the retired indicated that they had somewhat greater difficulties. Those who were unemployed or in other labor market statuses (including permanent sickness or disability and homemaking) experienced lower economic well-being, although the sizes of these groups were small. In line with this, source of income was also related with the ability to make ends meet. Those who did not receive any type of pensions or benefits (and were therefore most likely employed) reported the highest economic wellbeing, closely followed by those receiving a pension. Respondents receiving a disability pension or any type of social benefits had considerably more difficulties to make ends meet.
Homeownership has been the most important source of wealth in Finland (Ahonen, 2019). About 85 percent of the respondents indicated to own the home they live in. Those who did not own their place of residence reported substantially lower ability to make ends meet.
The interrelation of financial well-being across the life course
To observe the relations between financial well-being in childhood, adult life and old age, we cross-tabulated the variables for financial circumstances during childhood, the experience of financial hardship during adult life (limited to cases where the onset of hardship was between the ages of 19 and 49), and the ability to make ends meet at older age (limited to respondents 50 years or over).
In Figure 3.4.8, the ability to make ends meet by respondents over the age of 50 is plotted by financial circumstances during childhood. It shows that those who indicated that they were poor when growing up also experienced the greatest difficulties to make ends meet at older age: 8 percent of the respondents indicated that they have great difficulty and another 22 percent some difficulty. The relation between financial hardship during adult life and the ability to make ends meet at old age is weaker but still present. If, as observed earlier, financial hardship took place in the phase of transitioning into adulthood, people have had plenty of time to “catch up” during their adult working lives. Therefore, it may be a poor predictor for economic well-being in later life. Poverty during childhood, on the other hand, might create disadvantages in early life that continue to accumulate during the life course.
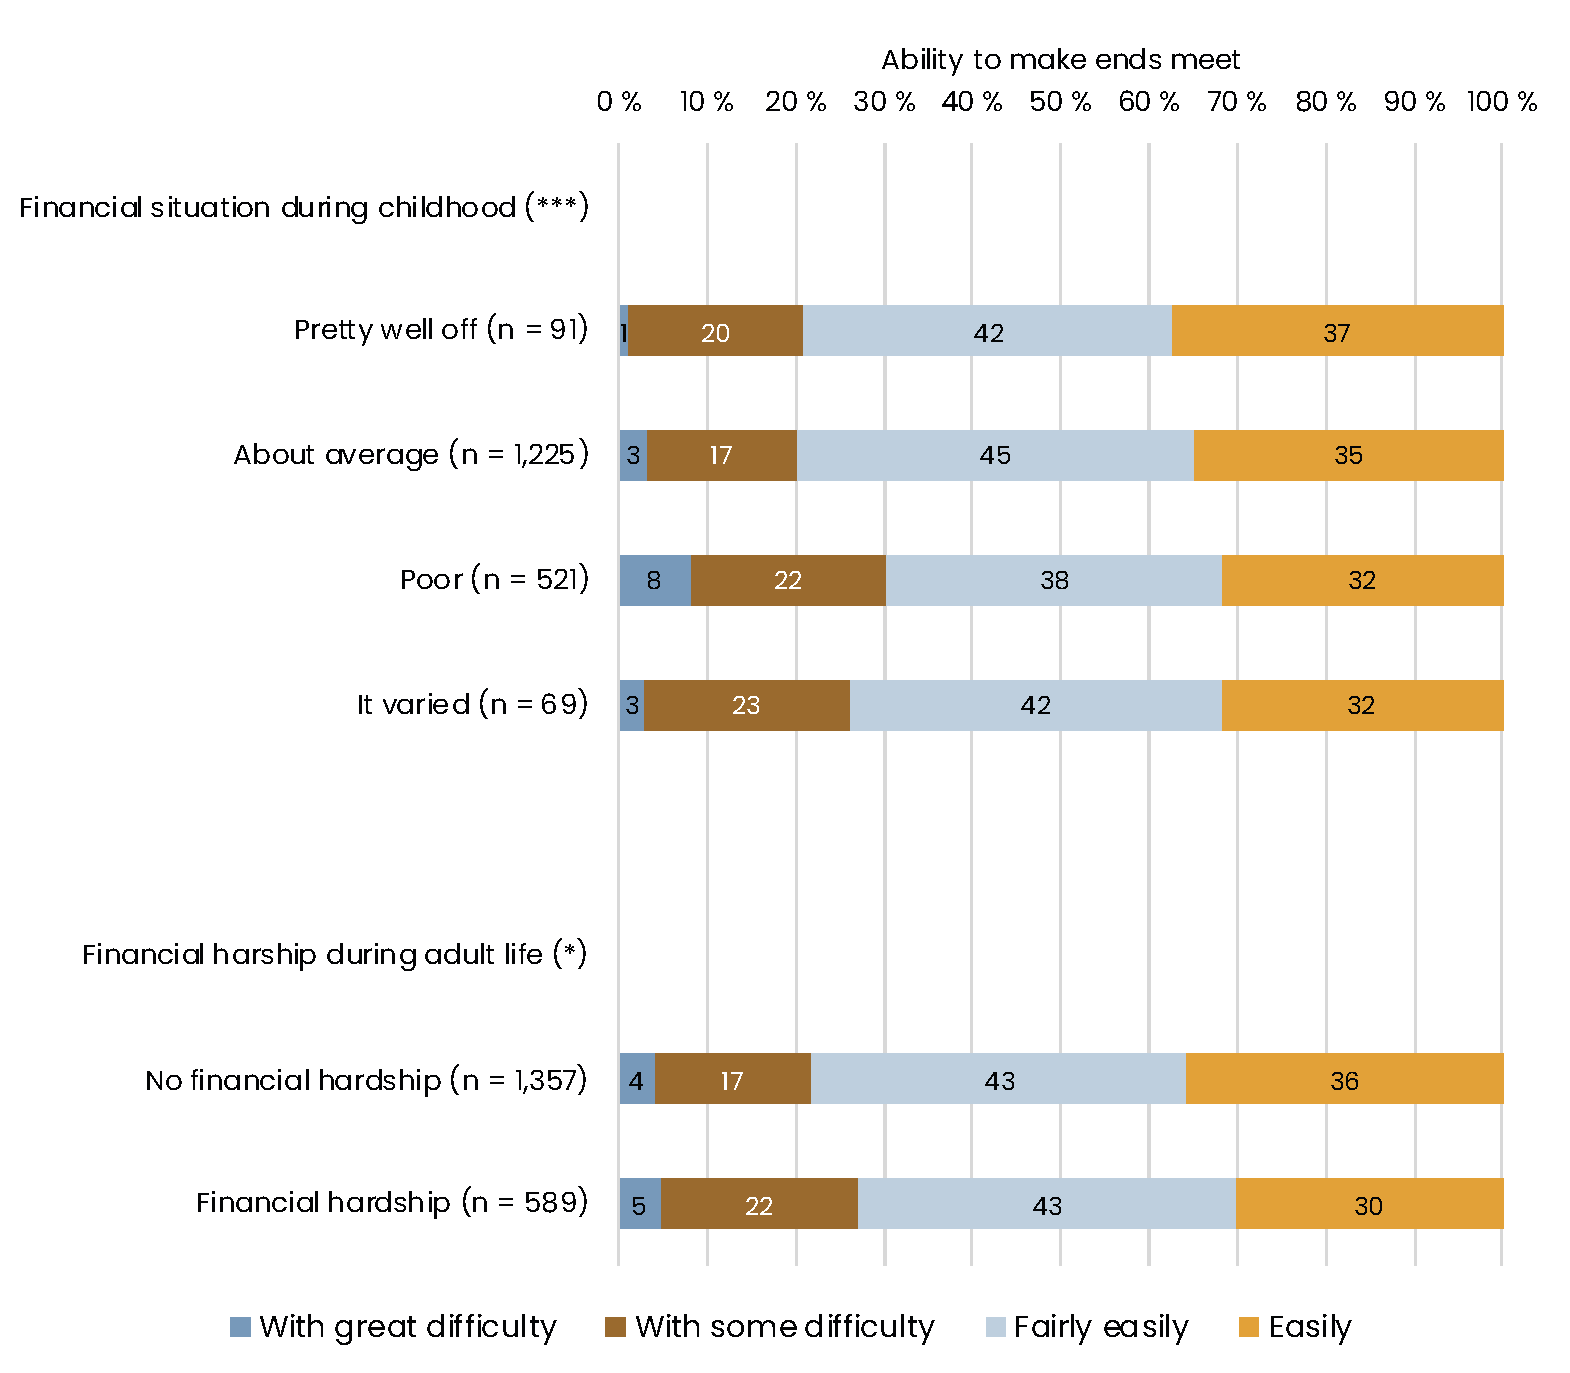
Note: * p < 0.05, *** p < 0.001 in Pearson’s Chi-square test
Conclusions
In this chapter, we described how SHARE data can be utilized in studying the financial situation and economic well-being in Finland from a comparative perspective and across the life course. We showed some of the possibilities for comparison and linking life-course stages and background variables. More sophisticated analysis will be needed for a deeper understanding of these matters. Although there are obvious limitations as the life-course data is collected retrospectively and people are asked about subjective experiences, SHARE data provides a welcome complement to existing Finnish register and survey data. First, it allows longitudinal analysis, even going back to childhood circumstances and parents’ status, where sometimes longitudinal register data does not reach or provide adequate information. Second, the internationally harmonized data allows new ways to look at Finland from a comparative perspective. Moreover, if linkage with Finnish register data is possible in the future, new opportunities for research on financial well-being across the life course will arise.
References
Ahonen, K., Kuitto, K., & Palomäki, L.-M. (2017). Eläkeikäisten toimeentulo ja pienituloisuus eurooppalaisessa vertailussa [Retirement income and low income in a European comparison]. In: S. Kuivalainen, J. Rantala, K. Ahonen, K. Kuitto, & L.-M. Palomäki (Eds.). Eläkkeet ja eläkeläisten toimeentulo 1995-2015 [Pensions and pensioners’ economic welfare 1995-2015] (pp. 143-167). Eläketurvakeskuksen tutkimuksia 01/2017. Helsinki: Eläketurvakeskus.
Ahonen, K., Palomäki, L.-M., & Polvinen, A. (2018). Eläkeläisten toimeentulokokemukset vuonna 2017 [Pensioners’ perceived economic welfare in 2017]. Eläketurvakeskuksen tutkimuksia 03/2018. Helsinki: Eläketurvakeskus.
Ahonen, K., Kuivalainen, S., Liukko, J., Nivalainen, S., Palomäki, L.-M., & Polvinen, A. (Eds.). (2019). Tutkimuksia eläkeläisten toimeentulokokemuksista ja taloudellisesta hyvinvoinnista [Studies on retirees’ perceived and overall economic well-being]. Eläketurvakeskuksen tutkimuksia 02/2019. Helsinki: Eläketurvakeskus.
Airio, I., Blomberg, H., Kangas, O., Kroll, C., & Niemelä, M. (2013). Täyden kansaneläkkeen saajien tulot ja kokemukset toimeentulosta [Income and livelihood experiences of recipients of full public pensions]. In: I. Airio (Ed.). Toimeentuloturvan verkkoa kokemassa: Kansalaisten käsitykset ja odotukset [Experiencing the income security network: Citizens’ perceptions and expectations] (pp. 142-167). Helsinki: Kelan tutkimusosasto.
Bask, M., Haapakorva, P., Gissler, M., & Ristikari, T. (2020). Growing up in economic hardship: The relation between childhood social assistance recipiency and early adulthood obstacles. International Journal of Social Welfare. Published online ahead of print. https://doi.org/10.1111/ijsw.12444
Haapola, I., Karisto, A., & Seppänen, M. (2012). Ikääntyvien köyhyys ja sen heijastumat hyvinvointiin [Poverty of the elderly and its reflections on well-being]. In: K. Forssén, I. Roivainen, S. Ylinen, & J. Heinonen (Eds.). Kohtaako sosiaalityö köyhyyden? [Does social work address poverty?] (pp. 275-300). Kuopio: UNIpress.
Hagfors, R., Hellsten, K., Ilmakunnas, S., & Uusitalo, H. (Eds.). (2003). Eläkeläisten toimeentulo 1990-luvulla [The livelihood of retirees in the 1990s]. Eläketurvakeskuksen tutkimuksia 1/2003. Helsinki: Eläketurvakeskus.
Hansen, T., Slagsvold, B., & Moum, T. (2008). Financial satisfaction in old age: A satisfaction paradox or a result of accumulated wealth? Social Indicators Research, 89(2), 323-347. https://doi.org/10.1007/s11205-007-9234-z
Kautto, M. (ed.). (2011). Eläkkeet ja eläkkeensaajien toimeentulo [Pensions and livelihoods of pensioners]. Eläketurvakeskuksen tutkimuksia 04/2011. Helsinki: Eläketurvakeskus.
Kautto, M., Palomäki, L.-M., Rantala, J., & Tuominen, E. (2009). Eläkeläisten tulot ja kokemukset toimeentulosta [Pensioners’ income and perceived adequacy of income]. Yhteiskuntapolitiikka, 74(3), 290-302.
Kautto, M. & Kuitto, K. (2021). The Nordic Countries. In: D. Béland, S. Leibfried, K.J. Morgan, H. Obinger & C. Pierson (Eds.). The Oxford Handbook of the Welfare State (2nd ed.). Oxford: Oxford University Press (in press).
Kuivalainen, S., Rantala, J., Ahonen, K., Kuitto, K., & Palomäki, L.-M. (2017). Eläkkeet ja eläkeläisten toimeentulo 1995-2015 [Pensions and pensioners’ economic welfare 1995-2015]. Eläketurvakeskuksen tutkimuksia 01/2017. Helsinki: Eläketurvakeskus.
Palomäki, L.-M. (2011). Eläkeläisten kokemukset toimeentulosta [Retirees’ experiences of livelihood]. In: M. Kautto (Ed.). Eläkkeet ja eläkkeensaajien toimeentulo 2000-2010 [Pensions and livelihoods of pensioners 2000-2010] (pp. 113-127). Eläketurvakeskuksen tutkimuksia 04/2011. Helsinki: Eläketurvakeskus.
Palomäki, L.-M. (2018). Pensioners’ subjective economic well-being in European countries: comparisons behind the income satisfaction paradox. Turku: University of Turku.
Palomäki, L.-M. (2019). Vanhuuseläkeläisten subjektiiviset toimeentulovertailut ja taloudellinen tyytyväisyys – oma aiempi tilanne vai toiset ihmiset toimeentulokokemusten mittapuuna? [Subjective income comparisons and financial satisfaction of retirees on an old-age pension – benchmarking with own previous situation or that of others?] In: K. Ahonen, S. Kuivalainen, J. Liukko, S. Nivalainen, L.-M. Palomäki, & A. Polvinen (Eds.). Tutkimuksia eläkeläisten toimeentulokokemuksista ja taloudellisesta hyvinvoinnista [Studies on retirees’ perceived and overall economic well-being] (pp. 113-135). Eläketurvakeskuksen tutkimuksia 02/2019. Helsinki: Eläketurvakeskus.
Pettinicchi, Y., & Börsch-Supan, A. (2019). Retirement Income Adequacy of Traditionally Employed and Self-Employed Workers: Analyses with SHARE Data. MEA Discussion papers 02/2019. Munich: Munich Center for the Economics of Ageing. https://doi.org/10.2139/ssrn.3451973
Polvinen, A., Gould, R., Lahelma, E., & Martikainen, P. (2013). Socioeconomic differences in disability retirement in Finland: the contribution of ill-health, health behaviours and working conditions. Scandinavian Journal of Public Health, 41(5), 470-478. https://doi.org/10.1177/1403494813482400
Riekhoff, A.-J. & Järnefelt, N. (2018). Retirement trajectories and income distribution through the pension system in Finland. Social Forces, 97(1), 27-54. https://doi.org/10.1093/sf/soy028
Stiglitz, J. E. & Sen, A. & Fitoussi, J.-P. (2009). Report by the commission on the measurement of economic performance and social progress. Retrieved from www.insee.fr/en/information/2662494 on December 04, 2020.
Uusitalo, H. (2006). Eläkkeet ja eläkeläisten toimeentulo. Kehitys vuosina 1990-2005 [Pensions and pensioners’ livelihoods. Development 1990-2005]. Eläketurvakeskuksen raportteja 2/2006. Helsinki: Eläketurvakeskus.
Vaalavuo, M. (2020). Use of public health and social care services among the elderly in Finland: An under-examined mechanism of redistribution. Journal of European Social Policy, 30(2), 176-189. https://doi.org/10.1177/0958928719879283
3.5 The family situation across the life-course (Hägglund & Rotkirch)
Anna Erika Hägglund, Population Research Institute
Anna Rotkirch, Population Research Institute
Background
The European postwar baby boomer generation, which sparked the sexual revolution and raised the rates of divorce and cohabitation in the 1960s and 1970s, continues to alter partnership dynamics also at old age. Compared to previous generations, today’s ageing population is unique in how and to what extent it experiences divergence in family dynamics (Brown & Wright, 2017). As life expectancy has dramatically increased, older adults live longer in partnerships and enter widowhood at later ages (Gierveld, 2004; Kinsella & Philips, 2005). Scholars also document an increase in other marital transitions among the ageing population – so called “gray divorce” or “gray remarriage” (Brown & Lin, 2012; Brown, Lin & Hammersmith, 2018) – and highlight that cohabitation, non-residential partnerships, and dating have emerged as new forms of stable relationships at old age (Brown & Wright, 2017; Connidis et al., 2017; Gierveld, 2004). Finally, todays’ aging population is increasingly affected by lifetime childlessness and grand-childlessness; a phenomenon raising questions about caregiving and intergenerational support (AWOC, 2015; Dykstra, 2009; Kohli et al., 2005).
Changes towards more versatile partnership and living arrangements, the detachment of marital unions from reproductive behavior, increasing divorce rates, and the decline in fertility have most prominently been conceptualized within the framework of the second demographic transition (SDT) (see, e.g., Lesthaeghe, 2010). However, the question whether such increasing complexities in family life are visible in today’s ageing population, or only among younger cohorts of men and women, is still under debate. For instance, while some studies point to the growing share of unmarried, divorced, or cohabitating older adults, others emphasize the prevalence of one marital union (see, e.g., Brown & Lin, 2012; Brown & Wright, 2017; Kohli et al., 2005; Van Winkle, 2018). One reason for the different interpretations is the substantial variation in family dynamics across countries (Van Winkle, 2018) and across groups of men and women (Sobotka, 2008). The Nordic countries are usually considered forerunners of demographic and societal transformations in post-industrial societies, thanks to their early policy support for social equality and dual earner/dual carer arrangements (Andersson et al., 2017; Jalovaara et al., 2019). In Finland, the baby boomers, and the following generations, grew up in an exceptional time; the economy shifted from agricultural to industrial, and even post-industrial (Karisto, 2007), and early family policies supporting maternal employment were established (Haataja, 2004). These dimensions are generally considered key factors not only for women’s employment, but also their reproductive behavior (Esping-Andersen, 1990; Mills et al., 2011; Perelli-Harris & Lyon-Amos, 2015; Van Winkle, 2018). Yet family dynamics in Finland are not homogeneous, and vary, for instance, by educational level (Jalovaara et al., 2019; Jalovaara & Fasang, 2020).
In this chapter, we describe family patterns of the ageing population in Europe, focusing particularly on Finland. Understanding family dynamics and their variation across and within countries is crucial. As one of the key institutions, family organizes both gender and intergenerational relationships (Kohli et al., 2005). Partnerships, together with other family relationships, are key components of social dynamics and well-being (Carr & Springer, 2010; Tanskanen et al., 2019; Wong & Wait, 2015). For instance, partnered older adults report higher levels of life satisfaction and well-being than their unpartnered counterparts (Peters & Liefbroer, 1997; Wong & Wait, 2015; Wright & Brown, 2017). Scholars also show that older adults with children and grandchildren both give and receive extensive support (Albertini & Kohli, 2017; Danielsbacka et al., 2013). Thus, the prospect of ‘aging alone’ is often argued to foster isolation and strengthen disadvantages (see, e.g., Verdery et al., 2019, for a critical perspective, see, e.g., Mair, 2019).
In what follows, we depict family patterns of older adults in Europe, and then scrutinize differences by gender, cohort, and education in Finland in greater detail. The SHARE data provides a unique opportunity to analyze family trajectories of the ageing population in Finland and to systematically compare Finnish older adult with their European counterparts.
Finnish family trajectories in cross-national comparison
Figure 3.5.1 displays the most recent relationship status by gender and age among all SHARE respondents¹. Overall, most respondents below the age of 80 are currently married. For instance, 76 percent of all women and 78 percent of all men aged 50–59 are married. Women continue to experience spousal death more often than similarly aged men. Divorce and cohabitation seem to be more frequent in the younger age groups. Among the 50–59-year-olds, some 7 percent of men and 9 percent of women are currently divorced and live alone, while some 5 percent cohabit.
¹The subsequent analyses draw on the biannual panel data and the retrospective life histories, which were collected in wave 3 (2008/2009) and wave 7 (2016/2017) (see also Chapter 2 in this volume). To examine not only current family dynamics, but also cross-national variation in relationship trajectories, we restrict the sample to men and women who participated either in wave 3 or in wave 7. Given small inconsistencies in reported relationships between the panel and life history questionnaire, each figure entails the data source. General patterns and country differences are not affected by these inconsistencies. The data is not weighed. Finally, while the definition of baby boomers varies across countries, SHARE also entails data on younger cohorts. In the subsequent analyses, the youngest respondents are born in 1967.
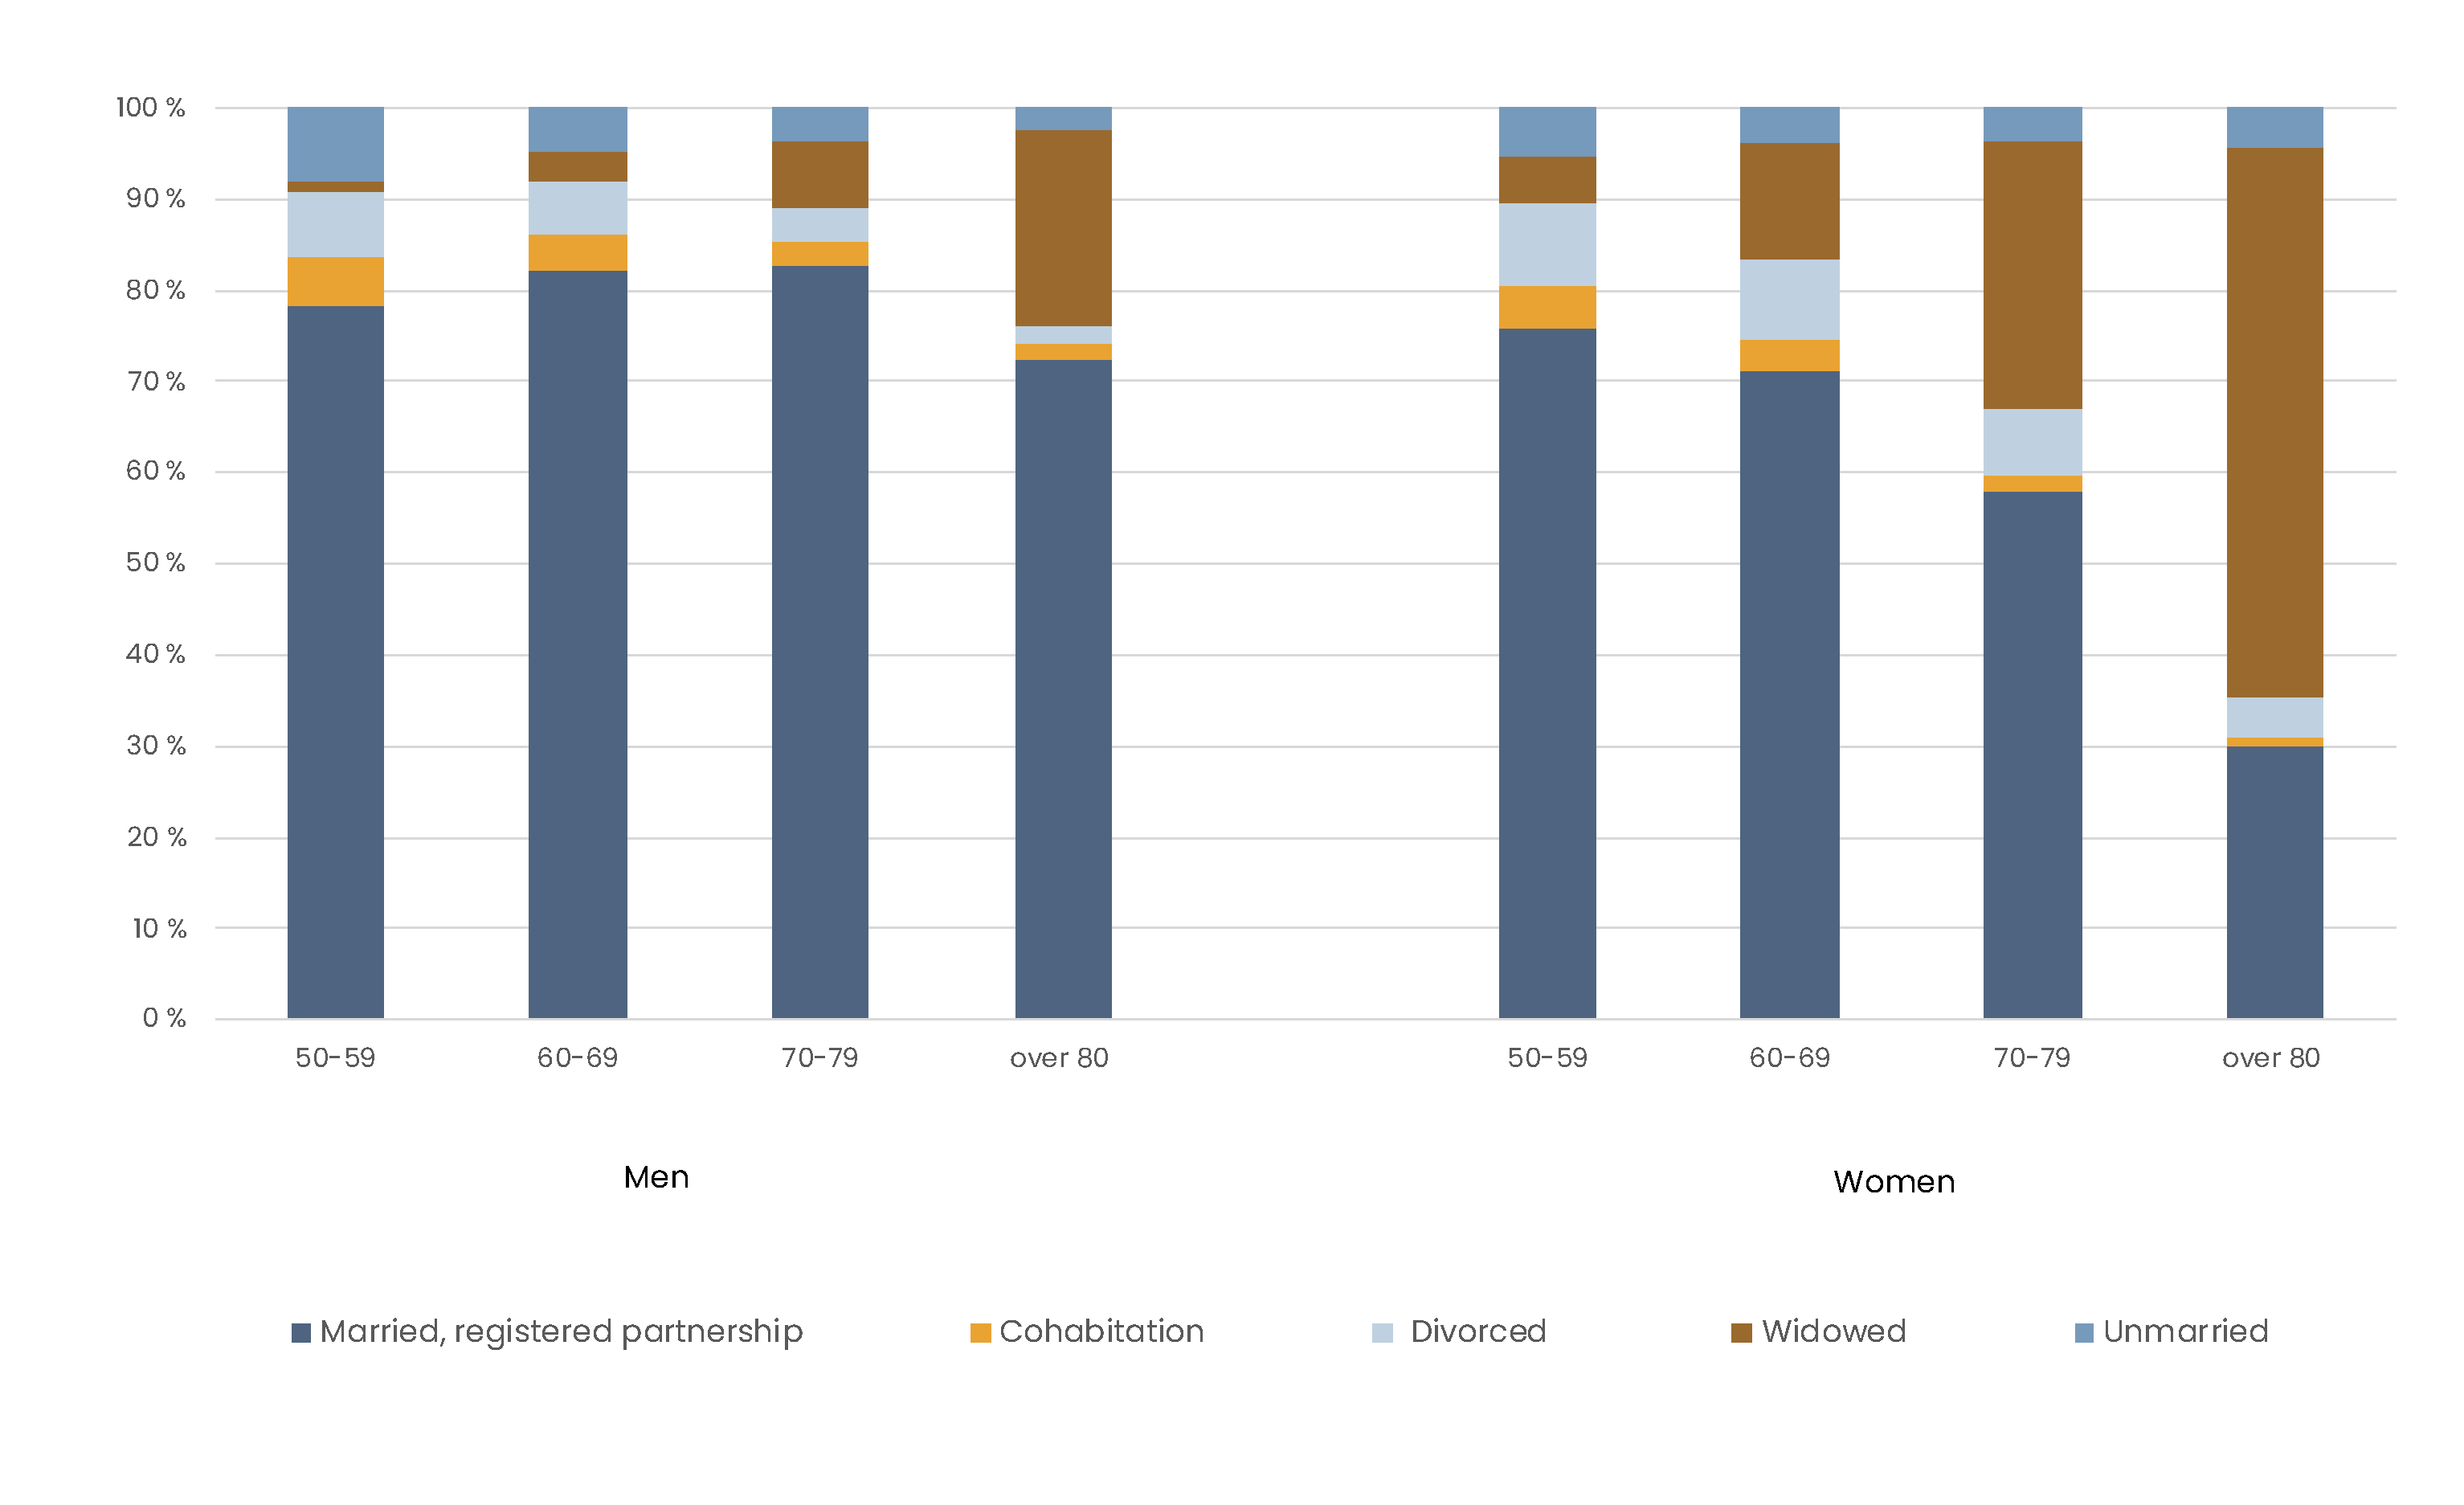
Note: Data from SHARE, panel questionnaire
The family patterns of the ageing population vary across countries. The shift towards more diverse family patterns began earlier in the Nordic countries than elsewhere and has been linked to strong policy support for social and gender equality. An extensive welfare state enables individuals to opt for other arrangements than marriage and mitigates the costs of union dissolution (Andersson et al., 2017; Lesthaeghe, 2010; Van Winkle, 2018). The Nordic countries are often contrasted with conservative continental European regimes (e.g., Germany or Austria), where family policies historically favor male-breadwinning/female-caregiving arrangements. Scholars also identify the family-centered Southern Europe (e.g., Italy or Spain), where state support for care of dependent family members is meager and encourages traditional marital unions, and Eastern European countries, which exhibited a distinct combination of policy support for maternal employment and pro-natalist policies promoting early marriage and child-bearing (Kohli et al., 2005; Perelli-Harris & Lyons-Amos, 2015; Van Winkel, 2018). Figure 3.5.2 depicts differences in the most recent relationship status for a selected number of countries, focusing on the population aged 50–75. Most importantly, differences in men’s life expectancy across countries have spill-over effects on family dynamics: women in Eastern and Southern European countries experience the death of a spouse much earlier than their Nordic or German counterparts (see also Kohli et al., 2005). Unsurprisingly, our results show that cohabitation is more common in the Nordic countries, but also in Estonia and Switzerland, than in Southern or several other Eastern European countries. For instance, cohabitation among older adults vary from approximately 8 percent in Finland to below 2 percent in in Poland. The share of divorced older adults is also the lowest in Southern European countries and higher in the Nordic ones. In several countries, women are somewhat more likely to remain divorced. One reason for this pattern is that men tend to form new relationships more often after union dissolutions (see also Brown et al., 2019; Gierveld, 2004).
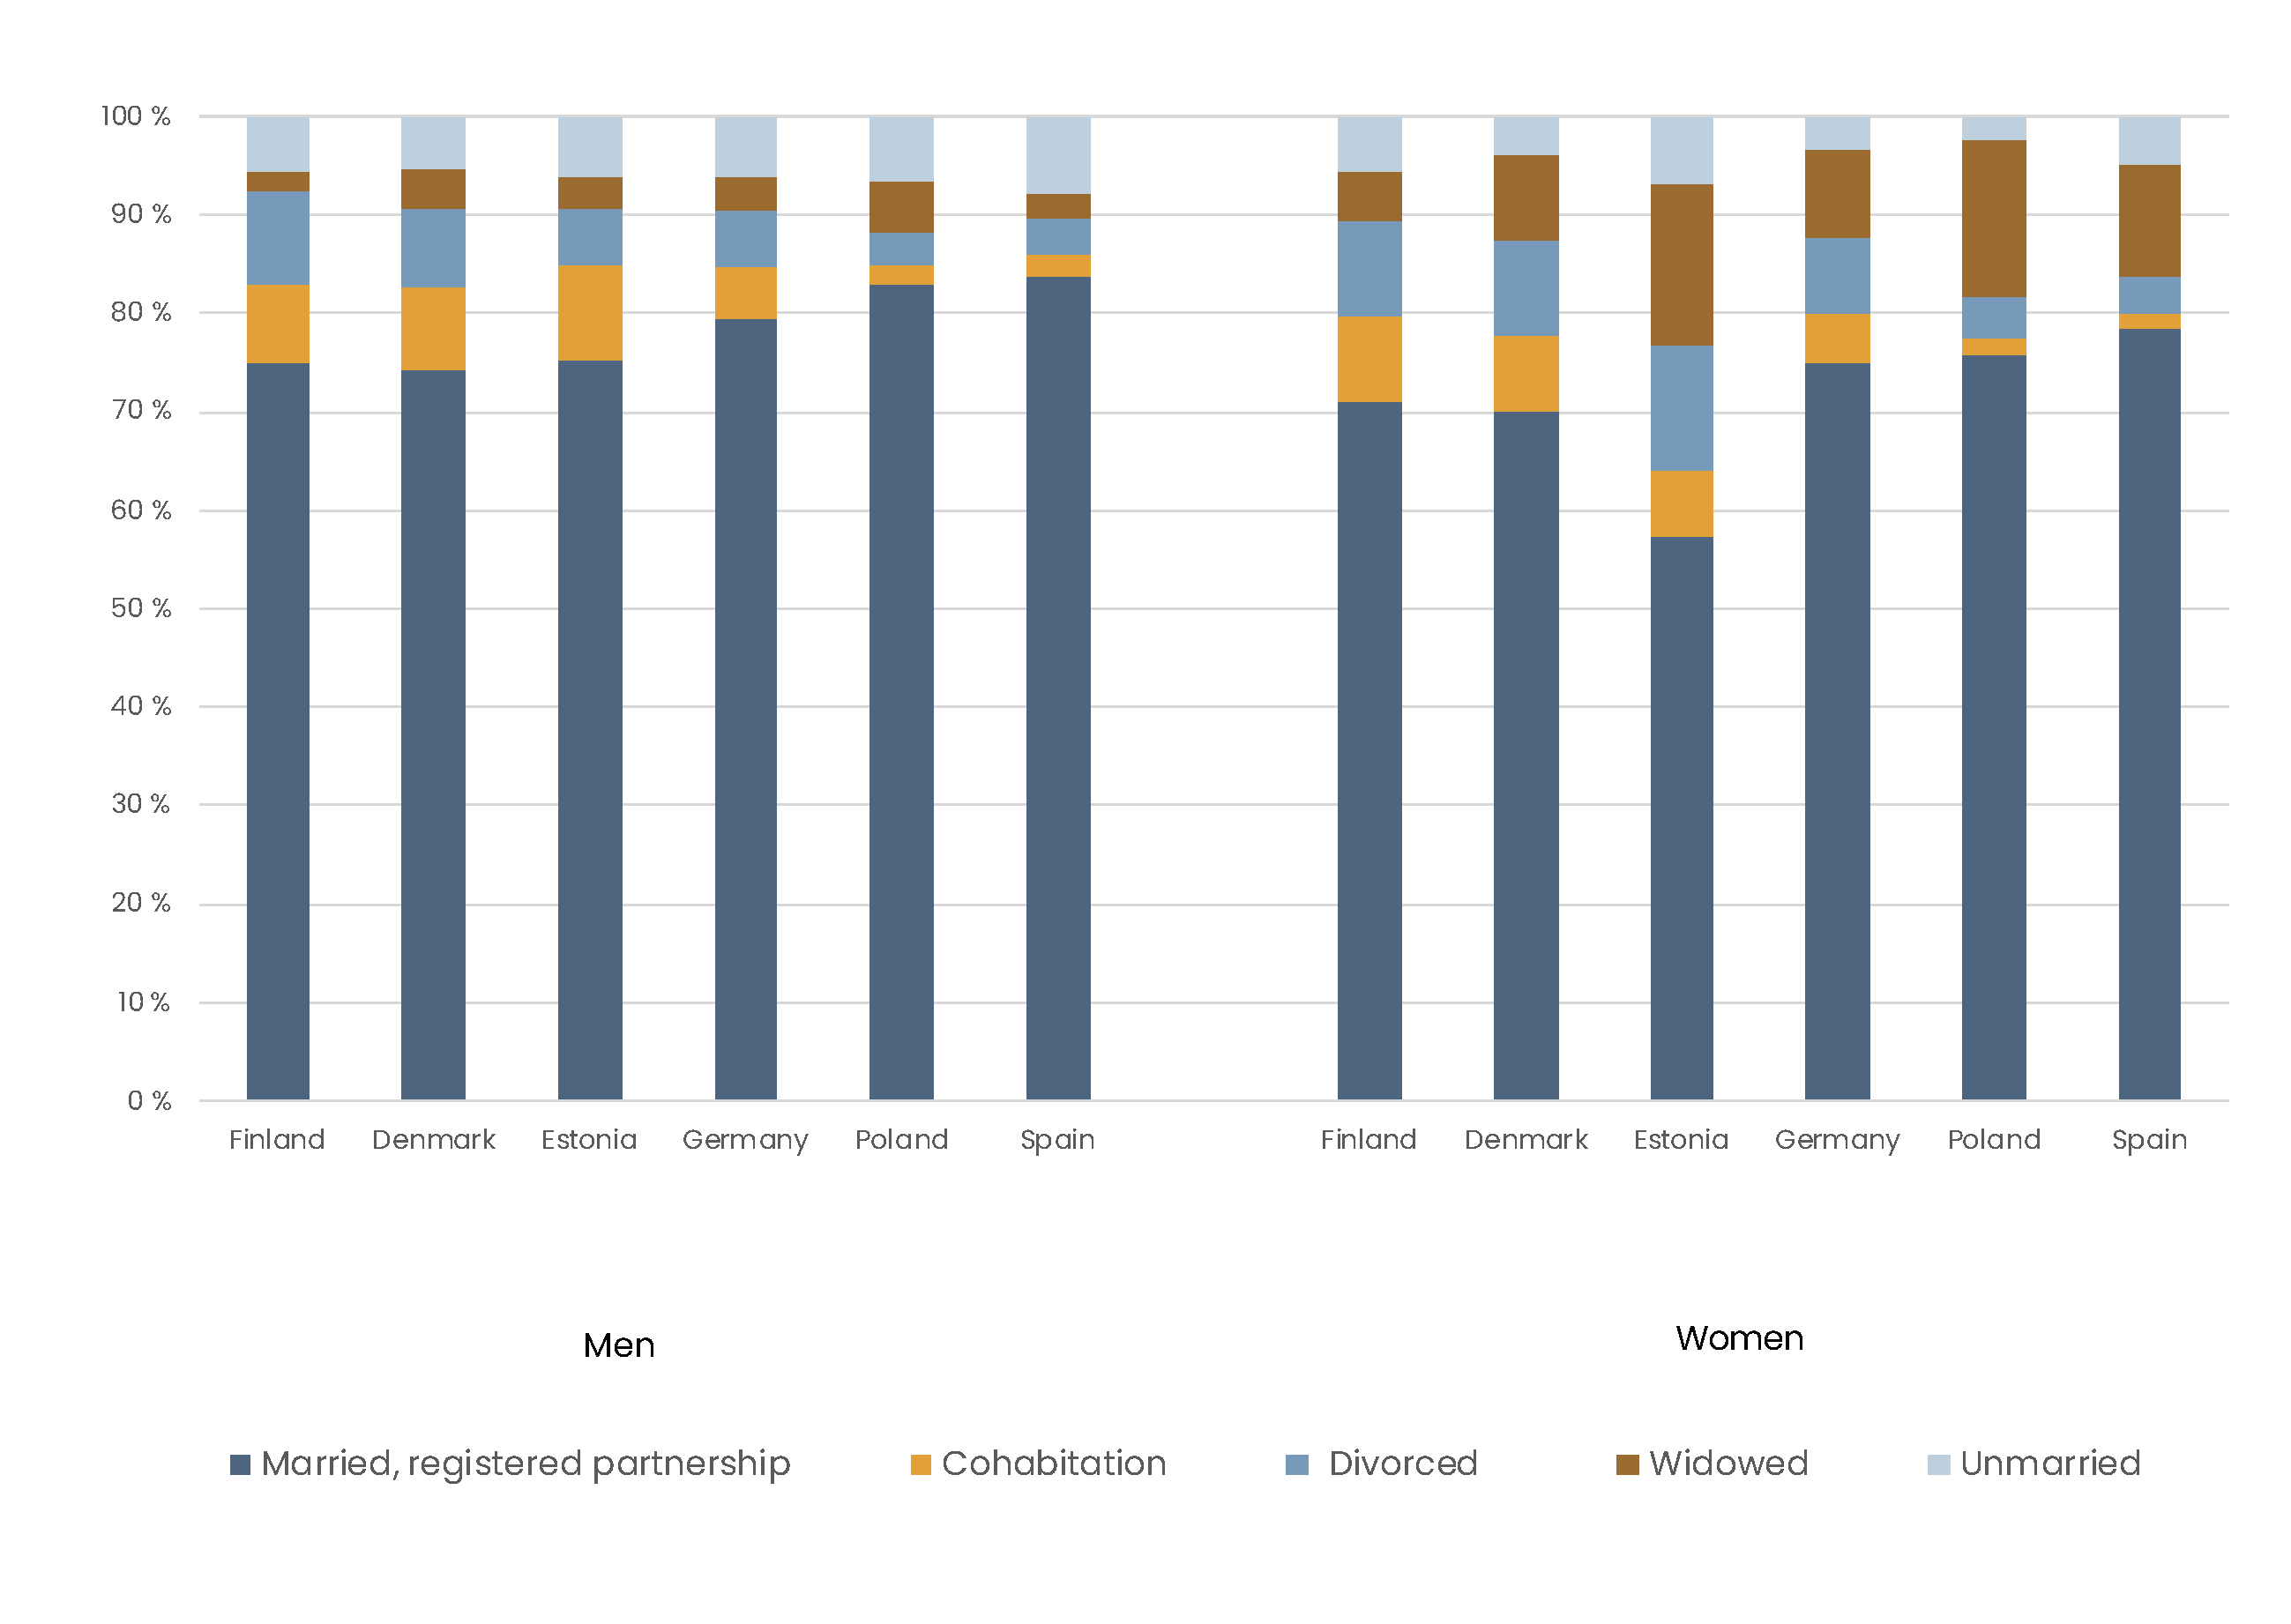
Note: Data from SHARE, panel questionnaire
In fact, analyzing the most recent relationship status conceals within and between country differences in relationship trajectories. The retrospective SHARELIFE questionnaire asks participants to report all marital and cohabitational relationships, as well as important relationships, in which respondents did not live with their partner (dating or living apart together (LAT) relationships). This allows researchers to compare the frequency and types of relationships, union dissolutions, and transitions into new relationships over the life course and across countries. Most SHARE respondents have been married at least once; on average 92% (Figure 3.5.3). As Figure 3.5.3 indicates, relationship histories of the ageing population tend to be more homogenous in Southern and Eastern European countries, where one marital union is the dominant pattern (see also Van Winkle, 2018). In contrast, men and women in the Nordic countries, together with the Baltic and the conservative, continental European countries, such as Germany, Austria, or Switzerland, are more likely to form a new partnership after divorce or widowhood; in these countries, between 26 (Denmark) and 15 percent (Luxemburg) engaged in new partnerships. In most countries, yet not in all, men are more likely to form multiple relationships throughout their life course.
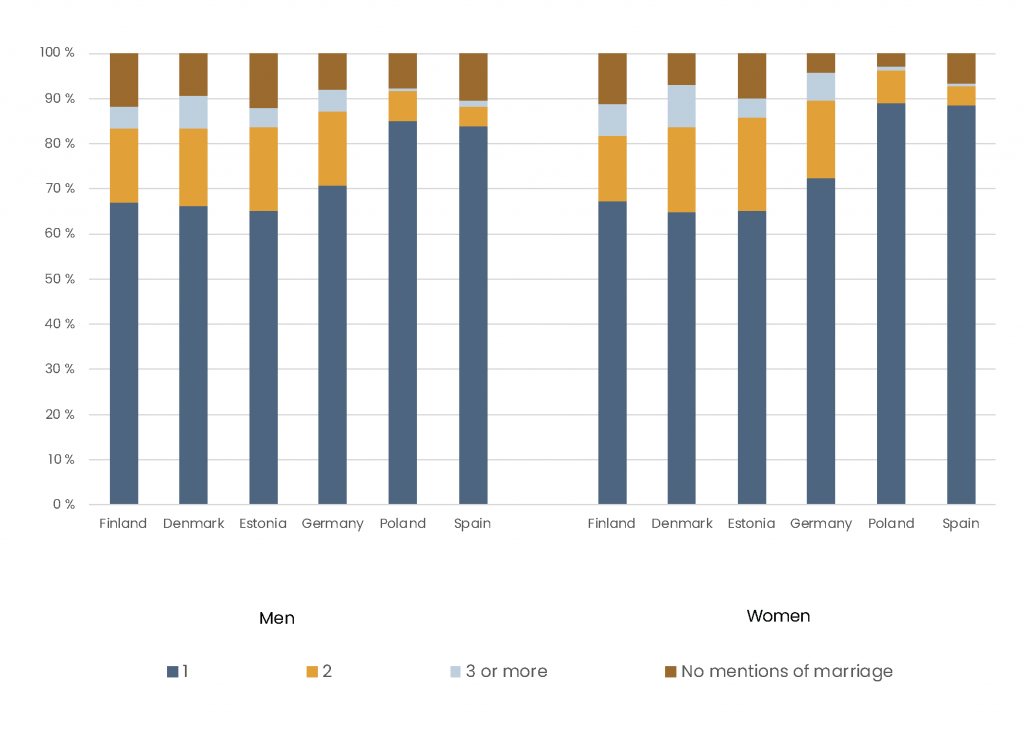
Notes: Data from SHARELIFE, retrospective questionnaire; First marriage is included (1). ‘No mentions of marriage’ entail those who never partnered and those who cohabited or dated.
Which type of new relationships did men and women in these countries then form? As Figure 3.5.4 highlights, marriage continued to be the most common type of a new relationship in all countries, but respondents also frequently opted for cohabitation. The average duration of post-marital cohabitation is approximately 14 years (not shown), suggesting that cohabitation is a stable relationship form, in which social support is disconnected from the legal obligations of marriage (see also Brown & Wright, 2017). It is worth noting that both men and women were predominantly in their 30s and 40s when engaging in a new relationship, but, across all countries almost 30 percent of all ‘new relationships’, i.e. relationships after first marriage, were formed at the age of 50 or over (not shown). Finally, non-residential relationships, i.e. ‘living alone together’ (LAT)’, seem to gain popularity across diverse policy contexts, such as Austria, France, and Finland and Denmark. In Finland, among all those who neither cohabited nor were married in the most recent wave, 17 percent had a partner outside the household. In Sweden or Denmark, the comparable figure amounts to 10 and 11, respectively (Table A1, appendix). Taken together, our results show that one marital union is the most frequent relationship pattern across all countries, but they also point to substantial country variation in union dissolution and re-partnering.
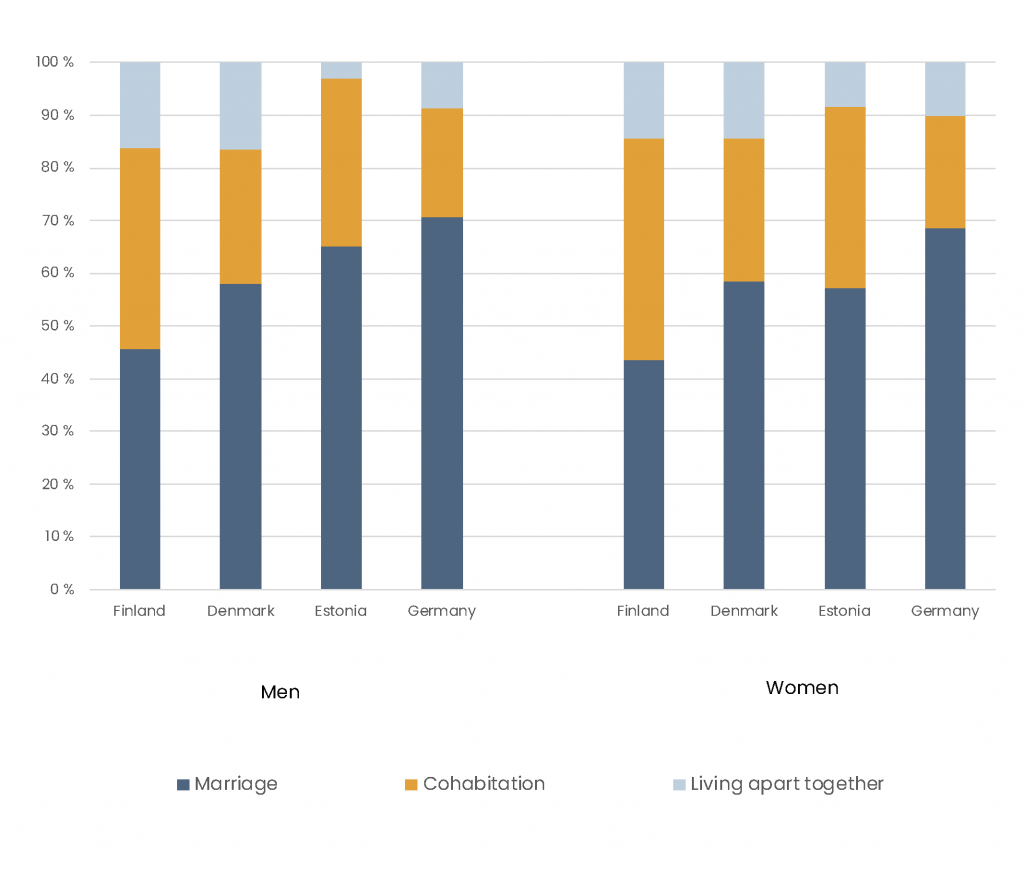
Notes: Data from SHARELIFE, retrospective questionnaire; The total population refers to those who have formed a new relationship after their first marital union. If respondents have multiple “new partnerships”, the most recent one is chosen.
Next, we focus on parenthood. The average number of own biological or adopted children in the sample is 2.1, but the figure varies between 1.7 in Greece to 3 in Ireland. Childless individuals amount to some 11 percent of the sample. Most children, approximately 92 percent, are born in the first marital union, and only a small proportion of childbirths occur in higher order marriages or cohabitation; a pattern consistent across the diverse policy contexts. For instance, in Finland, where cohabitation is more common, approximately 90 percent of childbirths take place in the first marital union, while cohabitation and higher order marriages make up for 4 percent each. As Kohli et al.
(2005) note, the sharp decline in fertility, which is often discussed in conjunction with the second demographic transition, is not visible in terms of childlessness among the ageing population. Correspondingly, the increasing complexities in partnership constellations, documented in, for example, the Scandinavian countries, did not shape how men and women in the ageing population entered parenthood.²
² SHARE also asks respondents with offspring how far away their children live, how frequently they stay in touch, and whether they have children on their own (grandchildren). Unfortunately, these variables were not included for Finland in the current release of wave 7. SHARE will update the data and release a new version in spring 2021, which entails the information mentioned above.
Family relations in Finland
While the previous section compared Finland with other European countries, we now scrutinize family patterns in the Finnish ageing population in greater detail. Figure 3.5.5 depicts how the relationship status evolves with age for men and women born between 1930–1949 and 1950–1967.
We observe the birth cohorts of 1930–1949 from their 20th birthday until the age of 75 and those born between 1950 and 1967 until their 60th birthday. Figure 3.5.5 points to differences in the timing, occurrence, and type of union formation across both birth cohorts and genders. By the end of their 20s, most men, over 70 percent, of the older cohorts are married. Non-residential relationships or cohabitation occurring at this age are overwhelmingly with one’s (first) marital spouse. In contrast, men born in the 1950s and 1960s are more likely to remain unmarried throughout their 20s and early 30s. For these cohorts, cohabitation is increasingly popular both as a living arrangement with one’s spouse prior to marriage and as a relationship form on its own. This shift towards a later timing of marriage is also visible among women, although overall, women tend to marry earlier than men. Unsurprisingly, women born in the 1930s and 1940s are more likely to experience widowhood than their male counterparts.
Both men and women in the older cohorts largely remain married to their first spouse. Yet gender differences in union dissolutions are more pronounced in this group. Most divorcees are women, whereas the ‘male advantage’ in remarriage grows with age. Similar gender-specific patterns are not visible among those born in the 1950s and 1960s. First, the share of men and women who marry, and remain married to their first spouse, is lower. For instance, at their 50th birthday, approximately 62 percent of men and 60 percent of women are married to their first spouse, compared to 78 percent and 76 percent among the older cohorts. Second, the decline in marriage seems to coincide with a rise of cohabitation, which among both genders exceeds remarriage. Finally, gender differences in divorce are unsubstantial among younger cohorts. Taken together, the patterns for Finland highlight that complexities in partnership dynamics are more pronounced for younger birth cohorts (see also Van Winkle, 2018).
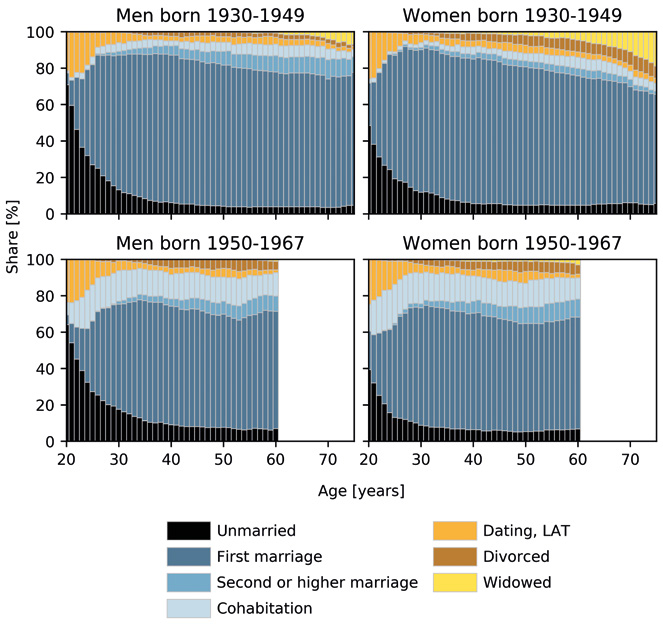
Family dynamics vary, however, by socio-economic position (see Figure 3.5.6). Union formation among men follows an educational gradient in that highly educated men are more likely to be married than medium- or low-educated men. Correspondingly, low educated men are more likely to remain unmarried. Among women, the starkest difference is the incidence of widowhood, which unsurprisingly is more common among low-educated women. Thus, as shown in previous studies on Finland (Jalovaara & Fasang, 2020), partnership formation among men is selective in that those with fewer opportunities in the labor market are also more likely to face loneliness. Given the association between social support and health outcomes, partnership formation, or the lack thereof, could exacerbate disadvantage among older male adults.
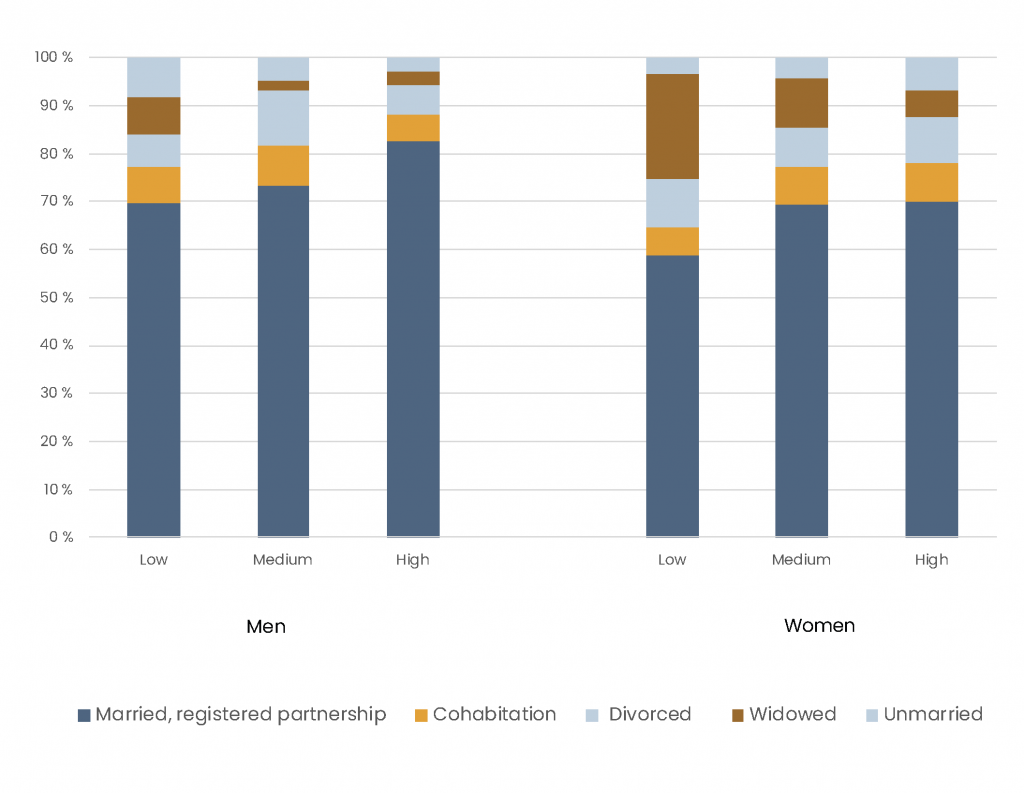
Note: Data from SHARE, panel questionnaire
The results also point to some variation in the number of children by educational level among women (see Table A2, appendix). In specific, highly-educated women are less likely to have three or more children than low-educated women. The negative association between education and the number of children is often explained by the higher opportunity costs of children among tertiary-educated women, whose investments in productivity, and consequently labor market opportunities, are higher (see, e.g., Hook & Paek, 2020). Yet recent research highlights that these patterns for women differ over time, as childlessness among younger cohorts is particularly pronounced for the low-educated (see, e.g., Jalovaara et al., 2020). Finally, it is worth noting that the share of childless individuals in the sample is somewhat lower than in analyses based on register data (Jalovaara et al., 2020), suggesting that parents are overrepresented in the SHARE data.
Relationship quality in Finland
The pencil and paper (drop-off) questionnaire, specific to Finland, allows researchers to examine the quality of relationships among older adults (see also Chapter 2 in this volume).³ For instance, respondents were asked on a scale from 1 to 4 whether they felt respected by their partner or satisfied with the amount of physical closeness. Overall, the respondents reported high levels of satisfaction with their current relationship. Some 61 percent of women and 55 percent of men strongly agree with the statement “I feel that we love each other”. In terms of physical closeness, the share of respondents expressing the strongest degree of satisfaction only amounts to 35 percent; yet the proportion of men and women who are dissatisfied is marginal. Correspondingly, only very few respondents consider ending the relationship. Gender differences in the assessment of relationship quality are small. As many older Finns consider their romantic relationships to be of high quality, partnerships seem to provide a solid basis for a good quality of life.
³ Some 78 percent of the Finnish SHARE sample, i.e. 1,558 respondents, participated in the pencil and paper questionnaire. Respondents were asked to answer questions on relationships if they had a partner, defined as marriage, cohabitation, and dating. Thus, many respondents are couples and live in the same household. This might induce a positive assessment of relationship quality.
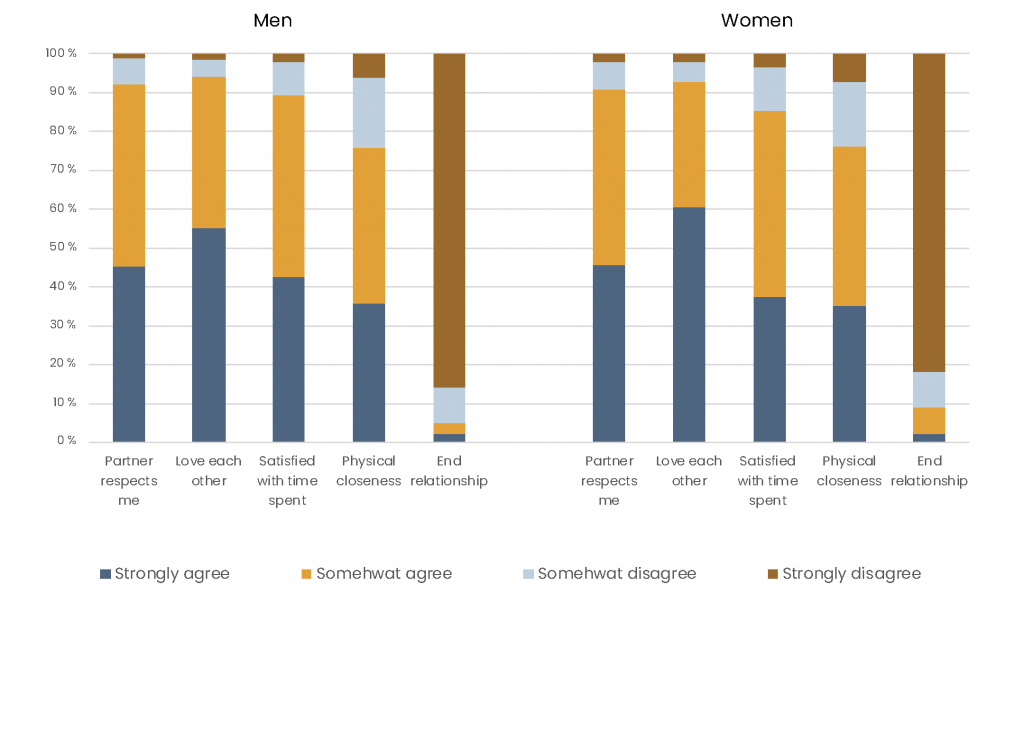
Notes: Data from SHARE, pencil and paper questionnaire; The bars refer to the following statements “I feel that my partner respects me”, “I feel that we love each other”, “I am satisfied with the way we spend time together”, “I am satisfied with the amount of physical closeness between us”, “I have recently considered divorce or ending the relationship”
Conclusions
SHARE provides an exciting opportunity to examine partnership dynamics of the ageing population throughout the life course and to relate relationship trajectories to their socio-political context. This chapter pointed to similarities as well as differences in family dynamics across countries. For instance, while most child births took place in the first marital union, countries differed in the extent to which men and women divorced and formed new partnerships. The Nordic countries, followed by the conservative ones, seemed to display more complex family trajectories, with a substantial share of older adults living in and entering new relationships. However, we still know little about who, and under which conditions, re-marries, cohabitates or dates in later adulthood, and to which extent ‘new relationships’ at old age contribute to health, well-being, and social support. Closely related, SHARE enables researcher to examine how changes in partnership status affects relations to other family members, such as children or grandchildren, and whether such effects differ across countries. Thus, SHARE will continue to contribute to our understanding of how social relations, well-being, and support interact among older adults. This information is crucial for building sustainable social structures in ageing Europe.
References
Albertini, M., & Kohli, M. (2017). Childlessness and intergenerational transfers in later life. In: M. Kreyenfeld & D. Konietzka (Eds.), Childlessness in Europe: Contexts, causes, and consequences (pp. 351-368). Springer International Publishing. https://doi.org/10.1007/978-3-319-44667-7_17
Andersson, G., Thomson, E., & Duntava, A. (2017). Life-table representations of family dynamics in the 21st century. Demographic Research, 37, 1081-1230. https://doi.org/10.4054/DemRes.2017.37.35
AWOC (2015). Ageing without children survey results 2015. Retrieved from awoc.org/survey-findings/ on December 4, 2020.
Brown, S.L., & Lin, I.F. (2012). The gray divorce revolution: Rising divorce among middle-aged and older adults, 1990-2010, The Journals of Gerontology: Series B, 67, 731-741. https://doi.org/10.1093/geronb/gbs089
Brown, S.L., & Wright, M.R. (2017). Marriage, cohabitation, and divorce in later life. Innovation in Aging, 1, 1-11. https://doi.org/10.1093/geroni/igx015
Brown S.L., Lin, I.F., Hammersmith, A., & Wright, M.R. (2018). Later life marital dissolution and repartnership status: A national portrait. The Journals of Gerontology: Series B, 73, 1032-1042.
Brown, S.L., Lin, I.F., Hammersmith, A., & Wright, M.R. (2019). Repartnering following gray divorce: The roles of resources and constraints for women and men. Demography, 56, 503-523. https://doi.org/10.1007/s13524-018-0752-x
Carr, D., & Springer, K. (2010). Advances in families and health research in the 21st century. Journal of Marriage and Family, 72, 743-761. https://doi.org/10.1111/j.1741-3737.2010.00728.x
Connidis, I.A., Borell, K., & Karlsson, S.G. (2017). Ambivalence and living apart together in later life: A critical research proposal. Journal of Marriage and Family, 79, 1404-1418. https://doi.org/10.1111/jomf.12417
Danielsbacka, M., Tanskanen, A., Hämäläinen, H., Pelkonen, I., Haavio-Mannila, E., Rotkirch, A., Karisto, A., & Roos, J.P. (2013). Sukupolvien vuorovaikutus. Auttaminen ja yhteydenpito suurten ikäluokkien ja heidän lastensa elämässä [Intergenerational interaction. Helping and communicating in the lives of baby boomers and their children]. Väestöntutkimuslaitos Tutkimuksia D 58. Helsinki: Väestöliitto.
Dykstra, P.A. (2009). Childless old age. In: P. Uhlenberg (Ed.), International handbook of population aging (pp.671-690). Dordrecht: Springer. https://doi.org/10.1007/978-1-4020-8356-3_30
Esping-Andersen, G. (1990). The three worlds of welfare capitalism. Bristol: Polity Press.
Gierveld, J. (2004). Remarriage, unmarried cohabitation, living apart together: Partner relationships following bereavement or divorce. Journal of Marriage and Family, 66, 236-243. https://doi.org/10.1111/j.0022-2445.2004.00017.x
Haataja, A. (2004). Pohjoismaiset vanhempainvapaat kahden lasta hoitavan vanhemman tukena [Nordic parental leave in support of parents caring for two children]. JANUS, 12, 24-48.
Hook, J.L., & Paek, E. (2020). National family policies and mothers’ employment: How earnings inequality shapes policy effects across and within countries. American Sociological Review, 85, 381-416. https://doi.org/10.1177/0003122420922505
Jalovaara, M., & Fasang, A. (2020). Family life courses, gender, and mid-life earnings. European Sociological Review, 36, 159-178. https://doi.org/10.1093/esr/jcz057
Jalovaara, M., Neyer, G., Andersson, G., Dahlberg, J., Dommermuth, L., Fallesen, P., & Lappegård, T. (2019). Education, gender and cohort fertility in the Nordic countries. European Journal of Population, 35, 563-586. https://doi.org/10.1007/s10680-018-9492-2
Jalovaara, M., Andersson, L., & Miettinen, A. (2020). Parity disparity: Educational differences in Nordic fertility across parities and number of reproductive partners. INVEST working paper 12. Retrieved from osf.io/preprints/socarxiv/sjdt6/ on December 4, 2020. https://doi.org/10.31235/osf.io/sjdt6
Karisto, A. (2007). Finnish baby boomers and the emergence of the third age. International Journal of Ageing and Later Life, 2, 91-108. https://doi.org/10.3384/ijal.1652-8670.072291
Kinsella, K., & Phillips, D. R. (2005). Global aging: The challenge of success. Population Bulletin, 60, 1-42.
Kohli, M., Künemund, H., & Lüdicke, J. (2005). Family structure, proximity and contact. In: A. Börsch-Supan, A. Brugiavini, H. Jürgens, J. Mackenbach, J. Siegrist & G.
Weber (Eds.) Health, Ageing and Retirement in Europe – First results from SHARE (pp. 164-170). Mannheim: Munich Center for the Economics of Aging.
Lesthaeghe, R. (2010). the unfolding story of the Second Demographic Transition. Population and Development Review, 36, 211-251. https://doi.org/10.1111/j.1728-4457.2010.00328.x
Mair, C. (2019). Alternatives to aging alone?: ”Kinlessness” and the importance of friends across european contexts. The Journals of Gerontology: Series B, 74, 1416-1428. https://doi.org/10.1093/geronb/gbz029
Mills, M., Rindfuss, R. R., McDonald, P., & te Velde, E. (2011). Why do people postpone parenthood? Reasons and social policy incentives. Human Reproduction Update, 17, 848-860. https://doi.org/10.1093/humupd/dmr026
Perelli-Harris, B., & Lyons-Amons, M. (2015). Changes in partnership patterns across the life course: An examination of 14 countries in Europe and the United States. Demographic Research, 33, 145-178. https://doi.org/10.4054/DemRes.2015.33.6
Peters, A., & Liefbroer, A. (1997). Beyond marital status: Partner history and well-being in old age. Journal of Marriage and Family, 59, 687-699. https://doi.org/10.2307/353954
Sobotka, T. (2008). Overview chapter 6: The diverse faces of the Second Demographic Transition in Europe. Demographic Research, 19, 171-224. https://doi.org/10.4054/DemRes.2008.19.8
Tanskanen, A., Danielsbacka, M., Coall, D., & Jokela, M. (2019). Transition to grandparenthood and subjective well-being in older Europeans: A within-person investigation using longitudinal data. Evolutionary Psychology, July 2019, 1-12. https://doi.org/10.1177/1474704919875948
Van Winkle, Z. (2018). Family trajectories across time and space: Increasing complexity in family life courses in Europe? Demography, 55, 135-164. https://doi.org/10.1007/s13524-017-0628-5
Verdery, A., Margolis, R., Zhou, Z., Chai, X., & Rittirong, J. (2018). Kinlessness around the world. The Journals of Gerontology: Series B, 74, 1394-1405. https://doi.org/10.1093/geronb/gby138
Wright, M.R. & Brown, S.L. (2017). Psychological well-being among older adults: The role of partnership status. Journal of Marriage and Family, 79, 833-849. https://doi.org/10.1111/jomf.12375
Wong, J.S., & Waite, L.J. (2015). Marriage, social networks, and health at older ages. Journal of Population Ageing, 8, 7-25. https://doi.org/10.1007/s12062-014-9110-y
Appendix
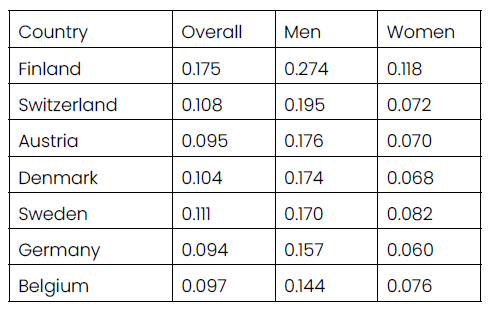
Note: SHARE, panel questionnaire, most recent wave, all age groups
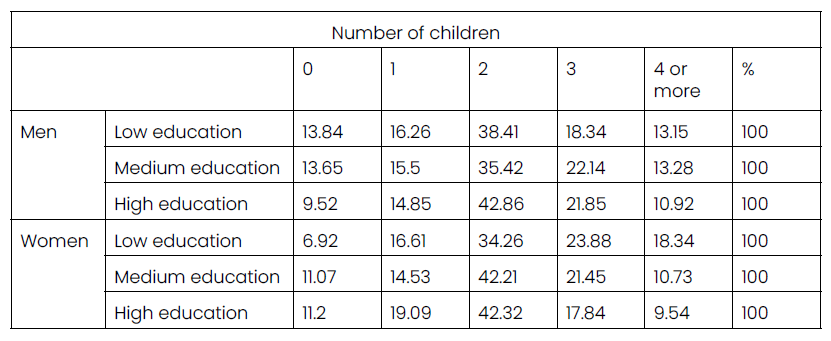
Note: Data from SHARE, retrospective questionnaire
3.6 Housing and geographical differences across the life-course (Mikkola & Hänninen)
Henri Mikkola, Population Research Institute
Juho Hänninen, University of Helsinki
Introduction
The aged population of Europe has lived through times of great economic and social development. Finnish respondents of SHARE were born into a country characterized by a lack of necessities and basic needs. During the second half of the 20th century, Finland was in the process of transforming from an agrarian-heavy economic structure into a service-led economy. The metamorphosis of the society was exceptionally fast; taking place in only three decades, Finland passed the common industrial-heavy phase altogether. The structural change was boosted by a significant growth of GDP, which averaged 4.9% annually from 1946 until the oil crisis hit the economy in 1974. Nevertheless, the annual growth rate stayed at 2.7% for the following decade (Hjerppe, 1989). With economic prosperity came welfare, which manifested in a wide range of developments including health, education, and residential mobility. The peak of urbanization took place in the 1960s and 70s when Finns were moving from agrarian communities to larger cities in tens of thousands per year. This rapid shift from agrarian to urban lifestyle has earned the cohorts born around the middle of the century the nickname “joint generation”, reflecting the age group’s role as the witnesses, and bearers, of change between the agrarian and modern Finland (Fellman, 2019; Karisto, 2005; Mäenpää, 2005). The transformation that took place at the end of the 20th century provides a fruitful background for investigating the life courses of those who experienced this development.
Aged Finns have witnessed a remarkable advance in their years of good life – a recently introduced indicator of well-being (Reiter & Lutz, 2020). One of the many advantages of SHARE is that we can back pedal on the lives of the respondents and identify momentous periods that have had an impact on individuals’ futures. A life course approach can help us understand the multitude of reciprocal processes that shape the outcomes of lives (Elder, 1994). By targeting people from an era of unforeseen growth, we can learn more about what causes some people to fall victim to disruptive outcomes. By comparison, we can identify plausible explanations for certain individuals to prosper and differentiate themselves economically and socially from others.
In this chapter, we examine the geographical movement of aged Finns throughout their life course. Alongside international comparisons, we focus on the differences and determinants that have caused some people to urbanize and others to stay connected to their origins. We begin by concentrating on the age of gaining individual independence in the form of leaving the parental home or establishing an independent residence. We focus on the characteristics of accommodation by looking at homeownership and other more temporary forms of living. After this, we shift to geographical movement and discuss the role of the aged in the massive urbanization of the 1960s and 1970s. Finally, we make a few suggestions for future research from the perspective of the life course approach.
Gaining personal independence
The age of leaving one’s parental home varies persistently across European countries and cultures. There is a fundamental division between the family oriented south and the individualistic north. The choropleth map in Figure 3.6.1 reveals the average age of moving out among SHARE participants by country. The division between Northern Europe and the Mediterranean countries has existed for centuries. David Reher (1998) has addressed the difference by pointing out that historically, young adults in Northern Europe often left their parental home to work as servants in some other household. The servant occupation was not nearly as common in Southern Europe, where families relied more on the help of their offspring. According to census data from a variety of European countries estimates, 50 to 80% of young people in the north worked as a servant at some point in their life, whereas in the south the equivalent share would have been roughly 15 to 30 % (Reher, 1998).
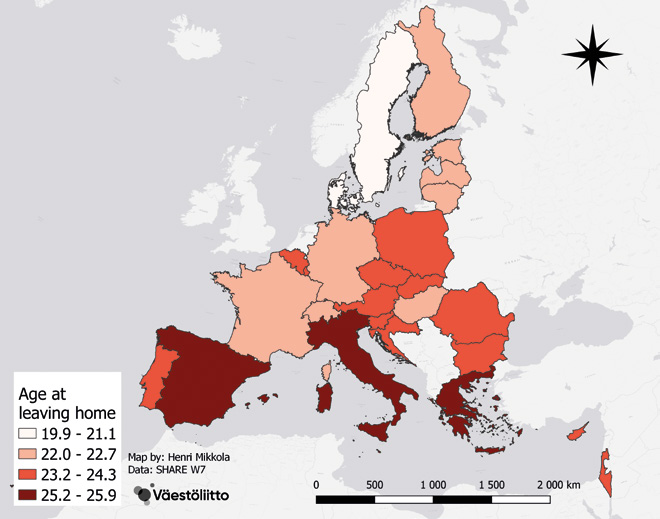
Note: The choropleth maps introduced in this chapter have been created with the QGIS program.
The class division method of the choropleth maps is based on natural breaks, which detects clusters and forms class intervals according to the data. The method is designed to reduce variance within classes and maximize the variance between them (for more, see North, 2009).
The earliest parental home leavers in the SHARE survey were situated in the northern part of Europe. Women have had a tendency to leave home 2–3 years earlier than men. This has been partially explained by age differences in relationships and with the military service, which is mandatory for young men and occurs around the same time as they would typically leave their parental home (Billari & Liefbroer, 2007; Dribe & Stenfors, 2005). According to the SHARE data, the difference in Finland between males and females is reported close to the European average – 2.4 years. The average age of leaving the parental home in Finland has not varied between the residents of urban cities or rural villages.
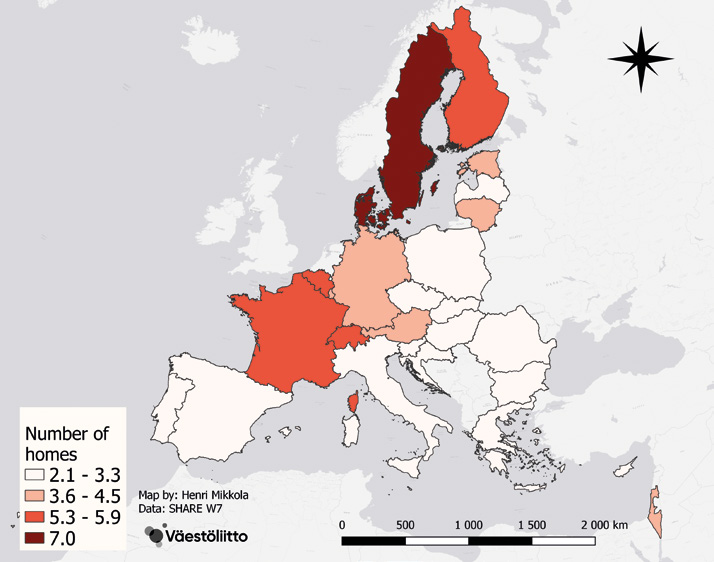
A Nordic oddity? Places of living over the life course
The number of different households across the life course fluctuates across nations and geographical areas. SHARE reveals that the inhabitants of the Nordic countries have lived a rather mobile life compared to their southern counterparts (see Figure 3.6.2). Among SHARE participants, Finland ranks as the third most mobile country with an average of 5.9 moves, with only Denmark and Sweden ahead (with 7.0 moves). The difference is quite substantial compared to the least mobile countries Slovakia, Romania, and Bulgaria, which all have an average of less than 3 residences throughout the life course. The residential mobility difference in Europe is worth considering, since there is an evident division between the north and south. Mobility throughout the life course appears to be related to the age of establishing one’s own household, as the countries where people tend to move out at a young age rank the highest in terms of mobility.
If we focus on Finland and tabulate mobility according to the type of geographical location in which the respondents were born, we find that people originating from ‘suburbs or outskirts of a big city’ have changed residences most often. In Finland, the difference in mobility is not substantial among big cities or smaller towns, but people who are from rural areas or villages have moved notably less often than all other groups (see Figure 3.6.3).
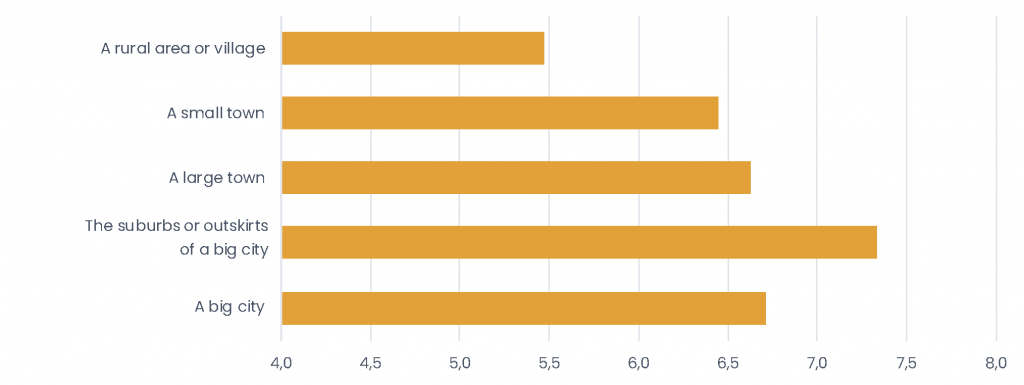
The processes of mobility and individual decisions to switch residences are complex matters. One can approach mobility from a handful of angles, but we should note that not everyone necessarily has the social or economic possibility to change residences as frequently as others. Mobility requires different forms of capital, to which not everyone has access (see, e.g., Black et al., 2010). The agglomeration of economic, political and social resources in cities is a widely known and recognized phenomenon, and we suggest that respondents born in more densely populated areas have had more resources and capabilities to live a more mobile life compared to people originating from rural locations (e.g., Molotoch, 1976). On the other hand, the price of tenancy tends to rise in larger residential areas and the ‘urban lifestyle’ may be more insecure – for example in relation to employment (Motoch, 1976). The urban dwellers of the data have had to move more either because of undesired circumstances or because of free will and the capabilities that came along with their geographical origins.
The data for Finns shows that homeownership at birth correlates with lower mobility during the life course when compared to an individual who is born in a rented household. Assets in the form of an owned residence seem to work as a stabilizer considering mobility. One major determinant for mobility should be the value of owned property. The possibility to change residences varies depending on the assets one gains from selling. Land prices in highly desired cities will cause the value of a poor conditioned small apartment to be an equivalent of a much bigger and better-quality residence almost anywhere else in the country.
Characteristics of accommodation solutions
In SHARE, the respondents describe the type of residences they have lived in throughout their lives. The typical residence type among respondents varies between owned and rented housing. Other types of housing consist of rent-free housing solutions or cooperative memberships. Unlike one could imagine, the residents of wealthier countries do not necessarily have the highest homeownership comparatively. In Sweden and Germany, for example, tenants are relatively common, and the rent market has established a reliable reputation. Countries in Southeastern Europe (see Figures 3.6.4 and 3.6.5), on the other hand, have had persistent challenges in establishing institutions that enable fluent renting, and homeownership has often been considered as the only sustainable housing alternative (Priemus & Mandič, 2000).
The probability to live in an owned household tends to increase with age, although the dynamics in homeownership development throughout the life course varies quite substantially between European countries. In the southeastern part of Europe, the proportion of homeownership has been stable and high throughout the respondents’ lives. In countries like France, Denmark and Belgium, the tendency has been different – people generally lived as tenants earlier in their lives and homeownership became more common as they reached a higher age.
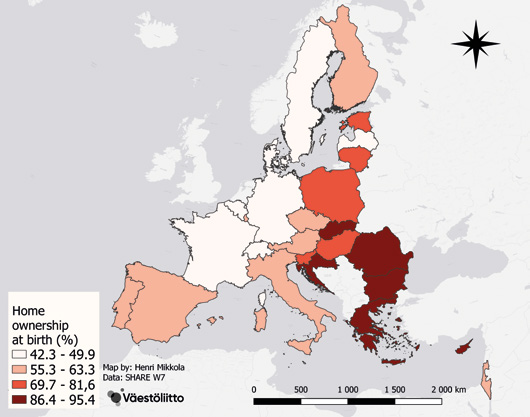
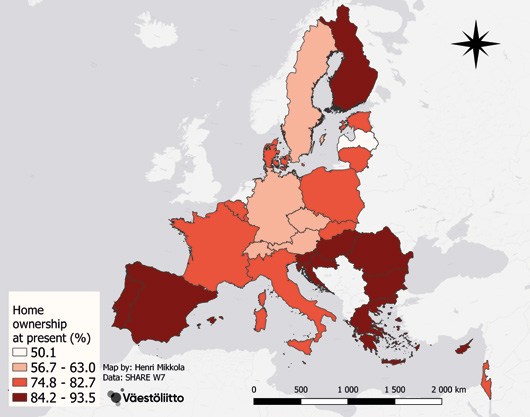
One should note that the respondents of SHARE are not a representative sample of the children from the mid-1900s. The people who have been fortunate enough to stay alive until their 50s and beyond are a somewhat biased sample of the “joint generation”. Therefore, we cannot assume that the housing structure from the birth years of the respondents would indicate the historical averages of rented and owned residences on a national level. Despite this, we can assume some trends of past development with the data at hand.
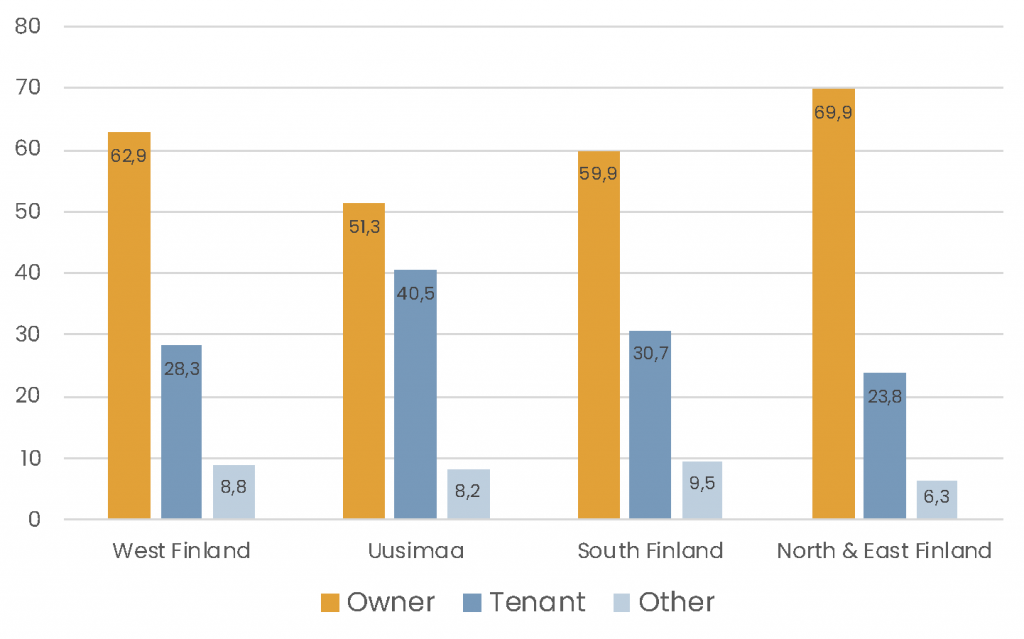
In contemporary Finland, it is common that people start their adulthood as tenants, and as their financial situation develops, homeownership becomes increasingly popular. Owning is more common in rural areas, where land property is inexpensive and owning is more affordable. Figures 3.6.6 and 3.6.7 show the division between residence types among SHARE respondents in Finland at birth and during the time of interview.
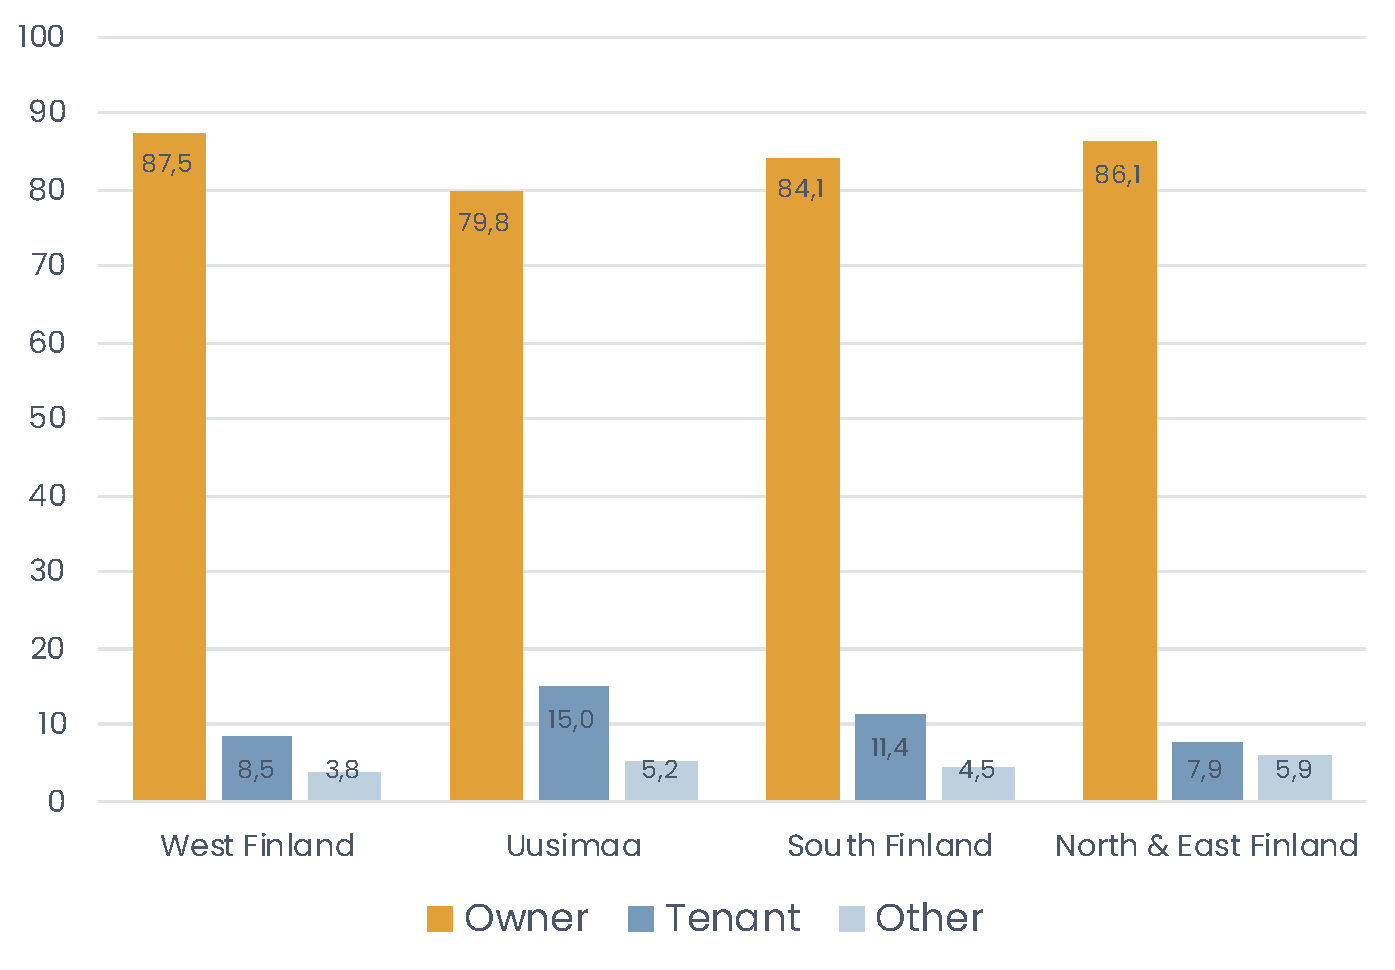
Homeownership has increased during the respondent’s life courses in every geographical area of Finland. The biggest increase in percentage can be seen in Uusimaa, which is the most populated and also the most desired region in all of Finland. We can propose that the geographical birth area has provided an advantage in assets to the residents of Uusimaa. Homeownership has increased across all areas, but the wealth gained through property concentrates disproportionately as urbanization continues to accumulate. According to estimations, 90% of Finland is land area of emigration. The people occupying the emptying villages should expect a diminishing value from their owned property. It is noteworthy that in developed countries real estate forms the largest share of assets for the elderly. As much as 80% of the wealth of households above age 65 is estimated to compose of residential property (Chiuri & Jappelli, 2010). However, Uusimaa remains as the region with the largest pool of tenants (15.0% of all residents), reflecting the persistence of unequal access to capital in urban contexts.
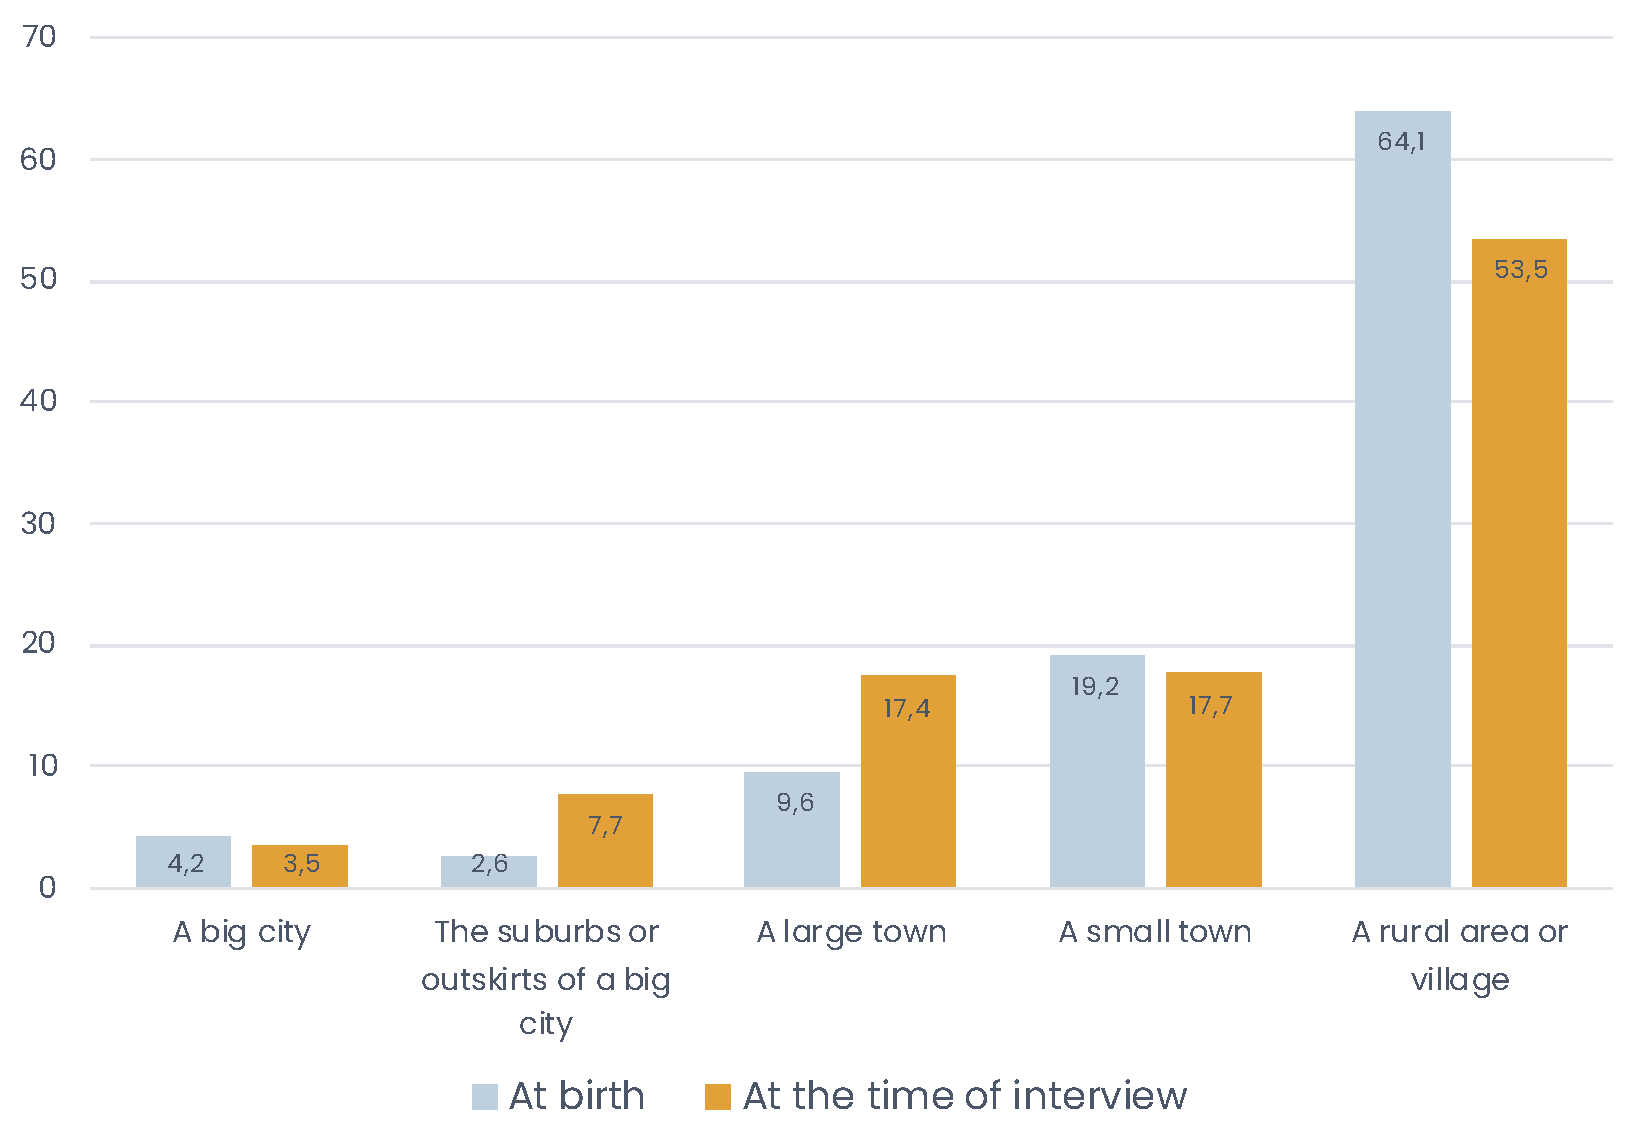
Place of living (urban – rural) at old age
SHARE data for Finland shows that an agricultural background correlates with lower mobility throughout the life course compared with an urban background. There is reason to assume that the younger generations are more mobile than the generations that lived before them. This is because the SHARE respondents – in other words, the aged – are much more likely to live in rural areas compared to the rest of the Finnish population. According to Statistics Finland, the share of Finns living in a rural area or village was less than 30% in 2017, and as urbanization increases, their number continues to decline (Statistics Finland, 2020). The division of respondents by type of residential area (Figure 3.6.8) suggests that the natural renewal of the population will also increase the national urbanization level as years go by. The population dependency ratio has been deteriorating especially in the rural parts of Eastern Finland. A common challenge for many municipalities is that their work force is fleeing the area and the ageing population is staying behind.
In international comparisons, Finland can still be referred to as a fairly agrarian country, at least among the aged population. The younger generations have moved to urbanized areas in search of education and employment in increasing numbers, but the aged have been more reluctant to follow this trend. Staying put can be speculated to correlate with the relatively high homeownership of Finns, as agrarian dwellings tend to be less expensive.
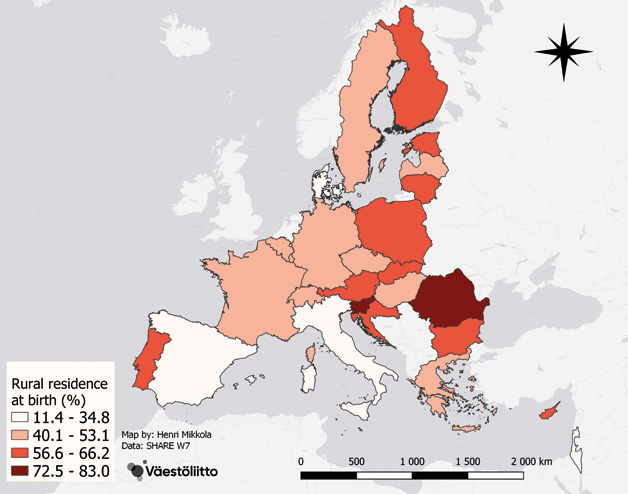
If we look at the data behind Figure 3.6.9 indicating the residential area types by birthplace of the respondents, we see that Finland’s rurality level has been the fourth highest among SHARE participant countries (64%). The division between the west and the east seems clear from the rurality standpoint, although a small and historically centrally located Israel stands alone as a country with very few people living in rural areas (11.4%). Even though most SHARE respondents have participated in the urban movement, there are a few countries whose aged population has moved towards rural areas during their lifespan. The respondents of Switzerland and France have stayed agrarian and appear to enjoy their rural way of life (see Figure 3.6.10).
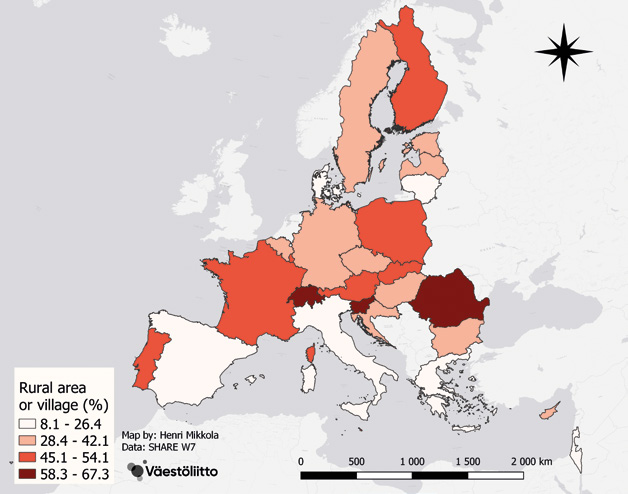
Urban development and population accumulation have been ongoing trends for the past 50 years. If we look at the proportions of native inhabitants by geographical area, we should be able to identify areas that serve as a destination for newcomers and, on the other hand, areas that do not attract very many outsiders. According to SHARE, the national region with the least native aged residents in Finland is Helsinki-Uusimaa with 47%. More than half of the respondents of Helsinki-Uusimaa have moved there from their birth region. Mobility in Finland is orientated towards the capital city and its immediate surroundings (Mäenpää, 2005, p. 14). On the contrary, nearly 80% of the respondents of Northern and Eastern Finland were born in the same region where they currently live.
Prospects for future research
We have examined the SHARE survey data from the perspective of the life course. We illustrated a relationship between the respondents’ form of living early and late in their lives. Furthermore, we have demonstrated how the respondents’ age of leaving home reflects the known division between Northern and Southern Europe. We recognized a geographical trend in the number of moves throughout the life course. The Nordic countries in liaison with France, Belgium and Switzerland can be described as an oddity because of the high number of moves in one’s life. The vast urbanization of Europe is reflected in peoples’ current area of residency. Homeownership was high in Southeastern Europe already at the time of the respondents’ birth and has remained so throughout their lives. Most of the aged population in Europe seem to have undergone a change from rented dwellings to owned housing.
The data allows for a variety of further inquiries and more refined research. As we have information about indicators of well-being and health from the respondents, a relationship between old age well-being and homeownership can be assumed. Questions could be further developed by examining the respondents’ place of living – rural or urban, and how these factors influence the correlations between homeownership and health. In other words, is living in a certain region in a rented or an owned home reflected in general health, and how is the respondents’ place of birth influenced.
It would be intriguing to extend the life course approach to SHARE data, as it allows the definition of significant instances from multiple points in life. The paths from birth to present can be investigated thoroughly by following each move along the process. Family formation or fragmentation tends to relocate people and alter their life path. Employment possibilities relocate people as well, and retirement offers possibilities to move back to the place of origin. The data provides opportunities to explain how different kinds of paths are reflected in overall health at old age. For example, the results drawn from our report gave affirmation to the known relationship between an agrarian background and lower mobility in the life course. From the perspective of health and place of living among the aged, the data allows us to study correlations between birth in agrarian or urban regions, life course agency, and health at old age.
References
Billari, F., & Liefbroer, A. (2007). Should I stay or should I go? The impact of age norms on leaving home. Demography, 44(1), 181-198. https://doi.org/10.1353/dem.2007.0000
Black, R., Kniveton, D., & Schmidt-Verkerk, K. (2010). Migration and climate change: Towards an integrated assessment of sensitivity. Environment and Planning, 43, 431-450. https://doi.org/10.1068/a43154
Chiuri, M., & Jappelli, T. (2010). Do the elderly reduce housing equity? An international comparison. Journal of Population Economics 23, 643-663. https://doi.org/10.1007/s00148-008-0217-4
Dribe, M., & Stenfors, M. (2005). Leaving home in post-war Sweden. Scandinavian Economic History Review, 53(2), 30-49. https://doi.org/10.1080/03585522.2005.10414245
Elder, G. (1994). Time, human agency, and social change: Perspectives on the life course. Social Psychology Quarterly, 57(1), 4-15 https://doi.org/10.2307/2786971
Hjerppe, R. (1989). The Finnish economy 1860-1985: Growth and structural change. Helsinki: Bank of Finland.
Fellman, S. (2019). Miten Suomi muuttui? [How has Finland changed?]. In: J. Laine, S. Fellman, M. Hannikainen, & J. Ojala (Eds.), Vaurastumisen vuodet [Years of prosperity] (pp. 293-303). Helsinki: Gaudeamus.
Karisto, A. (2005). Suuret ikäluokat kuvastimena [The baby boomers as a mirror]. In: A. Karisto (Ed.), Suuret ikäluokat [The baby boomers] (pp. 17-58). Tampere: Gummerus.
Mäenpää, P. (2005). Narkissos kaupungissa: Tutkimus kuluttaja-kaupunkilaisesta ja julkisesta tilasta [Narcissus in the city: A study of consumer-urban and public space]. Helsinki: University of Helsinki.
Molotch, H. (1993). The political economy of growth machines. Journal of urban affairs 15(1), 29-53. https://doi.org/10.1111/j.1467-9906.1993.tb00301.x
North, M. (2009). A Method for Implementing a Statistically Significant Number of Data Classes in the Jenks Algorithm. 2009 Sixth International Conference on Fuzzy Systems and Knowledge Discovery. Tianjin. 35-38. https://doi.org/10.1109/FSKD.2009.319
Priemus, H., & Mandič, S., (2000). Rental housing in Central and Eastern Europe as no man’s land. Journal of Housing and the Built Environment, 15, 205-215. https://doi.org/10.1023/A:1010186618204
Purhonen, S., (2007). Sukupolvien ongelma: tutkielmia sukupolven käsitteestä, sukupolvitietoisuudesta ja suurista ikäluokista [The problem of generations: Studies on the concept of the generation, generational awareness and the baby boomers]. Helsinki: University of Helsinki.
Purhonen S. (2016). Generations on paper: Bourdieu and the critique of ’generationalism’. Social Science Information. 55(1), 94-114. https://doi.org/10.1177/0539018415608967
Reher, D. (1998). Family ties in Western Europe: persistent Contrasts. Population and Development Review. 24(2), 203-234. https://doi.org/10.2307/2807972
Reiter, C., & Lutz, W. (2020). Survival and years of good life in Finland in the very long run. Finnish Yearbook of Population Research. 54, 1-27. https://doi.org/10.23979/fypr.87148
Statistics Finland (2020). Maaseutualueella asuvien osuus, % [Proportion of people living in rural areas, %]. Retrieved from http://pxnet2.stat.fi/PXWeb/pxweb/fi/StatFin/StatFin__vrm__vaerak/statfin_vaerak_pxt_11ra.px/table/tableViewLayout1/ on November 25, 2020.