Sustainable Population Development in Finland
Birth rates have fallen in Finland over the last ten years, and the population is ageing. These developments are challenging the structures of the welfare state, where the shrinking working-age population is supposed to be able to take care of a growing number of older people. How will the pension system and other public finances withstand the change? Could immigration be the solution? And how do we ensure that human and ecological sustainability are not overlooked in the pursuit of economic sustainability?
Väestöliitto’s new population policy report, Sustainable Population Development in Finland, examines the trends currently affecting the population of Finland. In addition to looking at the figures for birth rates, mortality and migration, the report analyzes where the developments stem from and what impact they will have on ecological, human and economic sustainability. Are they good or bad for different aspects of sustainability, and how can we influence them?
The report also presents Väestöliitto’s 10 population policy goals.
Julkaisun tiedot
| Julkaisija | Väestöliitto |
|---|---|
| Kirjoittaja | Tiia Sorsa (ed.) |
| ISBN | 978-952-226-212-7 (PDF) |
| Kustantaja | Väestöliitto, Family Federation of Finland |
| Taitto | Lena Malm |
| Sivumäärä | 232 |
Introduction
Finland’s population is in the middle of a transition. Over the last decade, birth rates have fallen to levels that are low even for Europe. Meanwhile, life expectancy has continued to grow at a steady rate – and as positive an achievement as that is, the country’s economic structures have not yet fully adapted to the situation. Another factor influencing population size is migration, also in a state of upheaval. If it wasn’t apparent before, the record numbers of migrants arriving in 2015 made it clear that international migration and its effects on Finland can be difficult to predict. In the meantime, Finland’s internal migration continues to edge toward the outskirts of its cities. What are the effects of these trends on Finland, and what is behind them? How can Finland adapt to the changes – or does it make more sense to try to influence the trends through policymaking? And what is the impact of these trends on ecological sustainability in Finland and on the planet? This report seeks answers to these questions.
What is population policy?
In his editorial for the Finnish Labor Review (4/2019) last winter, editor-in-chief Heikki Räisänen discussed Finnish population policy. “Western countries have not traditionally pursued population policy that involves setting a specific population target, along with the policy measures that would affect it.” Räisänen points out that many policy measures have consequences for population size. Indeed, nearly every country pursues some kind of de facto population policy, at least in the case of immigration. Any limits on cross-border movement inevitably affect the number of people present in the country at a given time, i.e., its population in a broad sense.
Yet many of us are not exactly sure what population policy really means today. To some, it suggests something old-fashioned, and at worst, authoritarian or cold. Population policy is all too easily conceived of as directives raining down from above onto a population that is their passive target.
When it comes to the birth rate, population policy has often had a particular effect on women, whose opportunities to reproduce or not reproduce have been regulated, sometimes by cruel means. For example, at different times and in different countries, it has been deemed illegal to terminate a pregnancy or to even be pregnant. Gender, marital status, ethnicity, sexual orientation and health may have affected the right to make decisions regarding one’s own reproduction. Abortion continues to be banned in Malta and El Salvador, for example, and China only abandoned its one-child policy a few years ago, as a result of its ageing population.
The Family Federation of Finland views population policy as a wide-ranging whole. It involves discussions, decision-making and actions regarding the values, objectives and methods that relate to the size and structure of the population. Not only public authorities, but also organizations, companies and associations, as well as various other communities engage in population policy activities when they play a role in influencing who lives in Finland and in what types of circumstances. Väestöliitto’s population policy is founded in human rights, and we emphasize in particular reproductive and sexual rights and the importance of close relationships. A population is not comprised merely of isolated individuals, but of human relationships both intimate and distant, and of communities and social structures. Also our relationship to other species, animals and nature can be incorporated into a broader conception of population policy.
Even though population policy as a concept is broad, its core lies in population structure. The population increases with births and immigration, and decreases with mortality and emigration. In addition, population structure is affected by internal migration and regional population density. The traditional metrics used to describe demographics are age, gender and place of residence. In addition to these, a population’s health, functional capacity and education determines the type of population in question. A 70-year-old person who lived in Finland in 1920 is very different from the 70-year-old of today. Similarly, now, one hundred years later, the population of the 1920s differs from our own not only in terms of age and housing structure but also in terms of their characteristics.
A population is often defined as the citizens of a particular country. This definition includes also Finnish citizens living outside the country, who currently number approximately 300,000 according to the Ministry of the Interior. This definition excludes people without citizenship who nevertheless reside in Finland, including undocumented immigrants, and those who live in Finland on a part-time basis for work or family reasons. They have an impact on, among other things, the need for services and on consumption. A comprehensive definition of population takes into account the undocumented and those living in the country part-time. In the program recommendations and in the chapters by experts that follow, there was no need to restrict the definition of ‘population’ – in general, we mean the people who live in Finland permanently, unless stated otherwise.
What is the Population Policy Report?
Väestöliitto has issued previous Population Policy Reports, in 1998 and 2004. It has been sixteen years since the previous report, which described a Finland whose population development looked quite different. The birth rate was still relatively high in a European context, whereas migration was only a third of what it is now. Even then, there was speculation that the birth rate could fall to a low level, like in the rest of Europe – but the dramatic drop that has now occurred was not foreseen. Back then, the target birth rate was set at nearly two children per woman.
The previous Population Policy Report called for more immigration. In terms of migration, there was concern that educated Finns were leaving and staying abroad. At that time, Finland’s positive net migration was approximately 5,000 people per year, which has now grown to 15,000 people per year. Such a sizable increase exceeded even Väestöliitto’s immigration targets from 2004.
This brief comparison to the demographic expectations of the early 2000s is a good illustration of the rapid change in population trends. The change has been even greater when compared to previous decades. For example, when the post-war pension system was built, it was assumed that the new generations would be as large as or larger than the previous ones, and that life expectancy would not increase much. No wonder the system is in need of adaptation.
It is therefore essential that we actively monitor the population situation and update our population policies accordingly. Unless we succeed in anticipating the kind of population we will have in the future, we will make incorrect decisions also in other policy areas. On the other hand, if we find that in order for other policy areas to succeed, they will need a particular type of population base, only an active population policy can secure a solution.
At present, Finland has no explicit population policy goals. How many people make up a suitably sized Finland? How high a birth rate and how much immigration is best? Perhaps more than at present – but how much more? What are the values that underlie this pursuit, and how do we achieve the goal? And how would the methods we choose affect various population groups, the environment and the national economy?
The lack of a holistic view of population policy has led to unanticipated developments in both population size and structure, as well as to rather black-and-white and inflammatory debates concerning individual areas of population policy. As the birth rate falls, some worry about the dependency ratio while others experience anxiety or feel that they are being blamed for it. We need a meaningful conversation about the role of reproduction in modern life and about the impact of children on the future. The debates surrounding the issue of international migration sometimes become so inflamed that people would rather not mention the issue at all. Some who have participated in the debate have had to genuinely fear for their own safety. What we need is a civilized discussion that calmly weighs the facts and considers the various options. In addition, it has been typical of the Finnish population debate to consider demographic development from an exclusively economic standpoint, and to forget that the economy is ultimately only the means to producing well-being. In this report, Väestöliitto proposes that we consider population change holistically, balancing human sustainability, ecological sustainability and economic sustainability.
The report is divided into seven sections. The first section introduces Väestöliitto’s recommendations for themes that should be part of Finland’s population policy right now. These recommendations are followed by the chapters by exerts on five different themes: birth rate and population development, health and ageing, immigration, internal migration in Finland, and sustainable population growth. Some of the chapters address these themes on a general level, while others have a more specific perspective. The chapters’ authors represent the very best expertise in their fields and hail from various organizations in Finland. The report’s conclusions consider the effects of the COVID-19 pandemic, which erupted during the writing of the report, on the themes covered in the report.
Väestöliitto’s Population Policy Goals
Sustainable Population Change in Finland: Väestöliitto’s Population Policy Goals
Our starting point
Väestöliitto supports a population policy that promotes the well-being of the nation, ecological sustainability and global responsibility. A modern and democratic population policy relies on inclusive decision-making, human rights and scientific evidence. In addition to the number, age and sex of those living in the country, demographic changes are also influenced by the education, skills, health status, agency and interpersonal relationships of its citizenry.Väestöliitto’s work is informed by the promotion of hope, happiness and human
rights. Originally established to increase the birth rate and the well-being of families, the organization has now been active for nearly eighty years. Currently, Väestöliitto and its member organizations strive to ensure that everyone has the opportunity to live a life of their own choosing, in relationships that are safe and foster well-being. In development policy, we support the rights of women, girls and young people.
Finland’s population is ageing faster in the 2020s than was expected. This means that there are fewer and fewer children and young people in relation to people who are middle-aged and older. As the share of working-age people declines, the health and vitality of the population increasingly requires that each person’s individual potential and ability to function is supported throughout life.
In the long term, an ageing population will result in a reduced population, unless immigration compensates for the quantitative gap between mortality and birth.
The goal of population policy is to produce the best, most meaningful life possible for all people. It promotes the inclusion and equality of all people, intergenerational solidarity, and the responsibility and resilience of communities and of society as a whole. This requires engaging in a wide-ranging and fact-based debate on the current demographic changes.
We have defined our demographic views into ten goals. Our positions are based on the values that Väestöliitto espouses and on the assessments of the experts who participated in the preparation of Väestöliitto’s Population Policy Programme. Within each goal, we present recommendations and objectives from the standpoint of population size, birth rates, the well-being of diverse families, migration, as well as health and well-being. In connection with the goals, we will refer to the chapters by the experts who illuminate the relevant background in greater detail. Please note, however, that the goals of Väestöliitto are independent of the views of the individual experts, and vice versa.
10 population policy goals for Finland
- A suitably sized Finland is not shrinking yet.
- Balanced population development is ecologically sustainable.
- An increasing birth rate in Finland is something to strive toward.
- People need to be supported in having as many children as they wish for.
- Good relationships are at the core of public health.
- Family-friendliness applies to all.
- Immigration will increase significantly.
- Finland is an attractive and humane new home country.
- Multi-locality regenerates regional development.
- Create incentives to reduce emigration.
The population goals and their explanations
1. A suitably sized Finland is not shrinking yet
As its population ages, the world’s population growth is projected to start declining in the course of this century. Depending on who is predicting, the shift will occur within 40 to 90 years. The trend is a positive one from the standpoint of sustainable development, as even now, the world’s resources are not sufficient to support nearly eight billion people.In 2020,
about 5,530,000 people are living in Finland. Average population density for the whole country as a whole is low, about 16 people per square kilometer. Population growth in the 2000s has averaged 0.3% per year. Since 2016, more people have died than were born in Finland – without immigration, the population would be shrinking. The population growth occurring in municipalities, too, is increasingly fueled by immigration.
If the current population trends continue, population growth will reverse within the next decade. According to the latest population predictions by Statistics Finland, Finland will have over 100,000 fewer inhabitants in 2050 – about 5,420,000 people, if the birth rate and net immigration level of 2019 were to continue. Väestöliitto does not see a possible reduction in the size of the Finnish population in this century as a problem in and of itself. At present, however, it is desirable to have a continued, moderate rate of population growth. An attractive and dynamic society requires densely populated growth centers that offers productive synergies between people and activities.
If the annual population growth were to continue at about 0.3%, Finland would have more than 6 million inhabitants by 2050. In a suitably sized Finland, the financial base of the welfare economy, and thus regional, social and economic sustainability, is easier to secure.
Population goal: A moderate rate of population growth is justified in the coming decades.
2. Balanced population development is ecologically sustainable
The Sustainable Development Goals are the undisputed starting point for population policy in the 2020s. Where little was said about ecological factors in the demographic policy debates of the 2000s, awareness of the link between the climate crisis and biodiversity on the one hand and demographic policy on the other hand has since become clearer. Alongside other policy goals, population goals, too, must be viewed as part of the United Nations Sustainable Development Agenda.
Sustainable development requires a wide range of political, economic and social changes. Economic and social stability and the well-being of the population must be safeguarded in ways that are not dependent on continued economic growth. Some believe that this requires a clear reduction in living standards (see the chapter by Pasi Heikkurinen in this report). Others emphasize that in a welfare economy, living standards and experienced well-being may even increase, for example through the circular economy and renewable energy (see, e.g., https://sustainable-prosperity.eu/). With the acceleration of the technological revolution and increasing global crises, it is impossible to predict which way is more realistic and workable – but the goal remains the same.
Municipalities, companies, organizations and individuals all contribute in various ways toward achieving the goal. However, more significant than changes within Finland’s national borders is having global influence, regarding commitments to reduce global climate emissions, technological innovation and development cooperation.
several decades, Väestöliitto has actively promoted women’s rights as well as global sexual and reproductive rights. These rights form the cornerstone of global population development: supporting women’s education and aspirations regarding family size are among the most effective ways to slow global population growth.
Väestöliitto wants to highlight the interdependence of social and economic sustainability and ecological sustainability. However, the latter is worth striving for only if there is also a commitment to the first two. The climate crisis will only be vanquished within the framework of the welfare economy and social justice, democratically and without exacerbating social inequality.
In a sustainable Finland, energy and industry do not contribute to increasing carbon emissions, and resources are recycled. We learn to live, move, consume and to bring up future generations by reducing our carbon footprints and respecting biodiversity. In this scenario, having children is not threat to the climate, but instead a guarantee of a better future. Child-friendliness is part of a communally and ecologically sustainable Finland. (See the chapter by Taru Kivelä.)
Ecological goal: Finland promotes sustainable economic and population growth – both nationally and internationally.
3. An increasing birth rate in Finland is something to strive toward
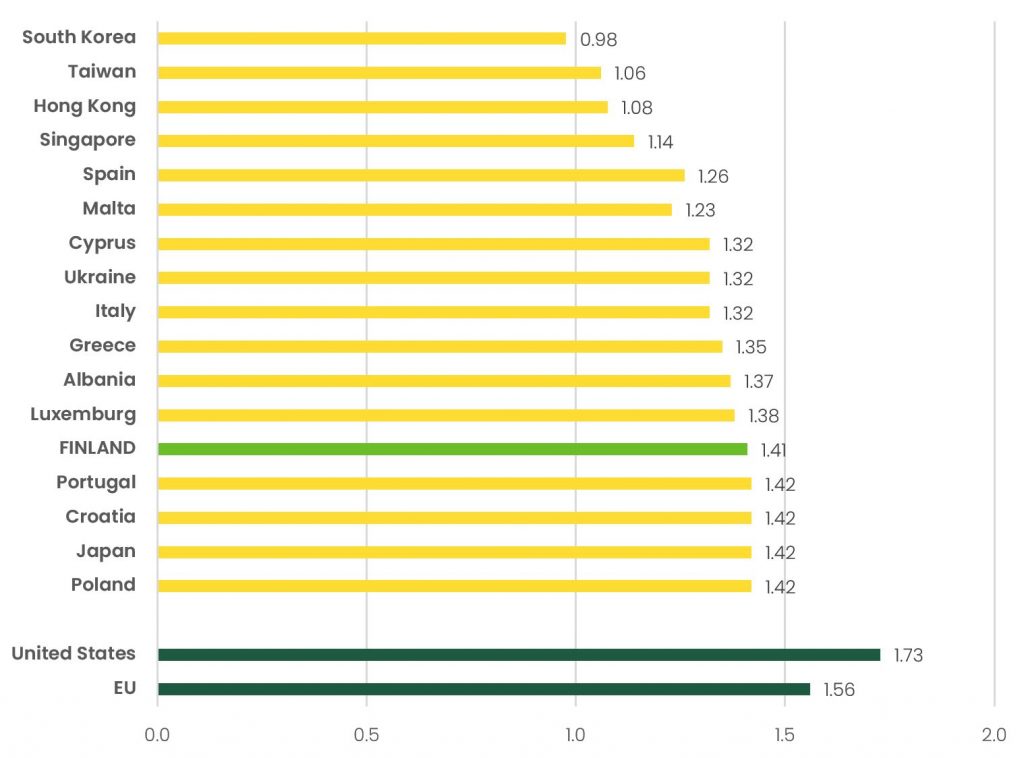
Finland’s birth rate is currently lower than the EU average. Total fertility, which reflects the assumed average number of children a woman would have, calculated per year, was 1.35 in 2019. This is one of the lowest rates in the world. The final mean number of children also seems to be in decline. Over several generations already, Finnish women have had an average of 1.9 children in their lifetime, and in the future the figure may be 0.2–0.3 fewer. (See the chapter by Anna Rotkirch.)
In 2004, Väestöliitto aimed for a total fertility rate of 1.9 children in Finland. The target was achieved in 2010 but the rate has been lower in other years. Although the target of 1.9 children is currently less realistic than earlier in the millennium, we continue to believe that it is both justified and desirable. If young adults were to have the number of children they want, this birth rate would even be surpassed.
A declining birth rate can create a discrepancy between public revenues and expenditures. If the birth rate remains low, the sustainability gap in public finances could increase by almost a whole percentage point. The impact would be especially challenging for our pension system. Väestöliitto’s view is that stopping the decline in the birth rate while ensuring ecological sustainability is not mutually exclusive – it is possible to promote both while maintaining a balance between the two.
The challenge to the pension system posed by the demographic developments of the 2010s would have been largely solved had birth rates risen back to the levels at which they had been at the beginning of the millennium, i.e., total fertility of about 1.8–1.9 children.
Although no one has children to benefit the gross domestic product, Väestöliitto believes that we should emphasize the importance of the contribution made to the nation’s economy by all the people who are involved in raising children. These diverse caretakers include the children’s parents, grandparents, siblings and guardians, as well as other relatives, friends and everyone else who is involved in caring for, educating and nurturing the children’s health. The support provided by grandparents and other loved ones is one of the most important forms of support for families with children.
For countries with a low birth rate, including Finland, a rising birth rate is something to strive for: children are our future.
Birth rate goal: For both social and economic sustainability, increasing the annual total fertility rate in Finland to 1.9 children would be desirable.
4. People need to be supportedin having as many children as they wish for
On average, the number of children that people in Finland would like to have is about two. The actual number of children they end up having, however, is lower. The difference between ideal and actual number of children is largely due to the fact that the proportion of childless young adults in Finland is higher than in other countries. Firstborns are born to increasingly older parents, which also contributes to lowered chances of having the desired number of children. (See the chapter by Anna Rotkirch.)
Sexual and reproductive rights are a key aspect of basic human rights. We support the opportunity for every young adult to have their desired number of children to the extent that it is medically advisable.
Reproduction is neither an obligation nor a right: we do not procure children, we have them – they come to us. Not having children is also an acceptable choice. The right to family planning is a human right. Modern family planning includes both contraceptive education and the availability of contraceptive methods, as well as being supported in the decision-making that goes into the choice to have a child and to become a parent. In a time of lower birth rates and delayed parenthood, we need to find new ways of supporting the life choices concerning childbearing and reproduction. Young people and adults should be able to receive customized psychological and medical support for making these, the most important decisions of their lives. Support and fertility counseling are needed in various life situations, and in different relationships and types of families. The opportunities to build a family while studying must be developed and support provided to students who are also parents. For parents considering a second or third child, and for low-income families, the upcoming family leave reform, as well as family policy benefits and their adequate levels, are key factors.
It is Väestöliitto’s view that each young adult should have the opportunity to attempt to have their ideal number of children and receive support in this pursuit. Family planning can help people have the number of children they want to have. Our goals regarding the ideal number of children include reducing the difference between the desired and actual number of children and ensuring that more people are able to take the risk of forming a family earlier in life. We must evaluate legislative barriers and review reproductive and sexual health-related resources in terms of family planning services and fertility counseling, fertility treatments, and the livelihood and well-being of families with children. We must ensure that legislation protects the family ties of every type of family.
The goal for the number of children: To reduce the difference between the ideal and actual number of children.
5. Good relationships are at the core of public health
In both health and mortality, Finland has succeeded in reducing the disparities between different segments of the population. Nevertheless, notable differences remain when measured by income and education, and by region and sex. (See the chapter by Suvi Parikka et al.)
There are many ways of promoting the health of the population. Finland has successfully developed tax-based fiscal measures for addressing policies related to alcohol, tobacco, physical activity and nutrition, and has invested in equality in educational and employment opportunities. The welfare economy also includes human relationships, which have a significant impact on our health and well-being. We are increasingly aware of the harm caused by loneliness and discrimination over a person’s lifetime.
Our closest social networks affect both our ability to function and our need for services. Friends and relatives provide help, support, information and advice at various life stages. Research has shown that being part of a couple has an especially strong effect on well-being throughout life for both women and men. As we age, the importance of children and relatives for our well-being becomes even more emphasized. This can further exacerbate the inequality affecting those without close family ties.
As the birth rate has declined, the size of households has shrunk. Loneliness has been growing throughout the last three decades. (See the chapter by Emma Terämä.) At the same time, digitalization and everyday technologies have shaped our ways of creating and maintaining close relationships. These new media can both increase and reduce the relationships that are so important for our well-being. (See Väestöliitto’s Digital Wellbeing in Families project.) In the future, the development of digital well-being will be an important part of health, population and family policy.
Väestöliitto would like to stress that as the population ages, supporting close, meaningful relationships will become ever more important. Inequality can also be manifested in how well someone’s social networks are functioning: certain regions and individuals already have close networks, whereas others require support and services to build working relationships.
Well-being goal: For each person in Finland to have at least one close relationship.
6. Family-friendliness applies to all
In a country with a low birth rate, there is the danger that children and families with children will come to be viewed as strange, or that children and other population groups will not encounter one another. Family-friendliness is a way for the workplace and the community to convey that raising children is important for all of society. However, family-friendliness is not limited to young children. By reconciling work with other areas of life, we are also by extension supporting care work, a sense of community and general well-being.
We must work to promote inclusivity in services for families and ensure the acceptance of all types of families as equals in society, regardless of their number of children, characteristics or circumstances, or sexual orientation or gender. This helps increase the birth rate and fosters a positive image of family life in society.
A key reason behind the falling birth rate is the assumption held by young adults that their work and leisure activities would suffer if they were to have a child. In reality, most parents of families with children succeed quite well in Finland when it comes to balancing work and family life. Nevertheless, half of all parents encounter some work-related factor that significantly complicates how they are able to balance work and family life. (See Väestöliitto’s Family Barometer 2020.) This is another reason for why it is so important to encourage family-friendliness. We need different types of examples, for different families and stages of life, of the ways in which it is possible to combine parenthood and work.
Väestöliitto proposes adopting flexible work hours (“flextime”) and remote work as part of the new normal, to the extent that the given work tasks permit. There must be zero tolerance for pregnancy discrimination. Currently, about one in ten fathers and slightly more mothers feel that they have had to miss out on a career advancement opportunity because of their children. We challenge employers to communicate to their employees that having a family will not impede anyone’s career advancement.
Finland can be even more child-friendly – a country where intergenerational solidarity is a reality regardless of the family that you are presently part of.
Family-friendliness goal: In a family-friendly Finland, forming a family is seen as both natural and positive for every employee.
7. Immigration will increase significantly
Increased globalization and immigration to prosperous nations represent a major demographic and cultural transformation. These developments are not without problems, and we need require openness, courage and adaptation to successfully manage them.
Racism and ethnic discrimination must be combated resolutely. During the 2000s, Finland’s cultural, linguistic and religious diversity have increased, which has enriched the country but has also given rise to certain societal tensions. Proportionately, Finland still has fewer immigrants than the other Nordic countries, with young adults and men as the main population groups to have immigrated here.
In the new demographic situation affecting Finland, more immigration is needed than ever before. (See the chapter by Mauri Kotamäki.) As early as 2004, Väestöliitto came forward to emphasize that a society with an ageing population needs both a relatively high birth rate as well as increased immigration. The latter goal was achieved, and the number of immigrants moving to Finland has since tripled. During the last decade, Finland’s net migration was about 15,000 people per year, i.e., a total increase of more than 150,000 people – a number that exceeds the population of Jyväskylä. (See the chapter by Timo Aro.)
Väestöliitto highlights the need for intentional global recruitment, so that we can secure workforce for the health, social and services sectors, and stimulate production, entrepreneurship and innovation. Our labor market policy must be active and flexible. We must lower the thresholds, especially for the highly educated and the immigrants who are studying at Finnish universities. We need to explore how to streamline the immigration process for the kinds of immigrants our society needs especially. The process of obtaining a residence permit must be significantly faster. (See the chapter by Mauri Kotamäki.)
Finnish employers need to become better at recognizing and valuing the abilities of employees from different backgrounds, and they need to promote nondiscrimination. The integration services for immigrants with a refugee background should be made more efficient, so that these immigrants do not have to depend on subsidies for extended periods of time and would find employment more easily. And when someone manages to land a job or is accepted as a student during their asylum application process, they should be able to obtain a residence permit, even if the asylum-based permit is refused. (See the chapter by Minna Säävälä.)
Finland must also increase the number of quota refugees. Quota refugees are brought in from refugee camps, making it possible to offer help to those who need it the most. Doubling the quota is justified also by the fact that the number of refugees worldwide has approximately doubled over the last ten years. Only 15% of the world’s refugees have ended up in affluent countries.
Migration gain goals: Väestöliitto believes that Finland needs to gain more migration than it currently does – we must double the current migration gain and accept double the number of quota refugees.
8. Finland is an attractive and humane new home country
The most common reason for immigrating to Finland in the 2000s has been connected to family. Most immigrants have arrived because of a spouse or relative who was already living in the country. In recent years, employment-based migration has reached similar levels. In addition to ensuring the immigrants’ integration, Finland must do more to adapt itself to the newly arrived, better than it does presently. Those who come from elsewhere should not be viewed merely as instruments – workers to benefit the economy – but as individuals with their human needs.
A basic human need as well as human right is the opportunity to live with one’s family. Nonetheless, Finland has imposed limits on the possibilities for family reunification during the 2010s, a development that Väestöliitto has opposed.
Finland is already in competition for the most highly desired immigrants. Being a globally competitive, open and welcoming welfare society, and being family-friendly, give us an advantage. We cannot change our geographic location or the amount of daylight we have in winter, but we can provide a safe living environment.
The services and benefits for families and the family-friendly work culture that Finland already offers can be even more of a positive resource. An immigrant who lives here without their family will not become fully engaged in Finnish society and can easily move away.
Our immigrant integration services must be developed to better incorporate language learning and employment. An immigrant who is in the process of integrating must not be penalized for finding a job by depriving them of the right to free language instruction. Access to free language training for work-based immigrants needs to be strengthened. As the experts in this report suggest, fostering a culture of excellence and experimentation would be an outstanding way to improve Finland as a new home country. (See the chapter by Mauri Kotamäki.)
Väestöliitto believes that immigrants’ family members should also be welcomed here, and that the integration of spouses is an essential part of family integration. An integrated individual has found their place in society and is treated as its equal member. Integration requires strengthening the receptiveness of society in legislation, services and everyday interactions. We are all part of integrating others – as we ourselves also become integrated – in a Finland that is ever-more diverse. If we are to succeed in positively integrating those with an immigrant background, the process of adjusting must be a mutual one. (See the chapter by Minna Säävälä.)
Immigration goal: We welcome the family members of immigrants, because family is the most important thing for every person, regardless of their country of origin.
9. Multilocality regenerates regional development
Low population density will be one of the biggest challenges that Finland will face in the coming decades. Internal migration has accelerated in the 2000s, exacerbating already existing regional disparities. As the population ages, we need new solutions that enable municipalities to perform their tasks and responsibilities.
Internal migration is expanding the number of people who live in Uusimaa, Pirkanmaa and Southwest Finland. Elsewhere, the population is declining or would have declined were it not for global migration. The decline in the birth rate has worsened the situation, as the number of children is distributed unevenly between different municipalities. Health, well-being and ability to function are also linked to the region in which one lives: for example, in the eastern and northern parts of Finland, premature death continues to be more common than in the western and southern parts. (See the chapter by Suvi Parikka et al.)
Today, more than 70% of Finns live in cities or peri-urban areas. Especially Finns under the age of 30 are moving to cities, in particular the more highly educated. This means that the already strong, vibrant regions are strengthened further while others are weakened. The so-called “Järvenpää phenomenon” describes the increasing density of urban structures and the relocation of people to the proximity of good transportation connections and services. (See the chapter by Timo Aro.)
So far, technological development has not slowed down the rate of urbanization. On the contrary, it appears that the importance of the physical location where work is done has not been lost. The digital leap cannot completely replace face-to-face interaction or the allure of high population density. Also, not all types of work can be done remotely.
The COVID-19 crisis has highlighted the multilocality of how people work and live. It offers a new perspective on regional development. In multilocality, an increasing number of people moves regularly between one place and another, either in their daily lives or in the course of the year. One’s living arrangements and where one studies, works and vacations can occur and be present in different regions, even in different countries. Indeed, multilocality often refers to transnational way of life regarding where one lives, one’s family ties and one’s movements.
Multilocality can therefore partially temper the adverse effects of migration flows. Multilocality and job mobility make it possible to start a family or to have a large family, through access to more affordable and more spacious housing.
Väestöliitto’s stance is that regional policy must advance the multilocality and diversity in work and living arrangements. We need new ways, tailored to the needs and characteristics of different areas, to develop smaller growth areas.
Regional goal: The transformation of work, as well as digitalization, promote regional multilocality.
10. Create incentives to reduce emigration
Global mobility that is spurred by employment, studies or starting a family is, in many ways, a welcome phenomenon that can help improve Finland’s knowhow. At the same time, the country will suffer from a brain drain if the people who live here now decide to move away permanently. Emigration is not desirable when it is the result of applying a stick rather than a carrot – because it is not possible to envision a job or a future for oneself or one’s family in this country. We can make a concerted effort to work against and alleviate this harmful phenomenon.
Earlier in the millennium, at the time of our previous Population Policy Programme, fewer than 15,000 people were leaving Finland annually. Their number has since grown and is approaching 20,000 people per year. Today, more Finnish citizens are moving away than are returning. Multilocality is global and international, and it challenges the established notions regarding citizenship and population boundaries. As an example, everyone who has ever worked in Finland will receive a Finnish employment pension.
Finland should compile all of the incentives that could be used to prevent people from emigrating or to encourage them to return, without interfering with the desirable aspects of global mobility. Experience and training gained abroad should be easily applied and converted into the criteria and salary system used in Finland. In trying to prevent immigrants from emigrating, offering sufficient opportunities for Finnish or Swedish studies is a key factor. Here, too, entirely new policy instruments could be taken under consideration. For example, would it be possible to make a concerted effort to persuade working-age people who have already accrued a Finnish employment pension to return to work in Finland?
Emigration goal: Fewer people leave Finland simply because they could not find a job or a place to study, either for themselves or their family.
The declining birth rate and the changing childbearing landscape (Anna Rotkirch)
Summary
- The decline in Finland’s birth rate in the 2010s is part of the demographic changes experienced by other prosperous countries, but the drop here is exceptionally sharp.
- In the future, the share of individuals with no children will grow and the share of large families will decrease. Birth rates will vary by region and social status: those with the greatest resources will have more children than others.
- According to the Family Barometers, reasons for the declining birth rate include prolonged youth, the experience of insecurity and the expected costs of “good parenthood”.
- In this new landscape, we need new and diverse methods to support people’s desires for having children.
Birth rates have been falling in Finland for more than one hundred years. The decline in the number of children is in many ways the product of economic prosperity, freedom of choice, reproductive rights and a family-friendly welfare state. Finnish children are now more often born as wanted and welcomed, and they receive a great deal of attention and care from their parents (Miettinen & Rotkirch, 2012). The decline in the birth rate must be seen as part of a global demographic trend of ageing populations and contracting demographic structures, with Finland now at the top of the trend.
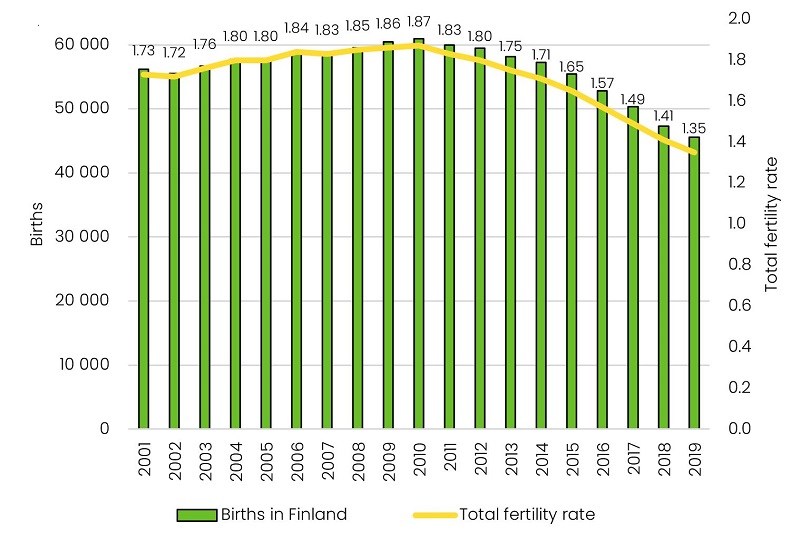
Total fertility in Finland increased slightly in the beginning of the century and decreased between 2010 and 2019 (Figure 1). Since 2011, total fertility in Finland has been below the EU average (the EU birth rate also fell to 1.55 in 2018). Finland’s total fertility rate in 2019 was 1.35. This is the lowest figure in the history of the measurement in both Finland and the Nordic countries. According to preliminary data from Statistics Finland, the birth rate has risen during 2020, i.e., it may be that with the new decade, the bottom of the wave in the birth rate has been passed for now. The decline was not only long-lasting but also surprisingly comprehensive: birth rates fell in the 2010s across all populations and across the country. Ostrobothnia has long had the highest birth rate in Finland and the youngest first-time mothers (Statistics Finland, 2018; SVT, 2020).
Figure 1. Number of births and total fertility rate in Finland, 2000–2019.
Source: Statistics Finland and Väestöliitto.
Finnish women born after the Second World War have had an average of about 1.9 children. That figure, in other words, is higher than the total fertility of certain individual years. In low-birth countries, the variation in annual total fertility rates is often sharp and it is therefore difficult to draw conclusions about long-term trends (Sobotka, 2017). If one generation of women postpones childbearing to a later age, total fertility could theoretically decline without the final number of children per woman declining.
Mikko Myrskylä’s research team has now assessed the cohort fertility of Finnish women of childbearing age, i.e., how many children they will eventually have in their lifetime. It seems that women of childbearing age will have far fewer children in their lifetime compared to previous generations. The projected final number of children for Finnish women who are currently 30 years old would be less than 1.6 children (Hellstrand et al., 2020).
It is therefore not only a matter of women postponing childbirth until a later age, but of having fewer children overall. The current postponement of childbirth has been going on for so long that many women will never end up “catching up” to the number of children had by previous generations of women. Thus, cohort fertility is likely to decline markedly for the first time in thirty years.
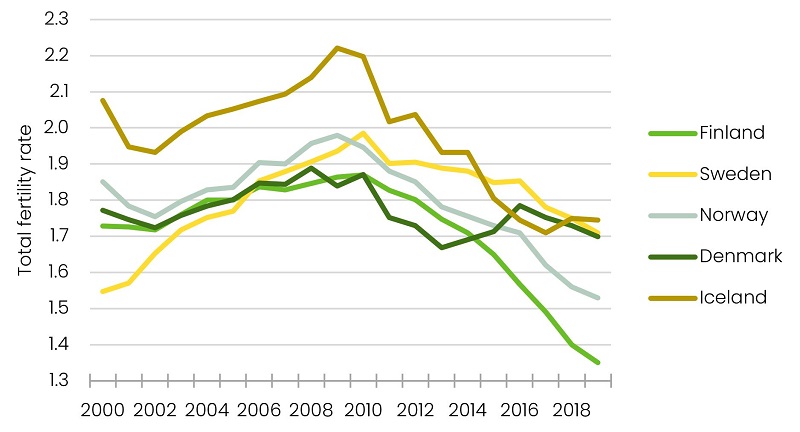
Figure 2. Total fertility rate in the Nordic countries, 2000–2019.
Source: National statistics offices and Väestöliitto.
International trends and Finland
Although the decline in Finland’s birth rate in recent years has been surprisingly long and sharp, it is not entirely exceptional. In the other Nordic countries, too, total fertility has declined since the upturn in births early in the millennium (Figure 2). In Norway, total fertility has fallen to around 1.5 children, and the shape of the decline is nearly as steep as it is in Finland. However, Norway’s overall fertility was clearly higher than in Finland before the decline started. Total fertility has also declined in recent years in other affluent Western countries, including countries with relatively high birth rates, such as the United States, United Kingdom and France. At the same time, the birth rate has not declined or has even improved in previously low-birthrate countries, such as Estonia and Germany (Figure 3).
With the decline in the birth rate in the 2010s, Finland is now one of the countries with the lowest total fertility in the world (Figure 4).
Figure 3. Total fertility rate in selected European countries, 2006–2018.
Source: Eurostat and Väestöliitto. 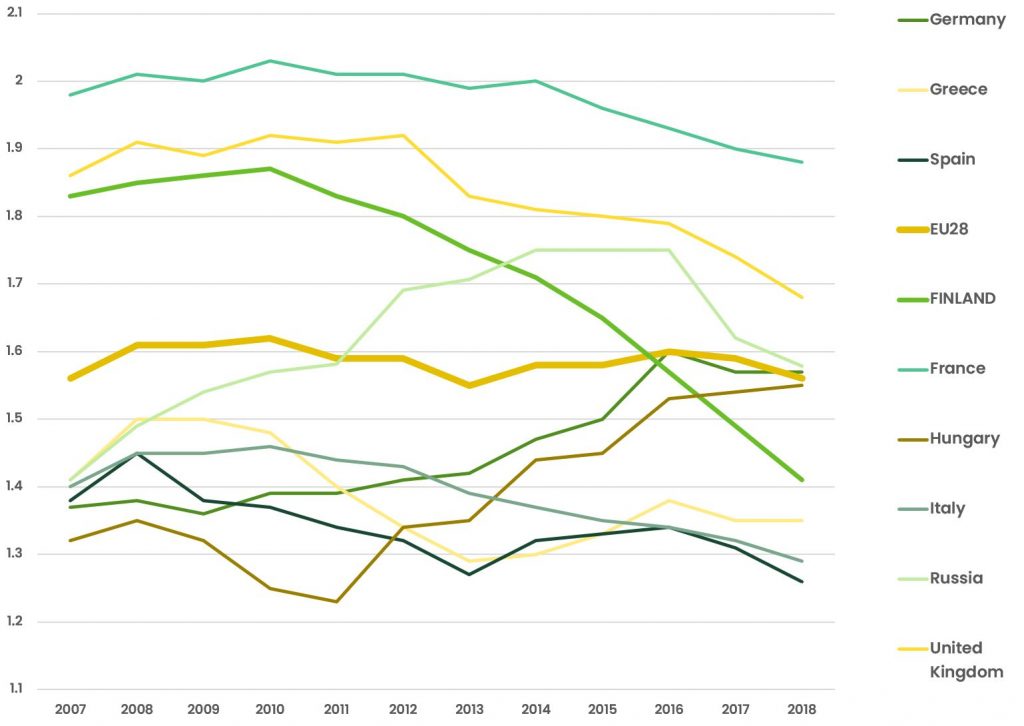
Figure 4. Countries with the lowest total fertility rate in 2018, and the EU and United States.
Sources: Tomas Sobotka, Eurostat (2020), Human Fertility Database (2020), Yoo & Sobotka (2018), and national statistics offices.
Why is the birth rate falling?
In part, the falling birth rate in the 2010s is caused by recent factors. For a long time, factors such as employment and lack of a spouse had a stronger impact on the birth rate. Now, there are indications that economic uncertainty and confidence in the future are more important factors than previously, alongside other more “traditional” factors (Comolli, 2017). As one research article termed it, we have to look “beyond the economic gaze” (Comolli et al., 2019).
In Finland one still often hears the phrase, “people make children in a recession”. However, this is not the case in general. During the economic downturns of recent decades, Europeans have delayed having children as they wait for better days (Sobotka, 2017). Globally, Finland represents an exception in that its birth rate rose during the 1990s economic recession. But even during the 1990s recession in Finland, fewer firstborns were born as young adults postponed starting a family. The proportion of second and third children increased, however, bringing up the total birth rate. The probable cause for the growth in Finland’s birth rate in the 1990s lay in the generous family leave and childcare reforms of the late 1980s and during the 1990s (Vikat, 2002; Comolli, 2018 and 2019). Figure 5 shows the development in the number of children since the situation in the early 1990s.
Unlike during the 1990s recession, the decline in the Finnish birth rate that began with the economic crisis of the 2010s is not connected only to having a first child. As Figure 5 illustrates, the number of firstborns now is lower than early in the previous recession, in 1991. After 2011, the proportion of second and third children has also decreased compared to previous years, so that in 2018 and 2019, the number of second and third children,
too, was relatively lower than in 1991. The number of fourth children also declined in the 2010s, but more of them are still born relative to the early 1990s.
Figure 5. The age-standardized intensity figures for having a first, second, third and fourth child in Finland 1987– 2019 (1991 = 100).
Source: Statistics Finland and Väestöliitto Mikkola; Rotkirch et al. 2017.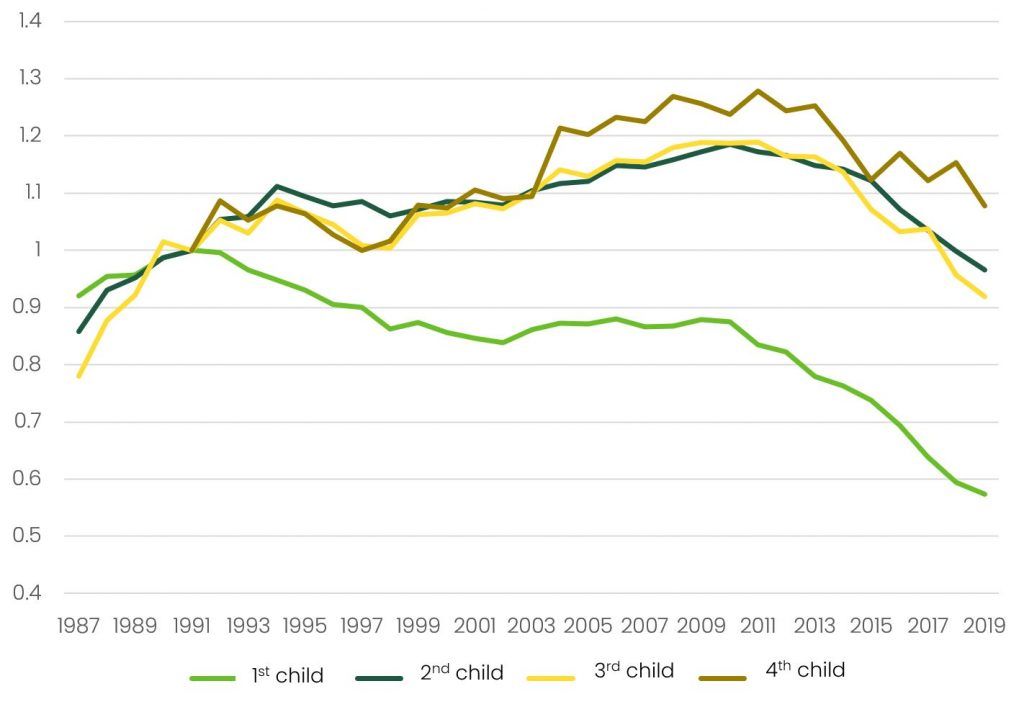
Rising age of first-time parenthood
The decline in the birth rate during the 2010s occurred across all age groups (with the exception of women over age 40). The age of first-time parents is often connected to the number of children: the later that people have children in a society on average, the lower the average number of children and the higher the proportion of people with no children (Miettinen et al., 2015). In 2019, the average age of first-time mothers was 29.6 years nationwide; the highest number of children are born to women aged 30–34 (Statistics Finland, 2020).
In terms of the total birth rate, the decrease in firstborns is most significant (Roustaei et al., 2019; cf. Figure 5). In the age group of 25–29 in particular, the number of firstborns declined regardless of the women’s education or region of residence. Crucially, fertility among 30- to 39-year-olds also declined in the 2010s. In this, Finland deviates from most other Western countries, where the decline is occurring particularly in the below-30 age groups.
The age of first-time parenthood varies by social class. On average, less educated people have children earlier than those with higher education. Parents’ industry and place of residence are also connected to when they start a family. The age of first-time parenthood in cities is higher than in rural areas; entrepreneurs, farmers and midwives have children earlier than those in other occupations.
According to Väestöliitto’s Family Barometer, those with the least education have children somewhat earlier than they would consider the ideal age for becoming a parent. The more highly educated have their firstborns later than they would consider ideal (Rotkirch et al., 2017).
The age of first-time parenthood is related to health risks to both mother and child. Numerous medical studies have found an association between older mothers and pregnancy and complications of childbirth, and the health of the baby (see, e.g., Schmidt et al., 2012; Klemetti et al., 2018). The effects of age on the health of the child and mother vary according to several health indicators, including for example whether or not the child is a woman’s first. The ageing of men can also affect the health of the child, both at the fetal stage and during childhood, and throughout life (see Chapter 6, Rotkirch et al., 2017; Schmidt et al., 2012).
Difficulties becoming pregnant and the need for fertility treatments, and their share of the birth rate, can be expected to increase in the future. The likelihood of fertility treatments being successful decreases as women age. On average, older women require more treatments to become pregnant compared to younger women, and even after multiple treatments, they do not become pregnant at the rate of younger women. Fertility treatments are helping more and more people have their ideal number of children. However, they also involve health risks for both the woman receiving the treatment and for the child, including ectopic pregnancy, miscarriage, and low birth weight and premature birth (Klemetti, 2006).
Although the age of first-time parenthood is rising in Finland, people’s knowledge regarding the effects of age on fertility is still lacking. In a representative survey conducted in 2015, almost one in two men and one in five women had poor knowledge about the effect of age on female fertility. Respondents believed that fertility only declined after a woman turned 40 or could not say at all at what age the decline occurred. Nearly 45% of young men were poorly informed of the effects of age on fertility, compared to 21% of women. Knowledge about fertility was particularly poor among 20–24-year-olds, men and the low-skilled (Rotkirch et al., 2017; cf. School Health Survey, 2015).
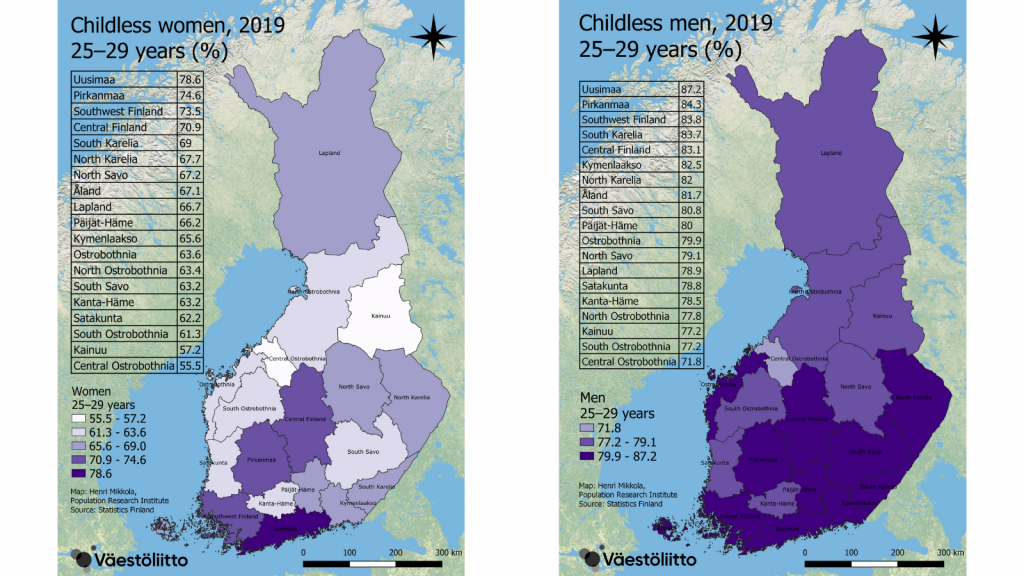
Figure 6a. The share of childless persons by sex and region, 25–29-year-old women (left) and men (right) in 2019.
Changes in the number of children
Until now, fertility in Finland has been unevenly distributed: a substantial share of people have had no children at all, and a large proportion have had at least three. For a long time, Finland has had the highest share of childless people in Europe (Miettinen et al., 2015).
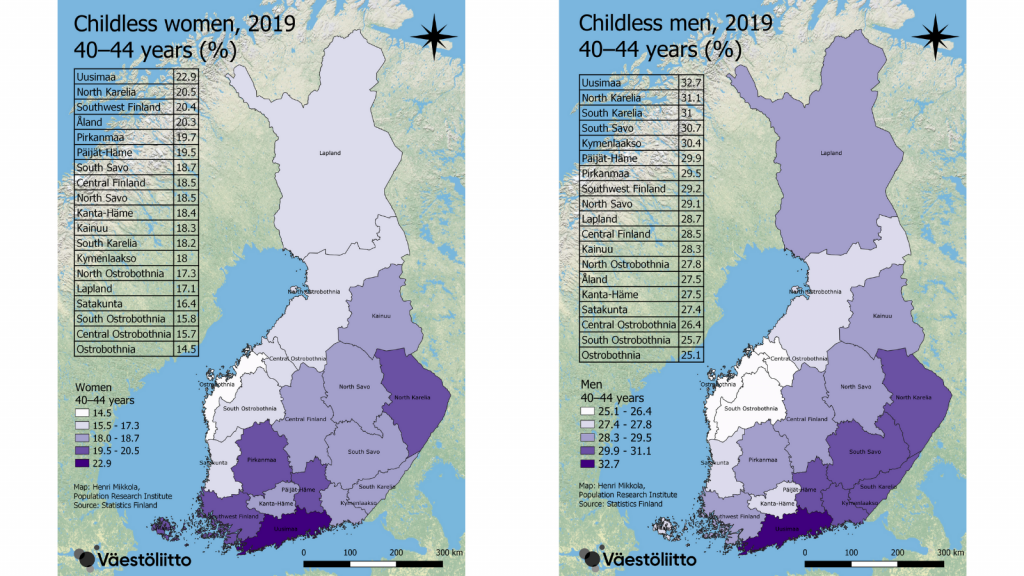
Throughout Finland’s history, the number of people who have no children has been relatively high, and their share of the population continues to grow. Regional differences are significant in this context as well. Figures 6a and 6b illustrate how the share of childless individuals (those without a biological child born alive) varies by age across the country. Among Finns aged 25–29, 78% have no child of their own. The share of childless men in Uusimaa is 87%, and in Central Ostrobothnia, only one in four men has a child. Nearly every other woman of the same age in Central Ostrobothnia has given birth, but in Southwest Finland, Pirkanmaa and Uusimaa, only about one in four has given birth (Figure 6a). In 2019, one in four Finns aged 40–44 and one in five women had no biological child. The share of women without children in the same age group has been lower in the other Nordic countries, less than 15% (Rotkirch, 2017; Jalovaara et al., 2017). As for the share of childless men, it varies from about one in four in Ostrobothnia, Central Ostrobothnia and South Ostrobothnia to one in three in Uusimaa (Figure 6b). In addition to the growth centers, the share of men without children is also high in North and South Karelia, South Savo and Kymenlaakso; fewer women of the same age have not had a biological child. The shares range from 15% in the most fertile regions to 23% in Uusimaa.
It is a particular Finnish characteristic that the highest proportions of women without children fall to women with the highest education and the least education. For men, in Finland and most other countries, the number of children is positively correlated with levels of education and income (Barthold, Myrskylä & Jones, 2012. For Finland, see Nisén et al., 2014; Rotkirch & Miettinen, 2017; Jalovaara & Fasang, 2017).
Finland also has relatively many large families, i.e., women who have given birth to at least three children. Nearly 10% of women have had four or more children, a European record in recent years (Eurostat, 2020). In the other Nordic countries, the share of both childless individuals and those with large families is lower, and families with two children are correspondingly more common. This difference is essential to note when thinking about, for example, applying Swedish family policies to the case of Finland. With declining fertility, we can anticipate a future where the ranks of people who have no children will keep growing. More than one in five women and one in four men is likely to remain childless. Also likely is that Finland will have fewer large families in the future.
Figure 6b. The share of childless persons by sex and region, 40–44-year-old women (left) and men (right) in 2019.
The changing childbearing landscape
Financial distress and male unemployment have been cited as reasons for the declining birth rate (see also Hetemäki, 2019). It is true that a weak economic situation is an important obstacle to men starting a family both in Finland and elsewhere (Barthold, Myrskylä & Jones, 2012). But the employment rate alone cannot explain the changes in birth rate during the 2010s, either globally or in Finland. First of all, Finland’s birth rate has fallen more sharply since 2010 than could have been predicted on the basis of economic or youth employment indicators (Matysiak, Vignoli & Sobotka, 2018). Secondly, the economic situation in Finland began to improve substantially in 2016, with unemployment beginning to decline and GDP to climb. If the economic crisis that began in 2008 had been the main reason in Finland, more children should have been born during 2017 at the latest. In the Nordic countries and other affluent western countries, including France, Belgium, the UK and Netherlands, the decline in total fertility by age group for 20–35-year-olds has continued since the economic crisis that began in 2008. The change in these countries and age groups has been even steeper in 2012–2016 compared to 2008–2012 (Miettinen, 2018).
Recent micro-level analyses of the link between unemployment and childbirth in Finland also show that, for example, the birth rate in Helsinki and Vantaa has continued to fall even after the employment rate for young adult men has improved (Mäki, 2019). Alongside the employment rate, the economic reasons for the falling birth rate must therefore be sought elsewhere as well. Today, for example, housing prices in growth centers have a stronger connection to the birth rate than employment rates do (Dettling & Kearney, 2014).
Apart from economic reasons, the role of cultural expectations and perceived uncertainty in shaping childbearing plans among young adults seems more significant than previously. This is why we here at Väestöliitto have been talking for a long time about the changed landscape of childbearing behavior (Rotkirch et al., 2017; Rotkirch, 2020). In Väestöliitto’s 2018 population survey, we asked young adults to explain, among other things, why they felt that it was not the right time to have children or why they had no plans to have any children. Factor analysis showed that the reasons that people gave were primarily connected to two factors: uncertainty and lifestyle. A wide range of reasons were related to insecurity, including financial situation, work situation, studies in progress, insufficient societal support and the smallness of their current home. The insecurity was also associated with social insecurity, such as challenges in arranging childcare, difficulties balancing work and family, and uncertainty regarding one’s career, and one’s own ability and the ability of one’s relationship to cope. The lifestyle reasons were clearer: the respondent did not want to give up their current lifestyle, did not feel ready to be a parent, children were not topical in the current relationship, or the respondent did not want to commit to young children (manuscript by Savelieva, Jokela & Rotkirch).
People are having fewer children than they would desire
Since the 1950s, people in Finland have hoped to have two to three children, on average; previously, the ideal number of children was among the highest in Europe (Goldstein et al., 2003; Testa, 2012). The hopes and intentions regarding having children have now changed. Yet Finns are still not having as many children as they would like. If they did have as many children as they say they want, our birth rate would be significantly higher.
Studies have distinguished between desired, intended and actual number of children. These correlate with each other, but in such a way that in affluent nations, people’s desired (or ideal) number of children is usually higher than their intended number of children. In addition, the actual number of children is lower than the intended number of children. The journey from desire to fulfillment is long: depending on the reviewed time period, only about one in two people manages to have a child as planned. Thus, 61% of the Europeans who planned to have a child within three years succeeded in their intention (Harknett & Hartnett, 2014). Similar results have been obtained from Finland: within two years, 44% of people who had planned to have children had fulfilled their intention (Lainiala, 2012). Many are also uncertain regarding the number of children they would want. Only five percent of female Finnish university students did not intend to have children at all in the future; a much larger proportion, almost a third, were uncertain whether they would or not (Nipuli et al., 2013). Correspondingly, eight percent of male students did not intend to have children and more than a third were undecided (see also Kunttu et al., 2017).
Representative surveys conducted by Väestöliitto in 2015 and 2018 sought to find out the desired number of children. In today’s Finland, the ideal number of children seems to be slightly less than two (Miettinen, 2015, 23; Berg, 2018). This is especially due to the fact that more Finns aged 20–59 do not want children at all: 12–15% of respondents reported zero as their ideal number of children.
A family with two children has remained the most popular wish among Finns; just under half of young adults (45%) wish this. The share of Finns who wish to have only one child has remained nearly constant from one survey to another, at about 10%. The share of those who consider at least three children the ideal has decreased from 40% to 30% (Miettinen, 2015; Rotkirch et al., 2017; Berg, 2018). Since intended childbirth does not always come true, whereas the intention to have no children usually does, changes in what is perceived as the ideal number of children predict a lowered final number of children for these generations.
Socioeconomic polarization of the birth rate
In the current century, there are indications in Finland, as well as in the other Nordic countries, of socioeconomic polarization in birth rates. According to calculations by Statistics Finland (2018), total fertility is higher among highly educated versus less educated women and men. This appears to be a new trend, where the proportion of those without children has increased in the Nordic countries especially among resource-poor populations (Jalovaara et al., 2017). Particularly among men, childlessness is highest among those with at most primary education or no recorded education. This same correlation between education and lack of children occurs in several other countries, though not usually as markedly.
Finland shows signs of socioeconomic polarization in the birth rate: those who are male, low-income or live in cities are less likely than others to want children.
Also the ideals and intentions regarding having children are linked to socioeconomic status. Voluntarily having no children is more prevalent in certain population groups: men, those with a lower income and city residents were more likely to report not wanting to have any children at all. The intention to have children was also connected to education, employment situation and income (Figure 7).
Figure 7. Intention to have a 1st or 2nd child, according to income
Source: Family Barometer Survey 2018, Väestöliitto Berg.
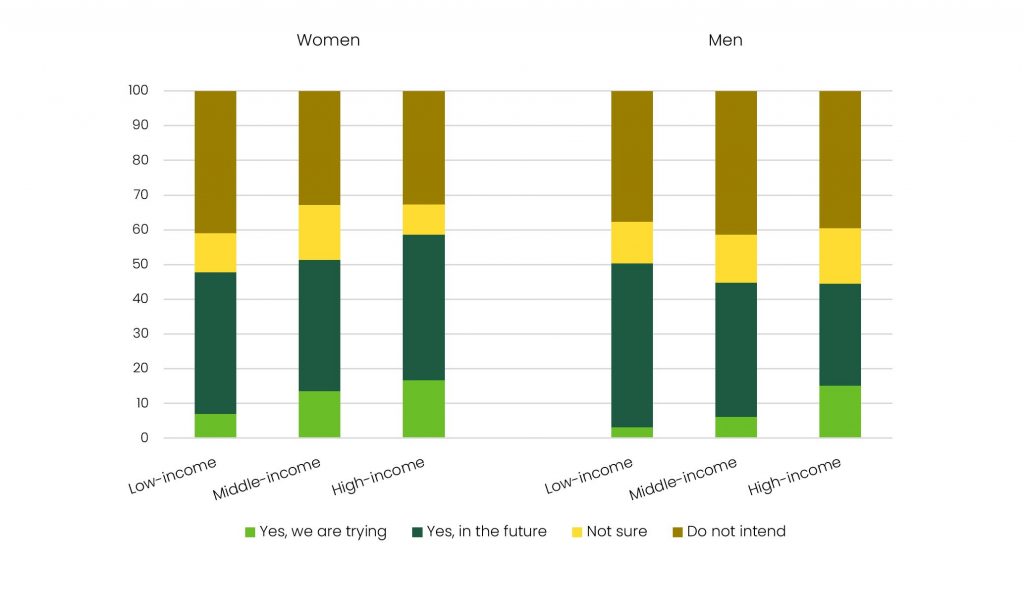 Among both men and women, those who are currently trying to have a child are more likely to be well-off: employed, with a better income, more educated, and among women, more likely to be in a high socioeconomic position (Berg, 2018). Being prosperous is not only about economics, but also happiness and a sense of hope: international research shows that life satisfaction is a predictor of procreation in low-birth rate countries around the world (Mencarini et al., 2018).
For Finnish women, not having a child or being uncertain of whether to have any is connected to having fewer resources, including unemployment, low level of education and lower income. This is in line with previous research regarding couples, where a woman’s own income and employment is more strongly connected to having children than her spouse’s situation (Jalovaara & Miettinen, 2013). By contrast, for Finnish men, not having a child or being uncertain whether to have any is not connected to education or unemployment but to higher socioeconomic status and income level. The sex differences with regard to the intention to have children are major: in the Helsinki metropolitan region, 62% of men have no plans to have children or cannot say whether they will; for women, the corresponding figure is 45%.
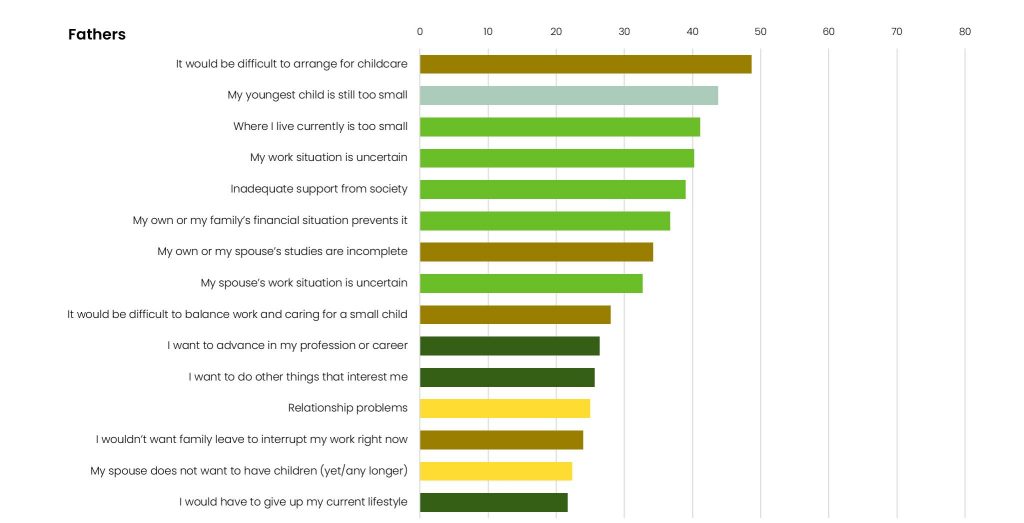
Figure 8. Why doesn’t having a child seem topical? Childless persons under 40 years of age, according to whom the below reasons have affected their decision significantly or somewhat, % (N = 429)
Source: Family Barometer Survey 2018, Väestöliitto Berg
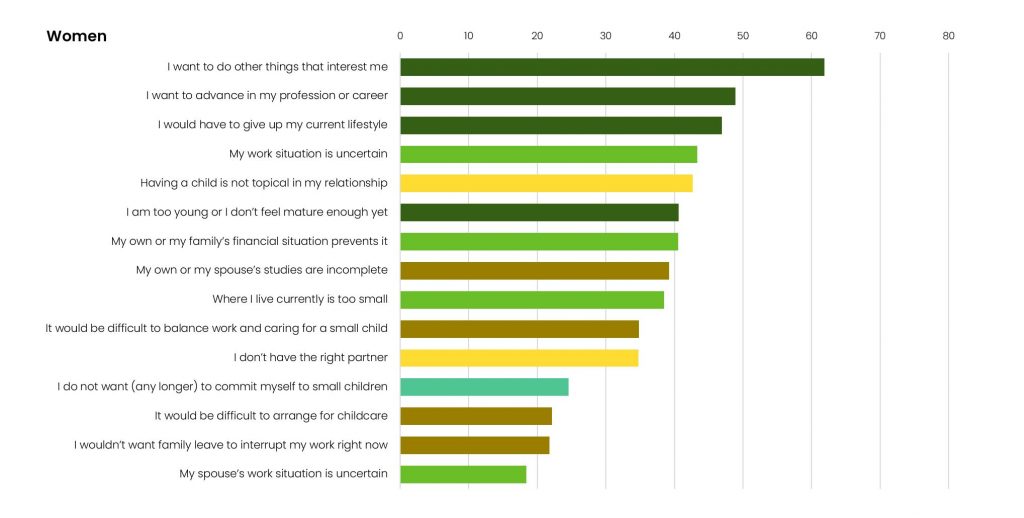
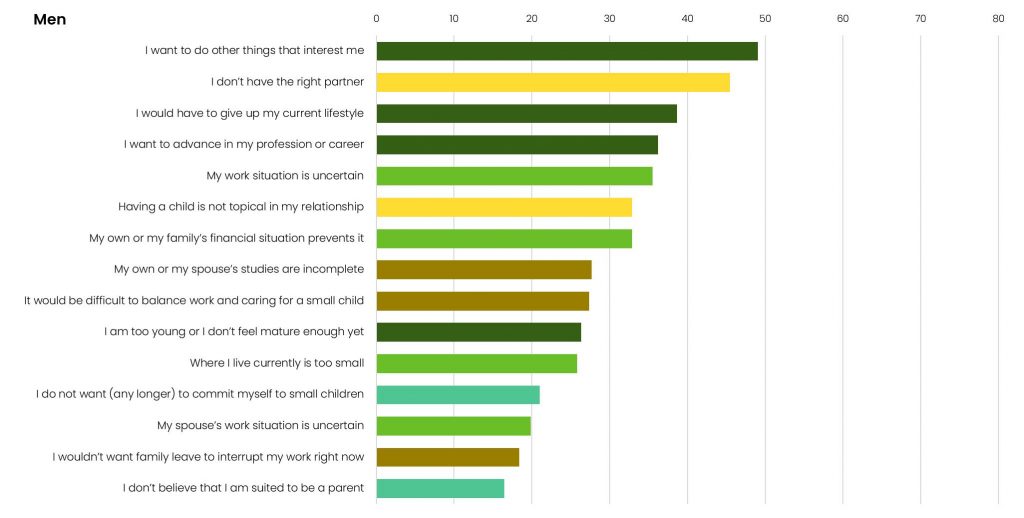
Responses grouped by lifestyle (dark green), relationship (yellow), socioeconomic (light green) and parental responsibility (brown), and other (blue-green) reasons.
Figure 9. Why doesn’t having a child seem topical? Mothers and fathers under 40 years of age, who are planning to or are unsure whether they will have a child, according to whom the below reasons have affected their decision significantly or somewhat, %
Source: Family Barometer Survey 2018, Väestöliitto Berg. 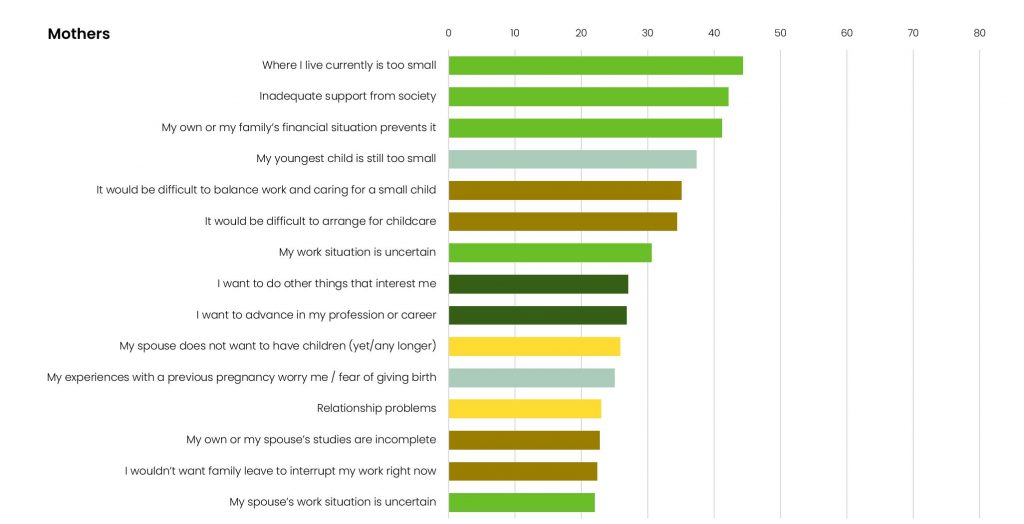
Responses grouped by lifestyle (dark green), relationship (yellow), socioeconomic (light green) and parental responsibility (brown), and other (gray) reasons.
Why postpone the first child, or the second?
The Väestöliitto Family Barometers have been monitoring the childbearing and family policy preferences of Finland’s adult population over many decades. Lack of a spouse has consistently been a major barrier to having children. Along with this, lifestyle reasons have become highlighted more recently. Below, we detail the reasons for why people do not at present want to have children.
For respondents without children, lifestyle considerations are primary factors (Figure 8). The desire to do other interesting things and maintain one’s lifestyle are among the top three reasons today for both sexes. In addition, women emphasize the desire to advance in their careers, while men emphasize the lack of a spouse. Economic reasons also play a role. When respondents already have at least one child (Figure 9), different issues become highlighted. In this context, the main reasons identified by both sexes were housing, financial insecurity and difficulties in balancing work and family life. Hence, in the case of parents of young children, using traditional family policy measures might help in raising the birth rate.
Families with children and Finns in general tendto emphasize the need for greater flexibility in balancing work and family life. In 2018, the top-most desire among the population as a whole was to have flexible working hours, the same as it was also earlier in the century, and the share of the people who considered this issue very important had increased in all population groups (Figure 10).
Figure 10. Important or somewhat important family policy measures, 20–59-year-old women and men, %
Source: Family Barometer 2018, Kontula 2018. 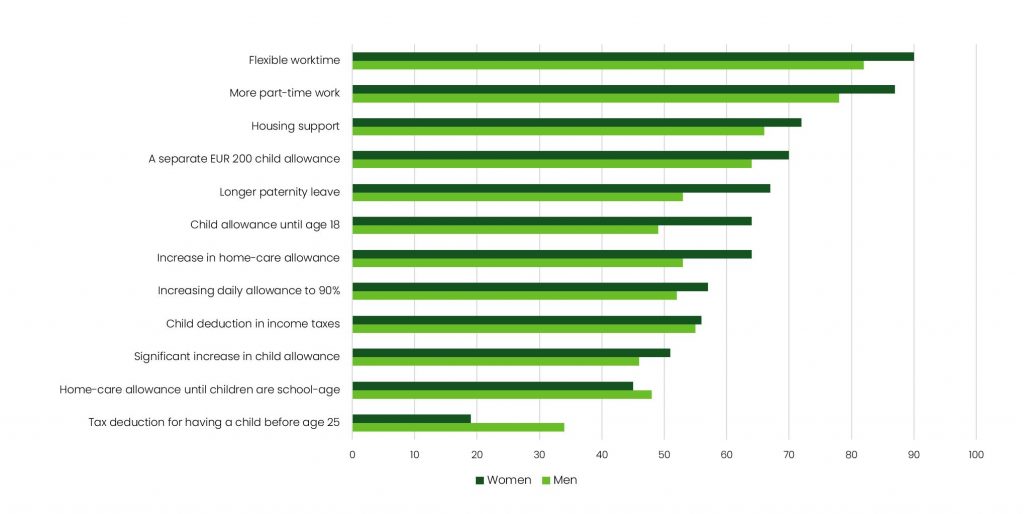
How can we help people start families?
The decline in the birth rate in the 2010s will have long-term effects on the population structure. Finland appears mired in a “low-fertility trap” (Lutz, Skirbekk & Testa, 2006). The expression describes a situation in which birth rates in developed countries continue to fall as a result of the interaction between various economic, population-related and social factors.
One may ask whether declining birth rates are necessarily a problem. A nation can prosper economically even if the birth rate is below the replacement level (2.1 children per woman). Immigration and technological solutions, for example in elder care, can compensate for the challenges posed by the dependency ratio. Still, a total fertility rate of less than 1.6 has been viewed as a major fiscal challenge (Lee & Mason, 2014).
A common claim is that immigration can be used as a solution to the challenge of the population decline and the dependency ratio. Immigration can, of course, affect the size of the working-age population, but not so much the total fertility rate. Immigration can have some effect on the birth rate only if the immigrants themselves arrive from countries with higher birth rates. This does not apply to the case of Finland: most ofour immigrants were born in low-birth countries, such as Russia and Estonia, or other EU countries. In addition, already second-generation of immigrants tend to “adapt” to the number of children in the new country. In Sweden, for example, the total fertility rate of people with an immigrant background is estimated to be only 0.03 higher than that of citizens who were born in Sweden (1.76 and 1.73) (Persson, 2013).
Immigration to Finland in the 2000s has been so lowthat it has had virtually no effect on total fertility. The significantly higher numbers of immigrants moving to Sweden and Germany have had some effect on the annual total fertility rates in those countries; the effect is estimated to be about 0.05–0.1 children, or a maximum of about 5–6% of the total fertility rate (cf. Sobotka, 2008). According to experts, Germany’s immigration may explain about half of the increase in the country’s total fertility in recent years; family policy investments explain the rest (cf. Figure 2, above).
In a country with a low birth rate, new service needs also emerge as people live alone and without children for increasingly longer periods. This new cultural and demographic situation requires novel approaches in population policy as well as a comprehensive policy for family creation, and for children and families.
According to research data, generous family policies and especially high investments in early childhood education can promote higher birth rates over time (Olivetti & Petrongolo, 2017). Incentives given upon the birth of a child (a “baby bonus” in cash or as a service voucher) usually affect the timing of having children, but not necessarily the final number of children. For example, someone may try to have a second child more quickly than would have happened otherwise. Affecting the timing is relevant from a population perspective. In addition, in the current situation in Finland, where we are approaching the lowest low fertility, the boundary between timing and the final number of children is disappearing. Birth rates are falling in all age groups and especially for firstborns. The proportion of people without children appears to be reaching a record high for an entire generation. In this kind of situation, a measure that affects the timing of having children may make a difference in whether someone ends up having any children. For these two reasons, incentives to influence the timing of having children can be useful.
Improving the housing stock to suit families with children in growth centers could be the most effective way to increase the birth rate in Finland.
According to parents, the size of the home and childcare arrangements have the greatest impact on when families consider having a second or third child. This is a clear opportunity for sociopolitical innovation and urban planning. Improving the housing stock to suit families with children in growth centers could be the most effective way to increase the birth rate in Finland. In improving work-life balance for those with families, greater support should go into making it possible to start a family at a younger age. It is a reality that the highly educated often have their first child clearly later than they would have considered ideal (Rotkirch et al., 2017). For this group, providing support in the ability to reconcile work or studies with family life could help people start a family in the way that they would consider ideal.
Where fertility declined in the early 1970s as mothers of young children moved into paid employment, childbearing is now being transformed by the expectations of working life as well as by urbanization. The old ways of support for starting a family may no longer apply. An example of this is how, more than anything else, the population wants greater flexibility in working life and family policy benefits – not so much an increase in the rate of benefits or new kinds of family leave (cf. Figure 10, above).
The single biggest reason behind the falling birth rate is that fewer firstborns are born, and the most important reason people give for this has to do with lifestyle. The reasons may be influenced by the general climate concerning families with children and family life; strong social signals may also play an important role. For example, the work done by parents of young children is not publicly perceived in Finland as significant for the national economy: on the contrary, parents who are on family leave are often seen as lazy. Work and career are viewed as a social norm, parenting is not. Positive examples of how to handle the timing of parenthood in different ways, and examples of a flexible work-life balance would also be beneficial. In addition, the widespread meme widely disseminated in Finland, too, of a baby being the worst possible ecological wrong that one could commit, demands a clear response from decision-makers. In a country with a very low birth rate, childlessness or declining birth rates in general do not pave the way for sustainable or ecological population development (cf. Pelkonen & Sorsa, 2019; Rotkirch, 2018).
Finland has not recently invested much in terms of research on birth rates and reproductive health, even though the reasons behind the declining birth rate and their consequences for public health will represent a major social policy challenge in the 2020s. Norway, for example, recently established a large, interdisciplinary research center that specializes in the birth rate and reproductive health. The Finnish Institute for Health and Welfare, THL, has reduced sexual and reproductive health research and networking, and Statistics Finland is producing fewer statistics on families. For this reason, Väestöliitto recently established SYNTY, the Network for Fertility Research, with the aim of improving communication between various researchers and development entities, the social impact and interdisciplinary dialogue.
References
Barthold, J.A., Myrskylä, M. & Jones, O. R. (2012.) Childlessness drives the sex difference in the association between income and reproductive success of modern Europeans. Evolution and Human Behavior 33(6): 628–38.
Berg, V. (2018) Suomalaiset haluavat nykyään vähemmän lapsia kuin ennen. Tietovuoto, toukokuu. Väestöliitto Väestöntutkimuslaitos. www.vaestoliitto.fi/tieto_ja_tutkimus/
vaestontutkimuslaitos/tietovuodot/touko-2018-tietovuoto/
Berg, V., Miettinen, A., Latvala, A. & Rotkirch, A. (in preparation) Lifestyle or recession? Childbearing ideals, intentions and constraints in Finland 2002–2018.
Bernhardt, E. & Bergnerh, D. (2013). The non-modern child? Ambivalence about parenthood among young adults. In A-L Ellingsaeter, A-M Jensen & M. Lie (eds) The Social Meaning of Children and Fertility Change in Europe, pp. 102-119. London: Routledge. doi: 10.4324/9780203070635
Comolli, C. L. (2017). The fertility response to the Great Recession in Europe and the United States: Structural economic conditions and perceived economic uncertainty. Demographic Research, 36, 1549–1600.
Comolli, C. L. (2018). Finnish fertility: Pro-or counter-cyclical? Research on Finnish Society, 11, 58–64. Comolli, C. L. (2019). Couples’ transition to parenthood in Finland: A tale of two recessions. Stockholm Research Reports in Demography.
Comolli, C. L., Neyer, G., Andersson, G., Fallesen, P., Jónsson, A., Kolk, M., Lappegård, T., Dommermuth, L. & Jalovaara, M. (2019). Beyond the economic gaze. Childbearing during and after recessions in the Nordic countries. Stockholm Research Reports in Demography, No. 16.
Dettling, L. J., & Kearney, M. S. (2014). House prices and birth rates: The impact of the real estate market on the decision to have a baby. Journal of Public Economics, 110, 82–100.
Eurostat (2020). Fertility Statistics. https://ec.europa.eu/ eurostat/statistics-explained/index.php/Fertility_statistics#Almost_half_of_children_born_in_the_EU_in_2018_
were_first_born_children
Frejka, T., Goldscheider, F., & Lappegård, T. (2018). The two-part gender revolution, women’s second shift and changing cohort fertility. Comparative Population Studies, 43, 99–130. https://doi.org/10.12765/CPoS-2018-09enGoldstein,
J., Lutz, W., & Testa, M. R. (2003). The emergence of sub-replacement family size ideals in Europe. Population research and policy review, 22(5–6), 479–496.
Harknett, K., & Hartnett, C. S. (2014). The gap between births intended and births achieved in 22 European countries, 2004–07. Population Studies, 68(3), 265–282. https://doi.org/10.1080/00324728.2014.899612
Hellstrand, J., Nisén, J., & Myrskylä, M. (2020). All-time low period fertility in Finland: Demographic drivers, tempo effects, and cohort implications. Population Studies, 1–15.
Hellstrand, J., Nisén, J., Miranda, V., Fallesen, P., Dommermuth, L., & Myrskylä, M. (2020). Not just later, but fewer: novel trends in cohort fertility in the Nordic countries. MPIDR WP-2020-007.
Hetemäki, M. (2019). Miten vakava ongelma syntyvyyden lasku on ja mitä sille voitaisiin tehdä? Column and electronic attachment, Syntyvyyden laskun syistä (causes behind the birth rate’s decline), Ministry of Finance 10 January 2019.
Jalovaara, M. & Miettinen, A. (2013). Does his paycheck also matter? The socioeconomic resources of co-residential partners and entry into parenthood in Finland. Demographic Research 28, 881–916.
Jalovaara, M., & Fasang, A. E. (2017). From never partnered to serial cohabitors: Union trajectories to childlessness. Demographic Research, 36, 1703–1720.
Jalovaara, M., Neyer, G., Andersson, G., Dahlberg, J., Dommermuth, L., Fallesen, P., & Lappegård, T. (2017). Education, gender, and cohort fertility in the Nordic countries. European Journal of Population, 1–24.
Klemetti, R. (2006). The use of assisted fertilization in Finland: Health effects and equity. Doctoral thesis. Stakes, Research Report 158, Gummerus, Vaajakoski.
Klemetti, R., Liitsola, K., Luoto, R., Gissler, M., Jokela, S. & Koponen, P. (2018). Seksuaali- ja lisääntymisterveys. In: Terveys, toimintakyky ja hyvinvointi Suomessa 2018 (Edited by P. Koponen, K. Borodulin A. Lundqvist & S. Koskinen Seppo). Finnish Institute for Health and Welfare (THL) Report 4/2018. Helsinki, 2018.
Kontula, O. (2018). 2020-luvun perhepolitiikkaa. Perhebarometri 2018. Helsinki: Väestöliitto. Kouluterveyskysely (2015). Retrieved from https://www.thl.fi/fi/ tutkimus-ja-asiantuntijatyo/vaestotutkimukset/ kouluterveyskysely. Helsinki: Finnish Institute for Health and Welfare (THL).
Kunttu, K., Pesonen, T. & Saari, J. (2017). Korkeakouluopiskelijoiden terveystutkimus 2016. Studies by the Finnish Student Health Service 48. Arkmedia Oy, 2017.
Lainiala, L. (2012). Toiveesta toteutukseen. Suomalaisten lastenhankintaa selittäviä tekijöitä. Population Research Institute Reports E, 44, 2012.
Demographic shifts challenge the pension system and other public finances (Heikki Tikanmäki and Allan Seuri)
Summary
- Finland’s national and municipal economies already have a sustainability gap, and it is further complicated by the declining birth rate.
- The falling birth rate poses a challenge to, above all, the pension system: when the age groups that are working decline in relation to the age groups who receive pensions, the current level of earnings- related pension contributions is not enough to cover the pension expenditure.
- This chapter examines how different birth rate scenarios affect the relationship between pension expenditure and income and other public finances. The scenarios are divided into low and high birth rate calculations as well as a basic calculation. Total fertility in the calculations is expected to be 1.20 (low), 1.45 (baseline) and 1.70 (high birth rate). The scenarios extend to the year 2085.
- In the pension system, all birth rate scenarios will increase earnings-related pension contributions from about 2050 onwards. In the low birth rate calculation, the contribution would be about 34% in 2085, in the basic calculation about 30%, and even in the high birth rate calculation it would be higher than at present, about 27% of the amount of wages.
- The effect of a declining birth rate on the rest of public sector finances is less drastic than on the pension system. The difference between the basic calculation and the low birth rate calculation in terms of the ratio of social and health care expenditures to GDP in 2085 is only about 0.7%age points, where overall growth between 2020 and 2015 is about five percentage points.
- The growing pressure to increase pension contributions in order to maintain the pension system would ease if the birth rate were to rise or if there were more immigration. The chapter also considers options for how the pension system could be adjusted in the event that an increase in the birth rate or in immigration fails to materialize.
Demographic shifts have a major impact on the long-term financial prospects of the welfare state.¹ Birth rates are currently falling sharply, a fact also noted in public debates. As the size of the working population shrinks in relation to the rest of the population, it becomes increasingly difficult to fulfill the promises of the welfare state. Over the extended long term, declining birth rates will reduce both public sector revenue and expenditure. Public spending will focus on the ageing population and, to some extent, on children and young people. Public sector revenues, on the other hand, are centered on the working-age population. In other words, the falling birth rate reduces public sector revenues at a delay of approximately 20 years, but only cut age-related expenditures at a delay of about 60 to 70 years. This timing disparity in revenue and expenditure is the factor that results in lower birth rates producing an imbalance in the long-term financial outlook for social security and other age-related expenditures.
The calculations presented in this chapter were made in 2019, in other words, before the COVID-19 crisis. The long-term challenges nevertheless remain qualitatively unchanged. At the time of this writing, it is unclear what kind of starting position Finland will be in as it moves towards the long term on the heels of the current crisis.
In this article, we focus primarily on the pension system, because it is more affected by the birth rate than the rest of public finances, i.e., the state and municipalities. It is worth noting, however, that the public sector is, in principle, subject to a substantial long-term imbalance in expenditure and revenue, particularly with regard to age-related expenditures funded by the state and municipalities – mainly, social security, healthcare and care services.
The aim of this article is to describe the magnitude of the challenges posed by the lower birth rate and to outline possible solutions, especially for the pension system. Some of the solutions are related to influencing population development and some to modifications of the pension system. In addition to demographic change, economic development also has a significant impact on the long-term prospects of pension financing. In particular, the importance of investment income for pension assets is even greater than that of any population-related factors (Sankala, Reipas & Kaliva, 2018).
In analyzing the effects of the reduced birth rate, we will use as the starting point the Statistics Finland 2018 population forecast as well as alternative scenarios for changes in the birth rate. Estimates of the development of the pension system are based on the calculations presented in a 2019 report on the long-term calculations for statutory pensions (Tikanmäki, Lappo, Merilä, Nopola, Reipas & Sankala, 2019) and other calculations already published by the Finnish Centre for Pensions. The pension calculations were made using the long-term planning model of the Finnish Centre for Pensions.² The effects of the birth rate on the whole of public finances are examined using the sustainability gap model. The calculations are based on the Statistics Finland 2018 population forecast (Statistics Finland, 2018). Pension calculations that are based on the Statistics Finland 2019 population forecast (Statistics Finland, 2019b) are presented in the memorandum by Reipas (2019d).
These kinds of calculations are so-called trend calculations, used to describe where current developments and legislation could lead in the long run if the assumptions were to hold true. Their intention, therefore, is not to try to forecast future changes in social security systems or other legislative changes, for example.
Long-term calculations naturally involve uncertainty, which is addressed through sensitivity analyses. The sensitivity of the pension calculations in the above-mentioned report is discussed by using various mortality and birth rate scenarios. In addition, the previous 2016 report addressed the effects of net migration. The assumptions regarding future economic development in the calculations for this article adhere to the basic calculations of the Finnish Centre for Pensions. Alternative calculations on employment, earnings growth and return on pension assets can be found in the report Tikanmäki et al., 2019. More information about the role of and uncertainties related to the calculations is available on the Finnish Centre for Pensions blog (Reipas, 2019b). The Ministry of Finance (e.g., 2018, 2020) and the Economic Policy Council (e.g., 2018, 2019) have conducted sensitivity analyses of sustainability gap calculations. The sustainability gap calculations presented in this article were made using the assumptions in the autumn 2019 sustainability gap model; see Ministry of Finance (2020) for updates of assumptions.
This article presents calculations regarding the effects of the birth rate on the financial sustainability of the pension system and the rest of the public sector. Of other demographic factors, mortality and immigration are also addressed, but without providing detailed calculations.
In the Statistics Finland 2018 population forecast, the assumption for the total fertility rate was 1.45, and the actual 2018 fertility rate was 1.41. Based on preliminary data, the total fertility rate in 2019 was 1.35 (Statistics Finland, 2020). Birth rates were discussed in more detail in the previous chapter of this report (“The declining birth rate and the changing childbearing landscape”).
The other key assumptions concerning the population in the Statistics Finland 2018 population forecast are as follows: by age and sex, the decrease in mortality will continue along the same lines as it was observed to decline when comparing mortality in 1987–1991 and 2013–2017. Net migration to Finland is 15,000 people per year.
In the basic calculation of the Finnish Centre for Pensions, the Statistics Finland population forecast up to the year 2070 has been extended to 2085. Otherwise, the same assumptions are used in the calculation as in the Statistics Finland population forecast, but the rate of decline in mortality after 2070 has been sliced in half. The reason for slowing down the rate of the decline is that, compared to international population forecasts, Finland’s mortality rate in the Statistics Finland population forecast is already quite low for 2070.
¹The welfare state’s structures can also affect demographic shifts. These effects have been excluded from this review.
²The pension calculations do not include the changes to survivors’ pensions negotiated by labor market organizations in June 2019. This choice was made in order to have the widest possible range of sensitivity analyses available. Changes in the survivors’ pension affect the sustainable standard contribution level by about 0.1% of the wage amount (Reipas, 2019c). Instead, the changes negotiated in the same context to the age limits for the additional day entitlement to unemployment insurance are included in the calculations presented here.
Recent changes in the pension system and the population
The Finnish statutory pension system consists mainly of earnings-related pensions and national and guarantee pensions. The share of earnings-related pensions in statutory pension expenditure has increased in a trend-wise manner. Today, earnings-related pensions make up about 90% of statutory pension expenditure, and this share is slated to increase in the future.
Earnings-related pensions are partially funded, but most of each year’s pension expenditure is financed by pension contributions levied in the same year. Earnings-related pensions consist of several different pension plans, the most important of which is the employees’ pension act plan for private sector employees. Other key earnings-related pension plans are those for municipal, state and self-employed workers, and farmers. The level of funding and methodology varies from one pension plan to another. The pension plans for farmers and the self-employed are not funded at all. On average, just under 30% of all accrued earnings-related pensions are funded.
Due to these structures, actual and future demographic and economic developments largely determine the operating environment for the statutory pension system. Over the short term, the impact of economic developments on the financial sustainability of the pension system is more emphasized, whereas the impact of demographic change is more pronounced over the long term. This article focuses on the impact of population development on the pension system, with a particular emphasis on the birth rate.
This choice was made because birth rates, together with transnational migration, largely determine the number of payers of future pensions.
Traditionally, developments in mortality have also had a significant impact on pension expenditure, and thereby on the funding of pensions. However, the pension reforms of this millennium and their automatic stabilization mechanisms have reduced the importance of mortality in funding earnings-related pensions. Increased life expectancy also has the effect of increasing other age-based expenditures, but this article does not address those effects.
In the 2005 pension reform, the amounts of starting pensions were adjusted to the increase in life expectancy by using the life expectancy coefficient. Due to the increase in life expectancy, pensions are paid out over a longer period on average than previously. The idea of the life expectancy coefficient is to reduce monthly pensions, so that longer-term pensions are financed by reducing the monthly pension amount. In other words, the capital value of the pension, i.e., the interest-bearing amount of pensions paid over the entire retirement period, does not change as average life expectancy increases.
In the calculations, life expectancy increases from 81.5 years in 2017 to 90.8 years by the end of the calculation period, in 2085. In addition, in the 2017 pension reform, the lowest retirement age was linked to the change in life expectancy starting from those who were born in 1965. At the same time, the life expectancy coefficient was relaxed to take into account the connection between the lowest retirement age and life expectancy.
However, even after these reforms, the pension system is not fully immune to changes in mortality. Acceleration in the decline in mortality will increase pension expenditure immediately, but the automatic adjustment mechanisms only produce their balancing effect at a delay. Similarly, a slowing in the decline in mortality would have the opposite effect. In addition, linking retirement age to life expectancy does not fully adjust pension expenditure to a decline in mortality, as not everyone is able to work until the minimum retirement age. The effect of this factor becomes emphasized if the mortality rate is quite low, because then the minimum age for old-age pensions will rise to an extremely high level (Tikanmäki et al., 2019).
This past decade’s dip in birth rates poses a significant challenge to the long-term financial outlook for pensions. Birth rates have also fallen in recent years in many other developed countries, but the collapse of Finland’s birth rate is exceptionally drastic internationally speaking, compared to neighboring countries and the large Central European countries (Figure 1).
The 2017 pension reform was negotiated in 2014 and was based on calculations that used the Statistics Finland 2012 population forecast of demographic developments. The presumed total fertility rate was then 1.82. The impact assessments of the reform estimated that the current level of pension contributions in private sector earnings-related pensions would be sufficient until the 2070s (Kautto & Risku, 2015; Reipas & Sankala, 2015). The other assumptions underlying the pension reform calculations have not changed to the same extent.
The 2017 pension reform significantly improved the financial sustainability of the pension system. The problems resulting from the falling birth rate in terms of financing pensions would be even more dire if the reform had not been carried out in time.
Figure 1. Development of total fertility rates in the 2000s in selected European countries.
Source: The Human Fertility Database 2019; World Bank 2019.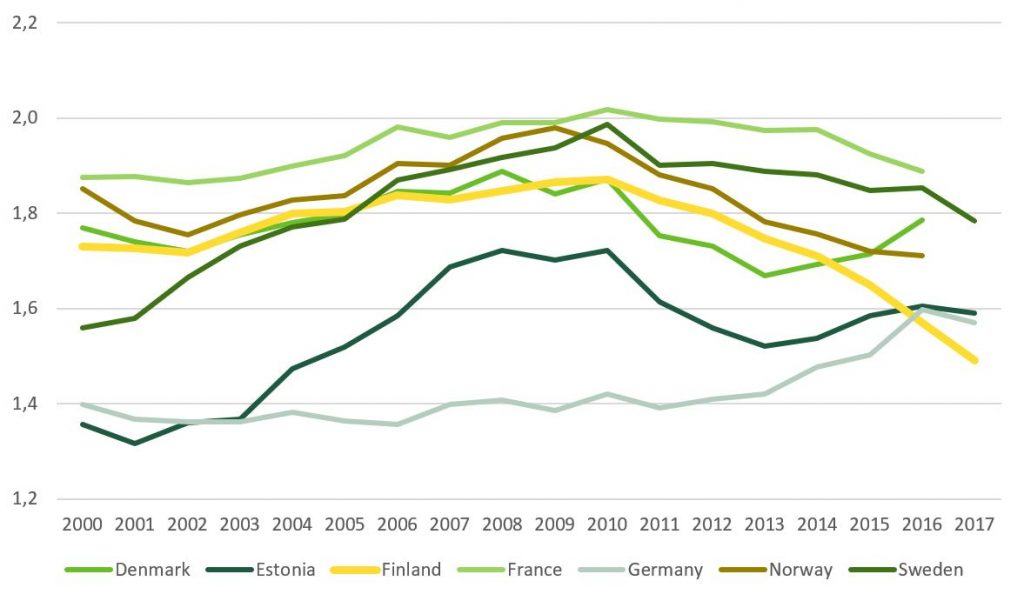
Impact of the birth rate on the pension system
In the calculations by the Finnish Centre for Pensions, as for example in the forecasts of Statistics Finland, the birth rate is viewed precisely through the period-specific total fertility rate. Underlying this approach is the idea that, ultimately, from the point of view of financing the pension system and public finances in general, the number of children born in each calendar year is the more relevant information. On the other hand, a cohort-specific total fertility rate is a more accurate representation of the actual total number of children born to the average family.
If the decline in birth rates is partly due to people postponing children, the total fertility rate per period is likely to rise at some point. Factors like these, how ever, have not been taken into account in these trend calculations. The actual decline in the birth rate is not exclusively about postponing (Hellstrand, 2018).
Since the writing of this report, the Finnish Centre for Pensions has published pension calculations based on demographically justified birth rate scenarios (Nopola & Tikanmäki, 2020). In the primary scenario of that report, the overall fertility rate turns upward due to a slowdown in the postponement of childbearing.
The calculations presented here regarding the effects of changes in the birth rate on the pension system were originally published in the report by Tikanmäki et al., 2019, and in a subsequent revision to it (Reipas, 2019a). The report’s calculations assume a total fertility rate, which, together with the demographic structure, determines the number of children born each year. In the basic calculation, the assumption for total fertility rate is 1.45 starting from 2019. In the high birth rate calculation, the assumption for total fertility rate is 1.70, which was also the assumption in the Statistics Finland 2015 population forecast. Similarly, in the low birth rate calculation, the total fertility rate is assumed to be 1.20. This level is low also by international standards, but not entirely exceptional. Similar rates of total fertility have been observed for some time, for example in some East Asian countries, including South Korea and Taiwan (IndexMundi, 2019; The Human Fertility Database, 2019).
In historical terms, an assumed fertility rate of 1.7 is not particularly high, though still significantly below the population replacement level of 2.1. This assumption of total fertility would essentially mean a return to the levels of recent decades. In the course of the just-passed decade, the assumption used in the calculations of the Finnish Centre for Pensions was as high as 1.85 (Risku et al., 2011).
In the Statistics Finland population forecast, the number of 0-year-olds will decrease from about 50,600 in 2017 to 38,900 in 2070. For comparison, the highest number of 0-year-olds in the current century was at the end of 2010, when the Finnish population included 61,100 babies (Statistics Finland, 2019a).
In the low birth rate calculation, the number of 0-year-olds in 2070 is 27,600 and in the high birth rate calculation, it is 52,500. Over the long term, the effects of low birth rates become multiplied as the generations of childbearing age also grow smaller, further accelerating the ageing of the population.
The ratio of pension expenditure in relation to total wages will begin to increase in the 2040s, according to the basic calculation and the low birth rate calculation, and the effect of the birth rate will begin to be significant from the middle of the century onward. The impact of the declining birth rate will be greatest in the 2080s, when all working-age generations will be smaller and the retirement-age generations relatively larger. If the calculation were extended beyond this point, the effect of the birth rate would level off.
The number of employed people is determined by the size of the working-age population and the rate of employment. According to the calculation of the Finnish Centre for Pensions, the employment rate will increase to just over 73% over the next few years and will remain there throughout the calculation period. Using standard concepts, the employment rate is calculated as the share of employed persons in the population aged 15–64. Over a longer term, this will not account for all employment growth, as the employment of those over 65 will become increasingly common during the calculation period, due to, among other things, an increase in the minimum retirement age.
In the calculation, the number of the employed will remain at approximately the current level for the next two decades. After this, in the basic calculation, the contraction of the working-age population begins to affect the number of the working-age population, and thereby the number of the employed. The number of the employed takes into account the increases in the retirement age, which increase the number of employed older people. Without this effect, the number of the employed would fall more than what is presented here. In the high birth rate calculation, the number of the employed remains at approximately the current level throughout the forecast period, through 2085. Correspondingly, in the low birth rate calculation, the number of the employed declines significantly faster than in the basic calculation (Figure 2).
At the same time as the number of the employed decreases, the number of pensioners increases. Their numbers expand in the same way in all of the calculations, because the birth rate will not yet affect the number of pensioners during the calculation period. This is because children born in 2019 will not reach the lowest retirement age until the end of the 2080s, immediately after the end of the forecast period. The small impact on the number of pensioners from the 2040s onwards is explained by a change in the number of disability pensions.
Due to changes in the number of the employed, different birth rates lead to a situation where, toward the end of the forecast period, the same number of pensions have to be financed through the pension contributions of a smaller number of the employed. In the low birth rate calculation, the number of retirees even exceeds the number of the employed in 2085. From the point of view of pension financing, the situation is truly challenging (Figure 3).
Figure 2. Number of the employed, in thousands.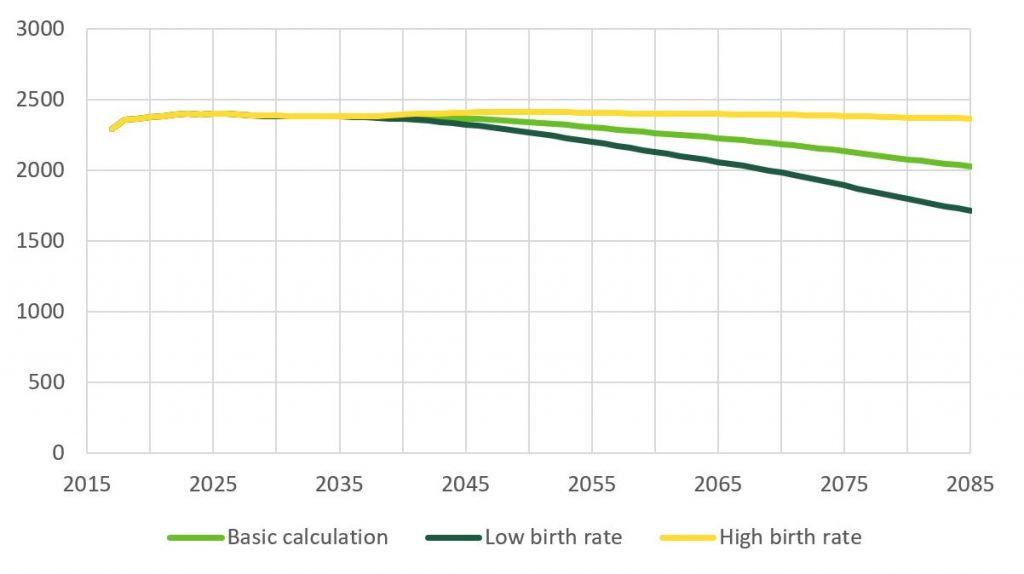
Figure 3. Number of pensioners, in thousands.
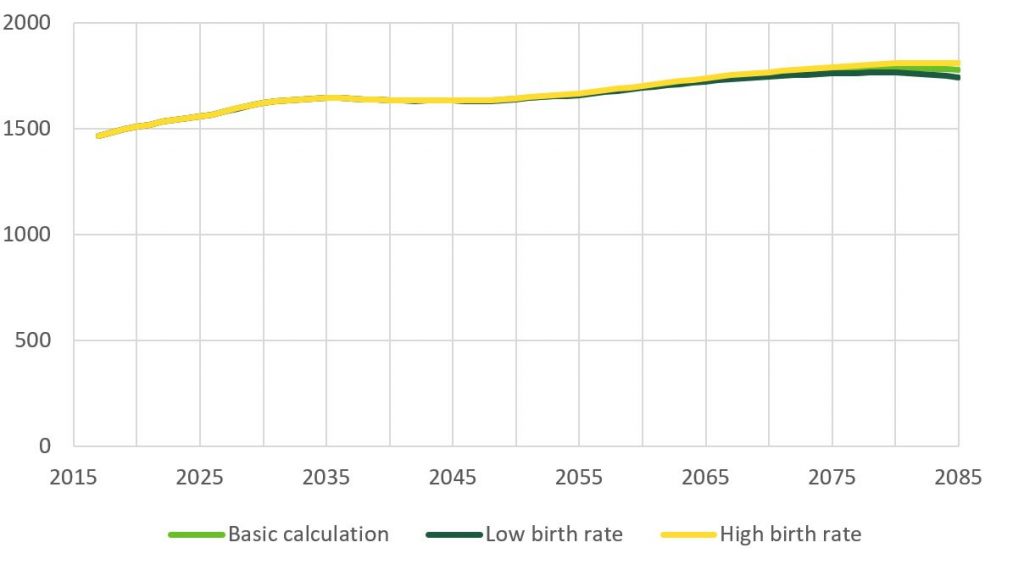
Figure 4. Total pension expenditure, in billions of euros at 2017 price levels.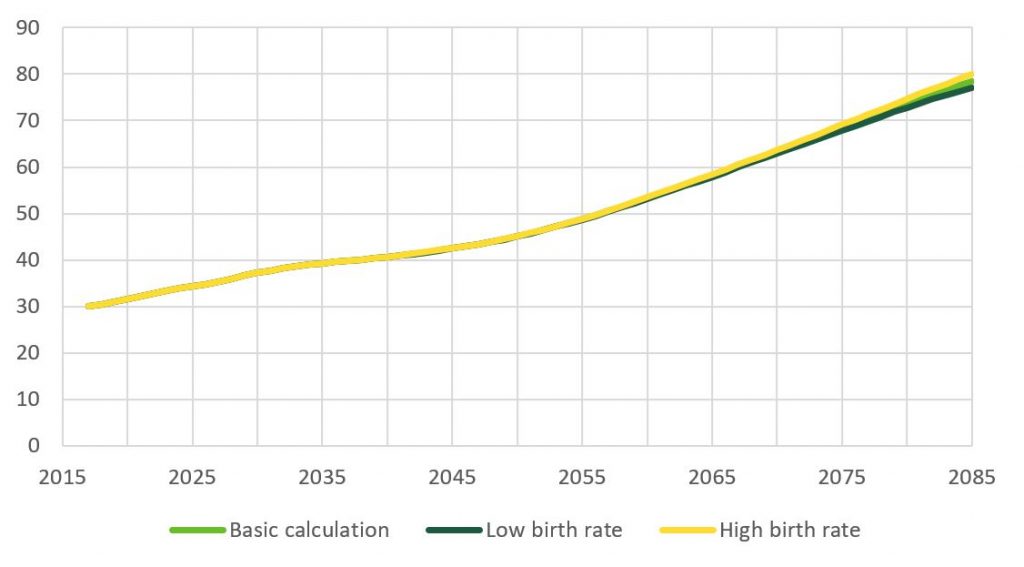
Ultimately, pensions are financed through production, so it is natural to compare total pension expenditure with GDP. In turn, the pension expenditure of an individual pension plan can be compared to its funding base – in the case of earnings-based pension plans, with the amount of wages or earnings.
Over the long term, an examination of euro-amount pension expenditure does not provide a very comprehensive picture of the effects of the birth rate, and it is more useful to compare pension expenditure with the available funding sources. In fact, the euro-amount pension expenditure will not be affected by the birth rate until the generations born now are beginning to retire (Figure 4). Over the extended long term, a low birth rate therefore translates to lower pension expenditure in euros. However, this kind of long-term analysis of euro amounts is not of particular interest.
It is more important to see how the pension system’s expenditure and revenue develop in relation to each other. Relative to GDP, pension expenditure will increase in the basic calculation as well as in the low birth rate calculation, as the number of the employed who finance pensions will decrease from the 2040s onward at the same time as the number of pensioners grows. In contrast, in the high birth rate calculation, total pension expenditure remains more or less at current levels relative to GDP (Figure 5). The most important single part of the earnings-based pension plan is the employee pension plan for private sector employees. The pension security of almost all private sector employees is arranged through the earnings-based pension system. The earnings-based pension system also contains the most detailed financial provisions, which makes it possible to make detailed financial calculations. In the earnings-based pension system, part of the pension expenditure is funded in advance using an individual-based funding technique. The funding rate of the earnings-based pension system is slightly above 30% at the starting point. In other words, earnings-based pension funds account for over 30% of the value of already accrued pension rights.
Figure 5. Total pension expenditure, percentage of GDB. 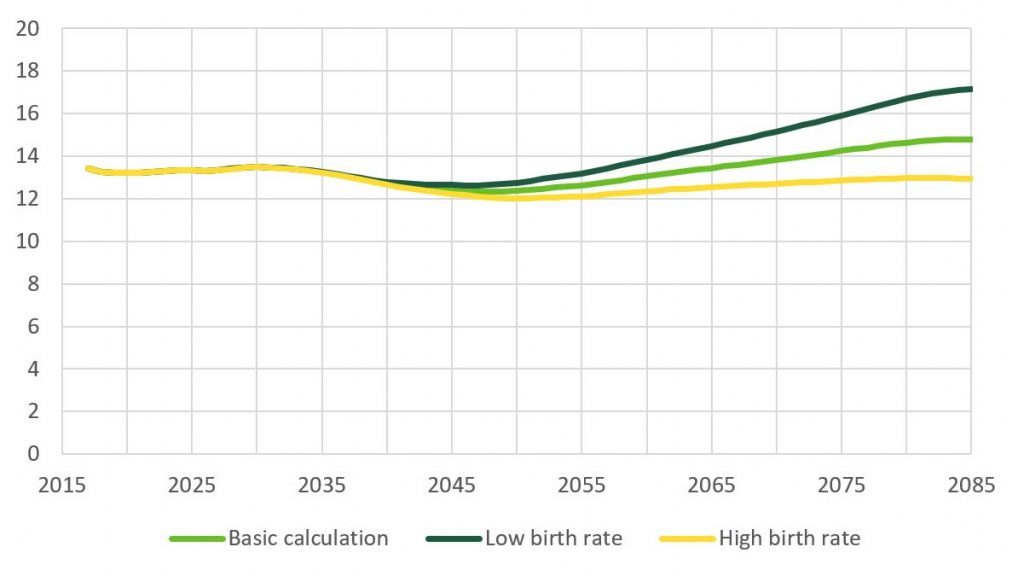
Figure 6. Employment pension expenditure, percentage of wage amount.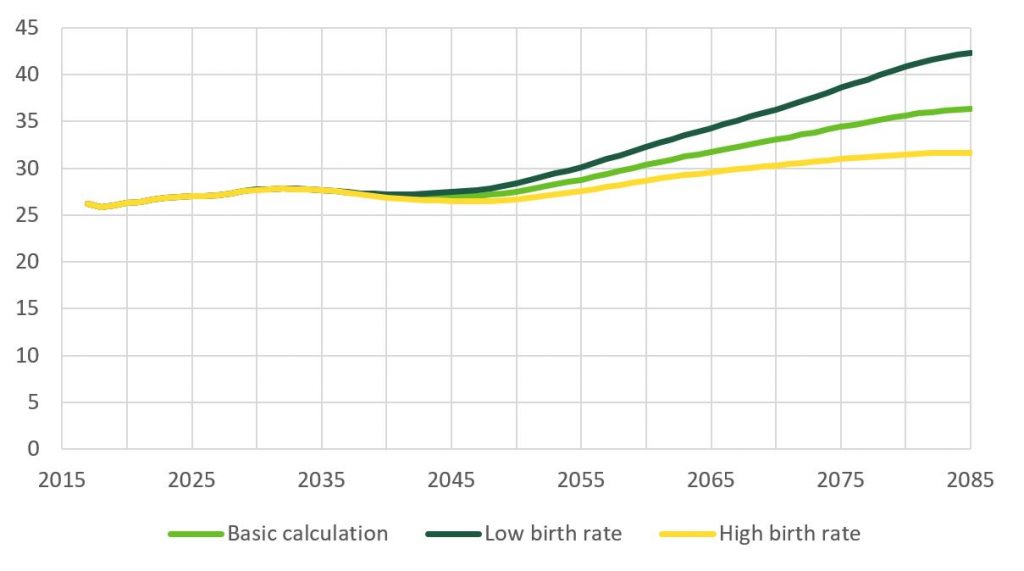
Figure 7. Employment pension contribution, percentage of wage amount.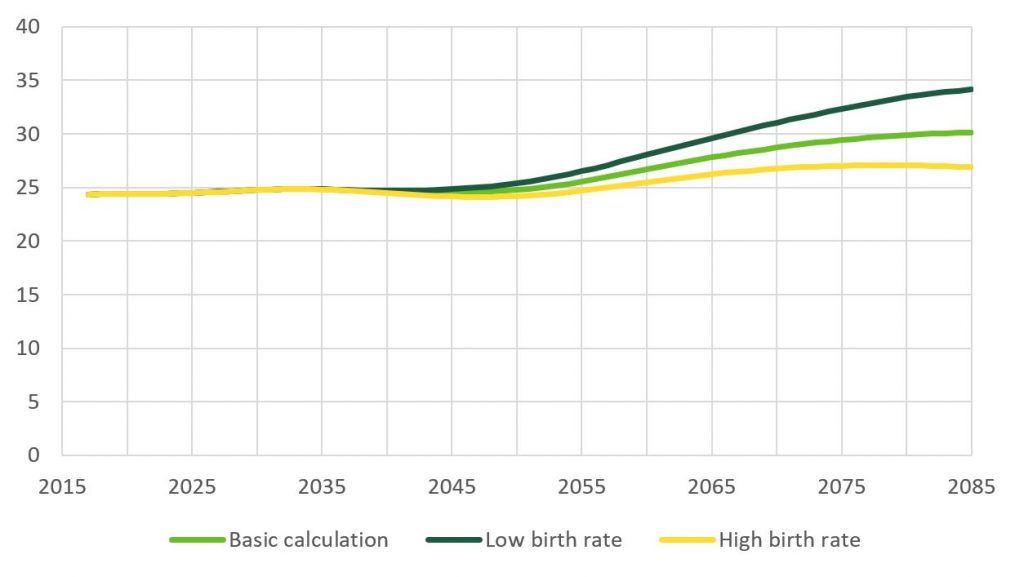
In the basic calculation, the pension expenditure of the earnings-based pension system in relation to the wage amount varies between 26 and 28% through the middle of this century. Thereafter, the pension expenditure in relation to the wage amount begins to grow and will reach, in the basic calculation, approximately 36% at the end of the calculation period. In the low birth rate calculation, pension expenditure is 42% of the wage amount in 2085. Thus, the low birth rate calculation has this ratio increasing by more than 60% over the forecast period. In the high birth rate calculation, too, pension expenditure relative to wages and salaries would increase, albeit more moderately, to about 32% (Figure 6).
The birth rate trend in the basic calculation will put significant upward pressure particularly on the private sector’s earnings-based pensions after the middle of this century, when children born now are of the best working age (Figure 7).
In the low birth rate calculation, the pressure to increase contributions is higher in the long term than in the basic calculation. In 2085, a 34% earnings-based pension contribution would be required to cover pension expenses. Correspondingly, the earnings-based pension contribution required in the high birth rate calculation is lower than the basic calculation. But even in that calculation, the long-term contribution level would be around 27%, still higher than the present level.
At the level of the earning-based pension system as a whole, the overall picture of pension funding looks somewhat different. When it comes to the pension plans for state employees, the self-employed, farmers and seamen, the government pays part of the pension expenditure in state contributions. For historical reasons, especially in the pension plans of state employees and farmers, the pension expenditure in relation to the amount of wages or earnings is currently quite high. Over time, the government’s shares in these plans will decrease significantly from their current levels.
If all sources of funding for occupational pensions are taken into account, pension contributions and government contributions are already levied at almost 30% in relation to wages and earnings. According to the basic calculation, this level of payment would be sustainable over the long term. If the birth rate continues to fall, there will also be pressure to increase contributions within the entire employment pension system.
This prompts the question of whether the pressure to increase earnings-based pension contributions as a result of the low birth rate is merely a technical matter that can be resolved by transfers between pension plans. The different earnings-based pension plans each operate on the basis of a different funding logic, and, for example, there are no compensation mechanisms between the earnings-based pension system and public sector pension plans. It is therefore reasonable to argue that the problems of the earnings-based pension system are real. Sustainability gap calculations show how population ageing also increases other public spending, such as the spending on healthcare and care services. As a result, the state is unlikely to have the resources to pay for part of the growing earnings-based pension expenditure, even if government contributions under other pension plans were to decrease in the future. Setting up a compensation mechanism would also represent a fundamental change in the financing logic of the earnings-based pension system.
The pension costs of the municipal pension system and of pensions for the self-employed will increase in the future in relation to salary or earnings amounts, the same as in the earnings-based pension system.
The impact of the birth rate on municipal and government public sector finances
In addition to employment pension institutions, public finances also comprise municipalities and the public sector.³ Each sector has its own sources of funding and responsibilities and is therefore differently affected by demographic shifts. Since the declining birth rate reduces the size of the working-age population and, as a result, economic activity, it generally weakens the public sector’s funding base. More important than the sectors’ revenue differences are their differences in expenditure.
Earlier, we saw how the declining birth rate will affect the pension sector. This section examines the effects of the birth rate on public finances in general, and on the municipal and state sectors in particular. The review is carried out within a sustainability deficit framework consisting of a model simulating social expenditure and the actual sustainability gap model, which translates the projected development of age-related expenditure into a sustainability gap estimate (Ministry of Finance, 2018). The sustainability gap describes the amount of immediate and permanent adjustment required for balancing public finances in the long term. In addition to age-related expenses, the sustainability gap is also affected by the initial year’s primary balance, changes in property income and the cost of servicing debt.
In the pension calculations presented above, the scenarios extended through 2085. The sustainability gap analysis, on the other hand, is typically modeled on age-related expenditure, i.e., related to the age structure of the population, and made to extend through 2070, after which all expenditure and revenue are assumed to develop at the same pace as the GDP. In this article, the modeling horizon is extended through 2085, and the calculation uses the assumptions of the Finnish Centre for Pensions regarding age-specific employment rates.4 In the basic calculation, total fertility is 1.45 each year and in the low birth rate calculation, 1.2, as above.
It is worth remembering that central to the calculations is the change between the different birth rate scenarios. For example, the level of the ratio of different types of expenditure to GDP in the social expenditure model may differ from the levels used in the statistics.
Municipal expenditures are centered on the ageing population, hence a lower birth rate weakens their long-term financial position in the same way as that it weakens that of the pension sector, although the impact is somewhat smaller. The situation is different for government spending. Where municipalities are largely more responsible for social and healthcare spending on the elderly, the state bears greater responsibility for education. Declining birth rates reduce younger age groups, directly resulting in reduced education spending.
When estimating the sustainability deficit, the different spending lines are discounted to the present value. In this discounting, developments that occur closer to the present moment are given more weight. For this reason, the birth rate lowers the sustainability gap for the state. Even though the birth rate will eventually raise expenditures relative to GDP (and revenues, which are expected to grow at the same rate as GDP) also for the state, this will be preceded by a decline in financial pressures over several decades.
Figure 8. Impact of birth rate on age-related government and municipal expenditures as a share of GDP.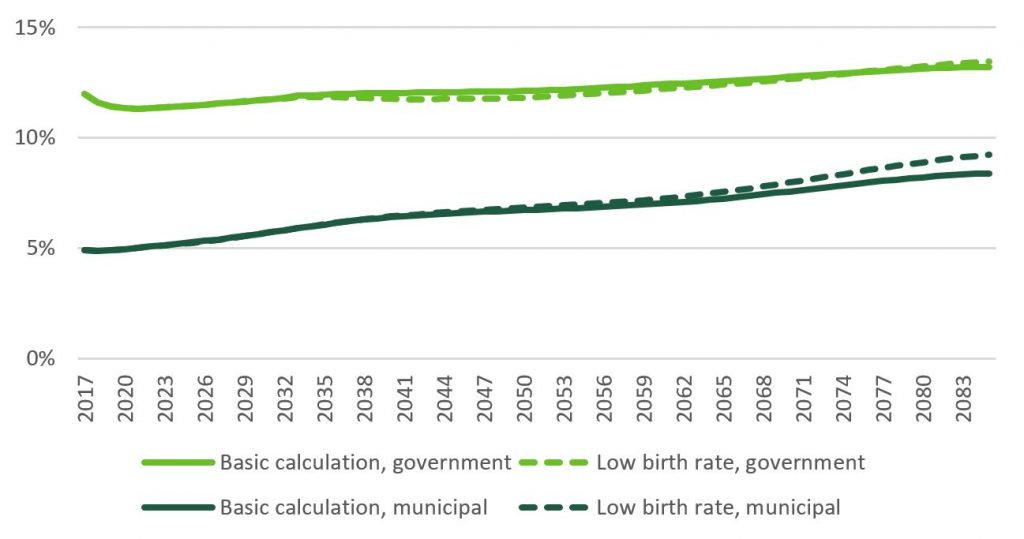
Figure 9. Impact of birth rate on education and social and healthcare expenditure as a share of GDP.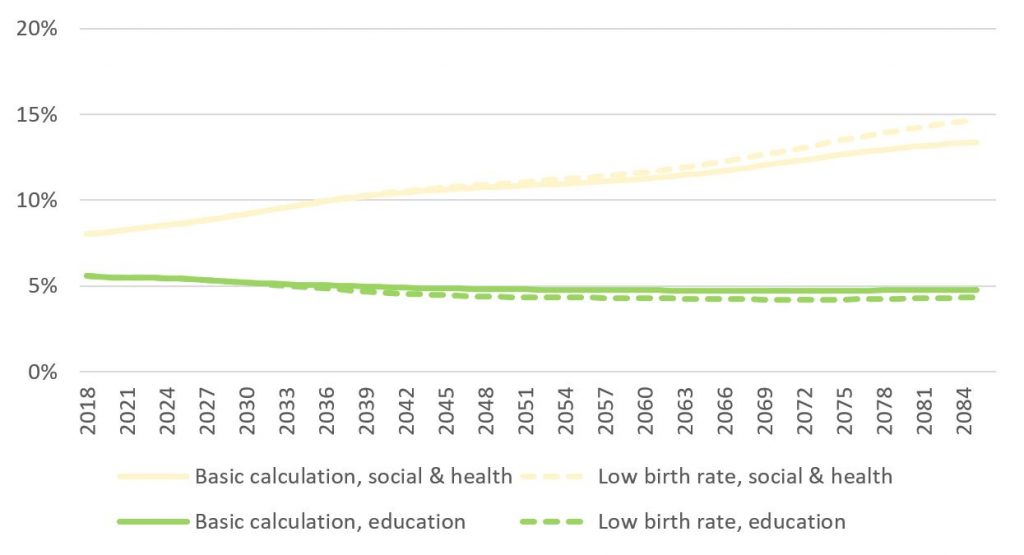
In all, the low birth rate scenario causes an increase of about 0.7 percentage points in the sustainability gap compared to the baseline calculation. This is, however, a significant increase and means that public sector spending would have to be cut or revenue raised immediately and permanently by almost EUR 2 billion due to the fall in the birth rate, to prevent public debt from exploding in the long term. On the other hand, the size of the sustainability gap is already in principle just over EUR 10 billion, so the decline in the birth rate will not change the overall picture of economic policy challenges.
Though the declining birth rate is weakening the financial prospects of municipalities, there is nothing new in that. Regardless, municipalities’ future financial problems will have to be resolved one way or another by the municipalities themselves or by the state. Of course, falling birth rates affect different municipalities differently, and for individual municipalities, a declining birth rate trend can mean big changes. There will also be an imbalance in government revenue and expenditure, although the birth rate decline will help reduce it slightly.
The difference between the different birth rate scenarios is most pronounced in the pension sector.5 For this reason, the following section examines options especially for the pension sector. It is worth noting, however, that the various solutions also end up affecting municipalities and the state. For example, investments to increase the birth rate would probably be covered through health insurance contributions (parental leave) or taxation (child benefits and services for families with children). In terms of immigration, the effects on the earnings-based pension system are likely to be more positive than on the rest of the public sector. Where employment pension rights accrue only through pension contributions, those who are employed least will have equal access to the income transfers and services financed by municipalities and the state.
³ Here, the public sector includes the so-called ‘other social security funds’, meaning those social security funds that are not employment pension institutions. The most important of these are the Social Insurance Institution and the Employment Fund.
4 The 2085 modeling horizon may be problematic in that it takes into account the impact of the declining birth rate on the working-age population, but not yet on the ageing population who are enjoying income transfers and services in large numbers. However, this horizon provides a better view of the effects of the birth rate than the end year of 2070, which is commonly used in sustainability gap calculations.
5 Although, in the basic calculation as a whole, the pension system is in balance.
Possible solutions to the problems that low birth rates create for the pension sector
Who bears the risk?
The problems caused by the low birth rate in terms of financing earnings-based pensions is reflected, among other things, as long-term pressure to increase those pension contributions. Under current legislation, the earnings-based pension system is adapted to changing circumstances by changing the level of contributions when pension expenditure increases in relation to the wage amount. Especially in the long term, other options are also available, and these are described in more detail below.
In the big picture, the problems for pension systems caused by demographic shifts can be solved in different ways depending on how pensions are financed. A significant proportion of statutory pension systems around the world are defined-benefit systems, with working generations bearing the entire risk on behalf of the population. At the other extreme is a fully funded defined-benefit plan, in which the number of payers of the future pension contributions of an individual pension plan does not matter for the financing of pensions.6 In this case, the key risk is the investment risk borne by current and future beneficiaries. There are also many other forms that combine some of these elements.
If total fertility were to return to the level at which it was at the beginning of the millennium (about 1.8 children) in the next few years, the problem of financing the pension system, caused by demographic shifts, would be largely solved.
Finland’s partially funded earnings-related pension system, too, is in between the extremes described above, and future population change does not affect the level of contributions as much as they affect expenditure development. The threshold to make changes to pensions already being paid is quite high in Finland, and the risk for future demographic shifts is carried only by those who are currently working and by future generations. The automatic adjustment mechanisms that are in place, i.e., the life expectancy coefficient and the retirement age linked to life expectancy, also only affect starting pensions.
According to established interpretation, earned pension rights in Finland enjoy protection in the constitution as protected property. For this reason, Finland’s pension reforms have basically only addressed future pension benefits.
In the course of history, however, changes to the indexation of pensions have been made, and, additionally, the indexation of earnings-related pensions was cut by separate decisions during the 1990s recession and for 2015. Permanent indexation changes have been based in part on future demographic and pension expenditure developments, but temporary changes to indexation have been made, especially due to the current economic situation. According to the Parliament’s Constitutional Law Committee, it is essential that the changes do not constitute nominal cuts to pensions.
In some countries, pension index increases are not made if the financial balance is poor. An extreme example is Sweden, where current pensions are automatically flexible according to the financial balance of the pension system. Therefore, in Sweden, also the generation of retirees shares the risks of the pension system, unlike in Finland.
6In a global perspective, pensions worldwide must always be paid out of each year’s production, regardless of how pensions are financed.
Increasing birth rates or immigration
Next, we aim to assess the scope of the changes in birth rates or net immigration that would be required to restore equilibrium in the pension system. We do not seek to assess ways in which birth rates or net migration could be increased, or the cost-effectiveness of those means from the perspective of the state and municipal economies. It is difficult to increase the working-age population by a direct political decision, at least in a way that would clearly strengthen public sector equilibrium.
If total fertility were to return to the level at which it was at the beginning of the millennium (about 1.8 children) in the next few years, the problem of financing the pension system, caused by demographic shifts, would be largely solved. Correspondingly, a lower increase in the birth rate would reduce the problems caused by the falling birth rate but would not eliminate them entirely. The impact of the smaller, already-born generations on the financing of the pension system is limited. In other areas of society, such as education, the size differences of different generational age groups can cause much greater practical difficulties.
Besides the birth rate, another way to create a new population in Finland is to significantly increase net migration. In the basic calculation, 15,000 more people move to Finland each year than leave the country. Net migration could be increased either by increasing immigration or by reducing emigration.
In order for the additional immigration to significantly help public finances, immigration should be based as much as possible on employment. However, from the point of view of financing the earnings-related pension system, any type of immigration is positive or, at worst, neutral. This is because only employed immigrants accrue the earnings-related pensions. Consequently, immigrants who are excluded from the labor market also do not receive an earnings-related pension in due course. Poorly employed immigrants, on the other hand, can push up the spending on national and guarantee pensions over the long term. From the perspective of the entire statutory pension system, the current immigration profile clearly also improves the sustainability of the entire pension system (Tikanmäki et al., 2016; Nopola, 2019). The impact of immigration on the sustainability of public finances as a whole can be either positive or negative, depending on the qualitative factors related to immigration.
In other words, immigration strengthens the financial position of the earnings-based pension system. Today’s immigrants are typically younger working-age people, as well as children. Immigration increases the number of the employed and the amount of wages, even though the employment rates and average earnings of immigrants are lower than those of the native-born population (Nopola, 2019). Immigrants pay pension contributions as soon as they become employed, but on average, the pensions paid to them are only paid much later. Even though immigration increases the Social Insurance Institution’s pension expenditure, it is also calculated to reduce the share of total pension expenditure in the GDP. Due to the higher birth rates among poorly employed immigrant groups, when compared to the rest of the population, the immigration of these groups, too, improves the long-term sustainability of the pension system (Nopola, 2019).
To compensate for the already occurred decline in the birth rate in terms of funding the earnings-related pension system by increasing net migration would require more than doubling net migration. Roughly, this would amount to either a large, 1.5-fold increase in gross immigration or a complete halt in emigration. In practice, net migration could not be doubled without a significant increase in immigration.
This calculation was made using similar assumptions regarding the employment of immigrants as those used in the report by Nopola (2019).
The effects of migration on the national economy are discussed in more detail in the chapter by Mauri Kotamäki. In addition, since the writing of this article, the Finnish Centre for Pensions has published calculations on the effects of immigration on the financing of the pension system (Nopola, 2019).
Other methods
The most useful and natural way to attempt to solve the problems stemming from demographic shifts would be to influence the changes themselves. If this does not succeed, and population development is not the solution to the problems caused by the declining birth rate, the problems of the pension system resulting from population development must be solved within the pension system itself. In practice, this means either increasing pension contributions, changing pension benefits or some combination of the two. A review of retirement benefits could mean changes in, for example, age limits, pension levels or pensions.
In part, the methods presented here have already been adopted. In June 2019, the main labor market organizations agreed on changes to the survivors’ pension system. These changes will reduce the level of the earnings-based pension contribution in 2085 by about 0.4% relative to the amount of wages. As far as sustainable standard contributions, the changes reduce their level by 0.1% of the wage amount. The changes in survivors’ pensions were not taken into account in the calculations presented in this article.
In the basic calculation, if future pressure to increase the contribution in the earnings-based pension system were to be managed by strengthening funding, it would require an immediate increase of the contribution to 26.7%. By using incremental funding increases, it would be possible to ease the pressure to increase contributions in the latter half of this century. The more even the development of the pension contributions, the more evenly the contribution burden is applied across generations.
The observed decline in the birth rate is such a significant social upheaval that the solution to the problems it brings cannot be found in one measure alone.
Employment is typically in a central role when trying to improve the long-term balance of the public sector. Increases in employment also ease the financial position of earnings-based pensions over a few decades, but for the pension system, this is not a suitable solution for addressing population development over the long term. If the resources made available by improved employment were used to strengthen funding, employment growth could be of partial use in long-term financing challenges. This kind of measure would require passing a separate decision regarding additional funding.
One way to respond to demographic and economic changes would be to introduce automatic adjustment mechanisms to the pension system so that it would automatically respond to changes in, for example, birth rates or the economic situation. This was proposed by Jukka Rantala, the CEO of the Finnish Centre for Pensions, who has since retired, in his blog post published on 29 March 2019 (Rantala, 2019). Automatic mechanisms could involve both benefits and funding. The automatic adjustment mechanisms would make developments related to the pension system more predictable and reduce the system’s exposure to political risks in a changing operating environment.
Of course, it is also possible that something like investment returns or some other economic factors turn out to be significantly better than anticipated, and that demographic problems will never materialize as acute problems in the pension system. On the other hand, it is also possible that investment returns will be lower than expected or that economic development in general turns out to be worse than what is assumed here. In that case, the pension system’s financial problems that stem from the low birth rate would be even worse than presented here. In stochastic investment return calculations, the width of the 50% confidence interval for an earnings-based pension payment over a 30-year time span is more than five percentage points. More about the significance of the annual variation in investment returns can be found in Sankala et al. (2018).
In terms of size, the impact of investment income on the financing of earnings-based pension pensions is even more significant than that of population factors. The good news is that good long-term investment returns help lower earnings-based pension contributions more than bad returns help increase them. This is because, with good returns, funds grow at the same time as their importance becomes highlighted. On the other hand, in the case of poor returns, the earnings-based pension contribution never rises above the pension expenditure.
The age of retirement, for example, may also develop differently than what is assumed in these calculations. It makes no sense, however, to base the sustainability of the pension system or public finances as a whole on wishful thinking.
The overall decline in the birth rate should be taken seriously, but there is no point in trying to find quick solutions. The effects on the pension system and on the sustainability of public finances as a whole will be significant if the low birth rates are permanent. The consequences should be considered analytically, and any possible measures should be based on the best available research and expert information. It would be wise not to delay these decisions for too long, as this will limit the options that are available and also reduce the impact of possible policy measures. The observed decline in the birth rate is such a significant social upheaval that the solution to the problems it brings cannot be found in one measure alone.
References
Economic Policy Council (2018). Economic Policy Council’s Report 2017. Retrieved from https://www.talouspolitiikanarviointineuvosto. fi/wordpress/ wp-content/upload/2018/04/Raportti2017.pdf
Economic Policy Council (2019). Economic Policy Council’s Report 2018. Retrieved from https://www.talouspolitiikanarviointineuvosto.fi/wordpress/ wp-content/uploads/2019/04/Raportti2018.pdf
Hellstrand, J. (2018). All-time low period fertility in Finland: tempo or quantum effect? (Master’s thesis, University of Helsinki).
IndexMundi (2019). Retrieved from https://www.indexmundi.com/g/g.aspx?c=ks&v=31
Kautto, M. & Risku, I. (eds.) (2015). Laskelmia vuoden 2017 työeläkeuudistuksen vaikutuksista. Finnish Centre for Pensions Reports 02/2015.
Ministry of Finance (2018). Valtiovarainministeriön kestävyysvajelaskelmien menetelmäkuvaus. Talouspolitiikan valmisteluun liittyvät selvitykset, muistio 79/02.01.00.99/2018. https://vm.fi/dms-portlet/document/0/596576
Ministry of Finance (2020). Suomen julkisen talouden kestävyys. Valtiovarainministeriön julkaisuja 2020:59. http://urn.fi/URN:ISBN:978-952-367-287-1
Nopola, T. (2019). Skenaariolaskelmia muuttoliikkeen vaikutuksista eläkejärjestelmän kestävyyteen. Finnish Centre for Pensions Reports 09/2019.
Nopola, T. & Tikanmäki, H. (2020). Syntyvyysskenaarioiden vaikutukset työeläkkeiden rahoitukseen. Finnish Centre for Pensions Reports 01/2020.
Rantala, J. (29.3.2019). Uudet eläkelaskelmat antavat aihetta pohdintaan [blog]. Retrieved from https://www.etk.fi/blogit/uudet-elakelaskelmat-antavat-aihetta-pohdintaan/
Reipas, K. (2019a). Korjaus raportin Lakisääteiset eläkkeet – pitkän aikavälin laskelmat 2019 laskelmiin. Retrieved from https://www.etk.fi/wp-content/uploads/2020/03/Korjaus-raportin-Lakisaateiset-elakkeet-–-pitkan-aikavalin-laskelmat-2019-laskelmiin.pdf
Reipas, K. (19.3.2019 [2019b]). Ennustelaskelma ei ole ennuste [blog]. Retrieved from https://www.etk.fi/blogit/ennustelaskelma-ei-ole-ennuste/
Reipas, K. (2019c). Vaikutusarvio työmarkkinajärjestöjen 11.6.2019 sopimuksen perhe-eläkemuutoksista. Retrieved from https://www.etk.fi/wp-content/uploads/2020/07/Vaikutusarvio_tyomarkkinajarjestojen_11_6_2019_sopimuksen_perhe-elakemuutoksista.pdf
Reipas, K. (2019d). Tilastokeskuksen 2019 väestöennusteeseen pohjautuva pitkän aikavälin eläkelaskelma. Retrieved from https://www.etk.fi/wp-content/uploads/2020/03/Tilastokeskuksen-2019-vaestoennusteeseen-pohjautuva-pitkan-aikavalin-elakelaskelma.pdf
Reipas, K. & Sankala, M. (2015). Laskelmia vuoden 2017 työeläkeuudistuksen vaikutuksista – Hallituksen esitykseen perustuvat arviot. Finnish Centre for Pensions Reports 02/2015.
Risku, I., Elo, K., Klaavo, T., Lahti, S., Sihvonen, H. & Vaittinen, R. (2011). Lakisääteiset eläkkeet – pitkän aikavälin laskelmat 2011. Finnish Centre for Pensions Reports 05/2011.
Sankala, M., Reipas, K. & Kaliva, K. (2018). Sijoitusriskien vaikutus TyEL:n rahoitukseen. Finnish Centre for Pensions Reports 05/2018.
Sopimus vuoden 2017 eläkeuudistuksen jatkoneuvotteluihin liittyvistä asioista (11.6.2019). Retrieved from https://ek.fi/wp-content/uploads/Sopimus-vuoden-2017-elakeuudistuksen-
jatkoneuvotteluihin-liittyvista-asoista.pdf
Statistics Finland (2018). Population forecast 2018–2070. Retrieved from http://www.stat.fi/til/vaenn/2018/vaenn_2018_2018-11-16_tie_001_fi.html
Statistics Finland (2019a). Population structure. Retrieved from http://www.tilastokeskus.fi/til/vaerak/tau.html
Statistics Finland (2019b). Population projection 2019-2070. Retrieved from http://www.stat.fi/til/vaenn/2019/vaenn_2019_2019-09-30_tie_001_fi.html
Statistics Finland (2020). Väestön ennakkotilasto. Retrieved 2 Apr 2020 from https://www.stat.fi/til/vamuu/2019/12/vamuu_2019_12_2020-01-23_tie_001_fi.html
The Human Fertility Database (2019). Retrieved from https://www.humanfertility.org/
Tikanmäki, H., Appelqvist, J., Reipas, K., Sankala, M. & Sihvonen, H. (2016). Lakisääteiset eläkkeet – pitkän aikavälin laskelmat 2016. Finnish Centre for Pensions Reports 08/2016.
Tikanmäki, H., Lappo, S., Merilä, V., Nopola T., Reipas, K. & Sankala, M. (2019). Lakisääteiset eläkkeet – pitkän aikavälin laskelmat 2019. Finnish Centre for Pensions Reports 02/2019.
World Bank (2019). Retrieved from https://data.worldbank.org/indicato/SP.DYN.TFRT.IN
The greying of Japan – what kind of example does it offer for Finland? (Risto Vaittinen)
Among industrialized nations, Japan is a pioneer when it comes to an ageing population. As the first high-income nation, its population began to decline in 2009 as a result of low birth rates. The working-age population had already begun to shrink fifteen years earlier. The share of the old-age population has also expanded significantly due to a rapid increase in life expectancy. From the perspective of economic activity, a lower birth rate is initially a positive occurrence, as fewer children require fewer resources committed to their maintenance. Over time though, the shrinking generations can turn into a problem. When large age groups leave the labor market, their maintenance will remain at least partly the responsibility of the smaller age groups, either within the multi-generational family community or through intergenerational income transfers in public spending. The maintenance burden on the smaller age groups is manifested as relatively larger intergenerational income transfers.
For most high-income countries, the kinds of characteristics of demographic change that derive specifically from a low birth rate are still far in the future. Therefore, it is interesting to examine the speed at which the ageing Japan has managed to succeed in the present millennium, compared to other high-income countries that are in a much better position than Japan in terms of the population dependency ratio.
This chapter begins with a description of Japan’s demographic development after World War II. The change in the age structure of its population is examined using the old-age dependency ratio, and by comparing the development of Japan’s age structure with that of other high-income countries. Demographic change there has been much more dramatic than in most industrialized countries, where immigration has compensated for the impact of lower birth rates. Since Finland will, in the near future, be one of the world’s leaders when it comes to ageing, the aim is to assess the extent to which Finland’s developments resemble those of Japan, and what in its recent history we here in Finland should take note of when assessing the prospects for our own future.
The economic effects of demographic change are illustrated by using a simple macroeconomic framework. It describes the change in living standards in terms of per capita GDP. Growth in living standards is divided into factors consisting of labor productivity and the share of the employed population.
Japan has adapted to the rapid demographic shift by increasing employment participation. Although the working-age population has declined sharply, the number of employed people has increased due to increased participation in the labor market. In terms of demographic change, Finland and other European countries are still only at the beginning of the journey toward Japan’s current old-age dependency ratio. Nevertheless, Europe, too, has begun to respond to the decline in the dependency ratio, in particular by increasing the employment
rate of its older workers, although on a completely different scale than in Japan.
The period of strong demographic change in Japan has been marked by a number of economic crises to which it has adapted through countercyclical fiscal policies. Expansive fiscal policy, coupled with strong growth in age-related spending, has increased public debt in Japan at a rapid pace. The countercyclical fiscal policies, however, have enabled employment growth and thus facilitated adjustment to demographic change.
Regarding population change in Japan
Japan currently has the world’s oldest population, whether measured by median age, population over 65 or old-age dependency ratio (UN, 2019). Japan’s population grew at an annual rate of more than one percent since World War II until the mid-1980s. Since then, growth has slowed sharply until, by the 2010s, the population began to decline (Figure 1). The number of children under the age of 15 has been declining since the early 1980s, and the working-age population (15–64 years), as commonly defined in demographic statistics, began to decline in the mid-1990s. The country’s population is projected to decline from the current 125 million by more than 20 million, or nearly a sixth, over the next three decades.
After World War II, the share of the elderly population (over 65) was less than five percent. As the working- age population began to decline in the 1990s, the share of older people tripled compared to the immediate post-war period, and as the entire population began to decline, older people came to comprise just over onefifth of the population. At present, the relative proportion of people over 65 is 28% and, according to the latest UN population forecast, will stabilize at around 38% by mid-century. At that time, their number is projected to be 40 million, alongside 53 million working-age people and 20 million children under 15. There will be nearly as many dependents (non-working-age people) at that time as there are people of working age.
The ageing and numeric decline of the population are results of the sharp drop in the birth rate following World War II as well as increased life expectancy. The post-war baby boom in Japan lasted only a few years. At that time, total fertility, i.e., number of children per woman of childbearing age, rose to the level of almost 4.5 children, from which it fell within ten years to near the population replacement level (2.05). The birth rate remained at this level up until the mid-1970s, after which it has fallen steadily, reaching the level of 1.25 children in 2005. From this level, it has since risen to 1.4 children (Ogawa, Mason, Chawla & Matsukura, 2010).
At the same time, the average life expectancy of a newborn has risen from 52 years in 1947 by more than thirty years to 84 in 2016 (National Institute of Population and Social Policy Research, 2019). In other words, life expectancy has increased by an average of more than four years per decade.
Net migration to Japan has at times dipped into the negative and, in relation to population size, is at best mere fractions of the corresponding figures for the US or the EU15, for example (UN, 2019). As a result of the prolonged low birth rate and net migration, the downward trend in demographic development would not change even if overall fertility were to return immediately to the population replacement level (Lanzieri, 2014). According to Lanzieri’s calculation, the population would be seven percentage points lower in 2060 than its highest level. In the UN population forecast, Japan’s population is predicted to decline throughout the forecast period until 2100. Through the middle of the century, the working-age population will decline on average by more than one percent annually, but therate will slow to 0.7% in the second half of the century. The ageing population will increase somewhat until the century’s midpoint, but eventually it, too, is projected to begin to shrink.
Figure 1. Demographic change in Japan, 1950–2050
Source: World Population Prospects, UN, 2019.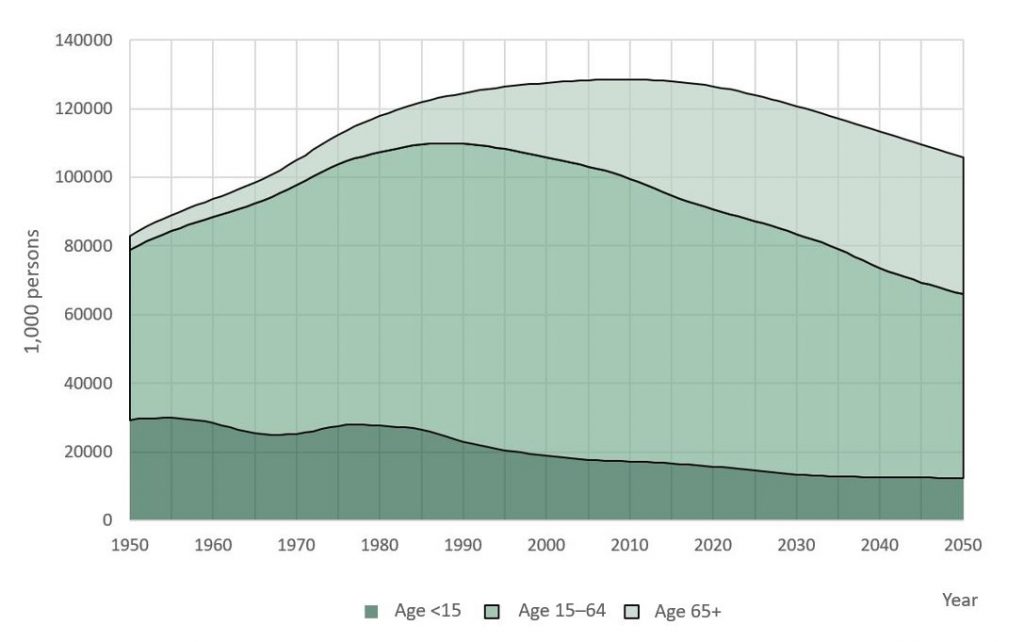
Figure 2. Old-age dependency ratio from 1990 to 2050 in countries with the oldest populations.
Source: World Population Prospects, UN, 2019.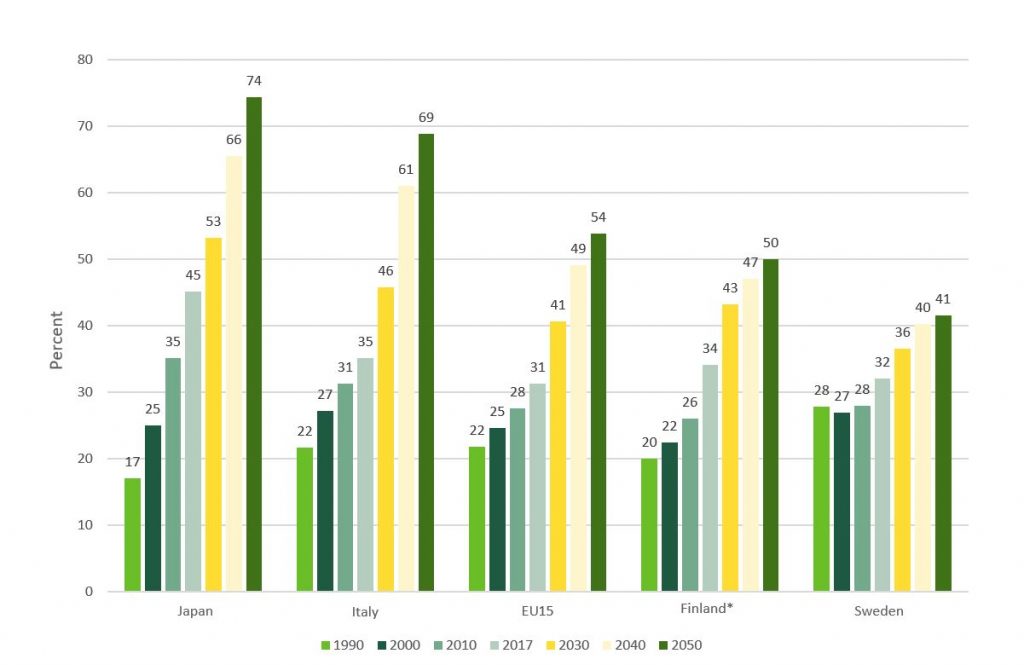
What is confounding about Japan’s old-age dependency ratio is not only its current level and expected development, but also the pace at which the current situation has emerged.
How dramatic demographic change has been in Japan becomes evident when comparing the development of its old-age dependency ratio to that of countries that were the world’s oldest in the world in 2017 by using that same measure. In accordance with established practice, the old-age dependency ratio is described as the percentage of the population aged 65 as a percentage of those aged 15-64. Measured in this way, in 2017 there were 45 elderly people per 100 working-age people in Japan. The second-highest proportion of elderly people in the world in relation to those of working age was in Italy (35) and the third-highest was in Finland (34). In addition, the comparison in the figure looks at a group of countries that were members of the European Union before its eastward expansion. In addition to Italy, Sweden as an individual country in 1990 was the oldest in the world in terms of its old-age dependency ratio. At present, Sweden’s old-age dependency ratio is near the EU15 average, but due to higher birth rates and immigration, the demographic structure there will not be nearly as unfavorable in the future as it will be in the high-income EU15 countries on average. The population structure of the EU15 countries will become more unfavorable than that of Finland in the 2040s.
What is confounding about Japan’s old-age dependency ratio is not only its current level and expected development, but also the pace at which the current situation has emerged. Of the reviewed countries, Japan was the youngest in 1990. In less than thirty years, the number of elderly people there has risen by almost thirty in relation to one hundred working-age people. The second- fastest ageing has occurred in Finland, where the number of elderly people in relation to one hundred working-age people has increased by fourteen during the period under review. The relative change has been half of that in Japan. Finland’s ageing has been nearly as fast as Japan’s in this decade, but the startinglevel was more favorable in Finland. In 2017, Finland reached the same old-age dependency ratio that prevailed in Japan about ten years earlier, although in 1990, the initial year of the review, Japan had a clearly younger population than Finland. Even though the ageing of Finland’s demographic structure has been rapid in European terms, it has been moderate compared to Japan.
If the ageing of Japan’s population has been remarkably rapid, it has been almost non-existent in Sweden, with the exception of the past decade. Sweden’s population in 1990 was clearly the oldest among the surveyed countries but is currently the least aged, even though Sweden is the eighth-oldest country in the world in terms of the measure used. High birth rates and immigration explain Sweden’s relatively stable and, in a European context, favorable population structure.
In the last year of observation (2017), measured by the old-age dependency ratio, the other countries in the comparison are relatively close to each other, at the level at which Japan was ten years earlier. The comparison includes estimates of dependency ratios based on the UN population forecasts for 2030, 2040 and 2050. Based on these, it would appear that in 2030, Italy and Finland would reach roughly the dependency ratio that Japan had in 2017. After this, demographic development in Italy begins to resemble the projected development of Japan. In the other countries in the comparison, Sweden in particular, ageing appears toslow down when viewed in relation to Japan, although the dependency ratio will deteriorate in all comparison countries throughout the reviewed period.
How does population structure affect living standards?
The most straightforward way to look at the economic impact of demographic change is to assess its contribution to per capita gross domestic product (GDP), which is the most widely used measure of the general standard of living in the national economy. It relates the total value of goods and services produced in the national economy during the year to the size of the population. The relationship between living standards and population structure can be examined by presenting per capita output as the product of income from labor productivity and the labor force relative to the population:
GDP / POPULATION = GDP / EMPLOYED X EMPLOYED / POPULATION (1)
Labor productivity is obtained by dividing GDP by the number of employees. The share of the employed population can still be expressed as the product of the share of the working age population and the employment rate:
GDP / POPULATION = GDP / EMPLOYED × EMPLOYED / WORKING-AGE × WORKING-AGE / POPULATION (2)
If labor productivity and the employment rate do not change, we see from the equation (2) that a change in the share of the employed population determines a change in living standards. At a given level of productivity and rate of employment, output grows at the same pace as the growth of the working-age population. As the number of people of working age grows faster than the population, output and income per capita increase, although there are no changes in other fundamentals of the economy. Increased incomes also allow for an increase in per capita consumption. Next, we use this simple framework to compare Japan’s demographic and economic development with those of the EU15 and Finland.
How is Japan’s declining old-age dependency ratio reflected in relative living standards?
In this millennium, the working-age population in Japan has declined by an average of 0.7% annually. Before the financial crisis, the decline averaged 0.4% annually but has accelerated to an annual rate of one percent. The decline in the working-age population has been clearly faster than in the comparison countries. Japan’s performance in meeting the challenge of demographic change is assessed by examining its economic development in Finland and the EU15 (Figure 3). The comparison examines the development of labor productivity, the employment rate and the share of the working-age population (15–64 years) in the components of per capita GDP in the current millennium. To facilitate the review, all the variables in the equation (2) have been normalized to the level of the base year (2000), where their values are indexed to 100.
The working-age population index in Japan has fallen from 100 to 88, or 12%. Demographic trends have also been unfavorable in the comparison countries, but nowhere near on the scale of Japan’s. In Finland, the share of people of working age has fallen by seven percent, and in the EU15 by four percent. In all three reference areas of this review, rising employment rates have wiped out the negative impact of demographic change on living standards.
The first surprise in the comparison is probably that, despite the uphill challenge stemming from the demographic shift, Japan has outperformed the comparison countries in terms of per capita GDP. In Japan, per capita output was almost 30% higher than at the turn of the century. In the EU15, only half of this has been achieved, and in Finland, too, growth has been just under 20%.
In addition to average differences in growth, the chronological distribution varies by region. The recession that followed the 2008 financial crisis was a long one in Europe. Output per capita reached a pre-crisis level in the EU15 in 2015, and Finland has still not reached this level. However, the drop in production was the sharpest in Finland. In Japan, the slowdown was more short-lived than in the comparisons, and economic growth there has returned to a near-pre-crisis trajectory.
The increase in labor productivity is obviously the main factor explaining the change in living standards. It has been, on average, clearly fastest in Japan, but also steadiest over time. In Finland, labor productivity grew by far the fastest before the financial crisis but came to a seven-year standstill after the crisis began. In the EU15 area, the decline in productivity resulting from the crisis was notably more moderate, but also the average growth rate has remained modest.
Figure 3. Increase in living standards and its components.
Source: Conference Board Database, 2019, UN World Population Prospects, 2019, and own calculations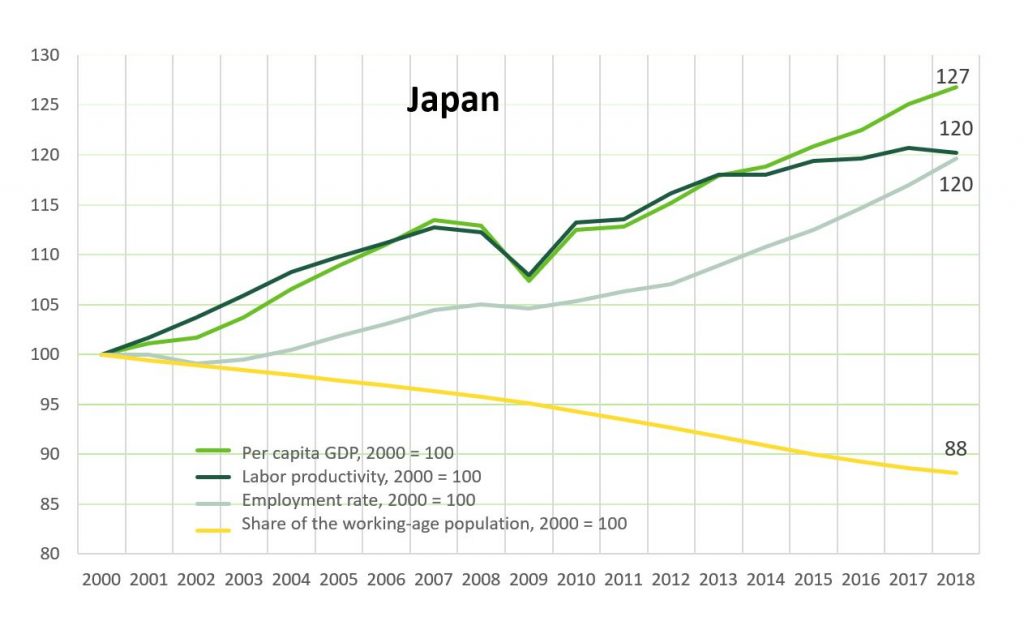
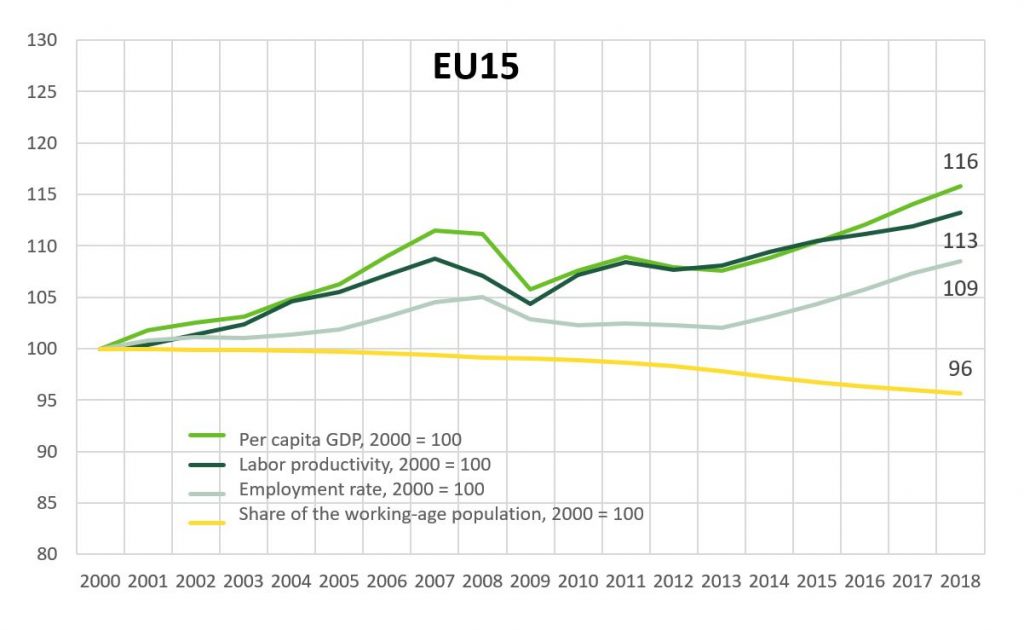
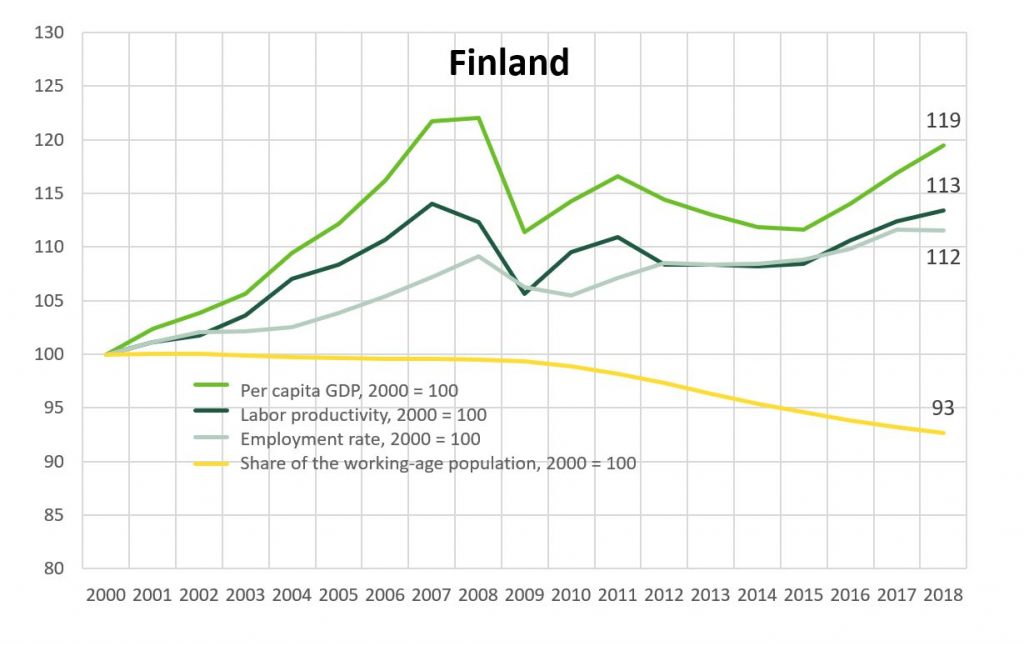 Looking at the entire period, labor productivity has grown at the same rate in both Finland and the EU15 area on average. Finland’s somewhat faster output growth per capita is explained by better development of employment. The share of the working-age population in both regions has decreased, but much more so in Finland. Finland’s less favorable demographic development in relation to the EU15 region has been compensated by a better development of the employment rate.
The employment response to population development in Japan
Japan’s positive development is perhaps surprising in light of the economic preconditions imposed on it by the population. In Japan, the decline in the working-age population has been offset by rising employment rates, especially among women, but also among the elderly and retired population. The number of the employed in relation to those of working age has increased by an average of one percent over the entire review period, while at the same time the number of working-age people has decreased by 0.7%. The growth of the employed in relation to the working-age population has been particularly rapid in the period following the financial crisis, with the number of working-age people decreasing at an annual rate of one percent.
The number of employed people in Japan increased by two million between 2000 and 2018. This is quite an achievement in a country whose working-age population (15–64 years) is simultaneously shrinking by ten million. Overall, male employment declined, but female employment increased by more than three million (Statistics of Japan, 2019).
The employment rate for women aged 25–54 in the best working age rose by 13 percentage points, and for older women aged 55–64 by as much as 15 percentage points. Employment rates for women of retirement age also rose by just over 10 percentage points. Employment growth has been mainly driven by higher employment among women. For men, employment has risen mainly in the elderly and retirement-age groups.
In Japan, the labor participation of people who are of retirement age and earning pension income is exceptionally common compared to other high-income countries (OECD, 2017). The employment rate for men over the age of 65 is currently 60% and has risen by 10 percentage points over the last five years.
Although Japan’s population as a whole has declined in recent years, the number of people over the age of 55, especially those of retirement age, has increased. As both the employment rate and population numbers have increased in these age groups, the number of employed people has experienced strong growth. In particular, the number of retirement-age people in the labor market has increased. Employment growth has been focused mainly in the area of healthcare, but also in other services, such as education. The improvement in women’s employment rates has hardly narrowed the significant gender pay gap, and it has also contributed to an increase in the number of temporary employment contracts (Kawakuguchi & Mori, 2017).
In Finland, too, the increase in the employment rate has been based mainly on the increased work participation of the elderly or retirement-age population. The number of the employed in Finland increased by 270,000 during the review period, of which 220,000 is the result of an increase in the employment of people over 55 years of age. Without the increased employment of older people, Finland’s employment numbers would have declined in this millennium.
In terms of employment rates among men, Finland has lagged behind Japan in all age groups throughout the period under review. Japan’s employment rates for men in the best working age have been five percent higher than in Finland. In Japan, the employment rate for men aged 55–64 has reached the level of those aged 25–54 in Finland. The employment rates for women, excluding those of retirement age, were clearly lower
in Japan than in Finland in the beginning of the millennium. Now, those differences have nearly vanished. Viewing employment in Japan by age group shows strikingly high employment rates for retirees among both men and women: the employment rate of people of retirement age is 60% for men and 38% for women. The corresponding figures for Finland are 14% and eight percent.
Figure 4. Employment rates in Japan and Finland.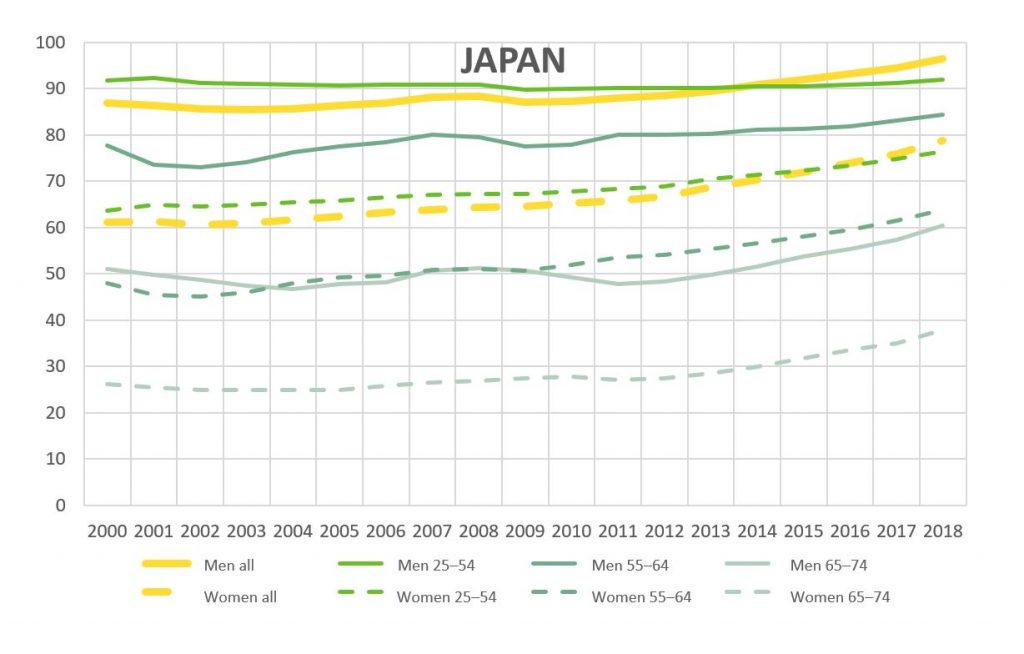
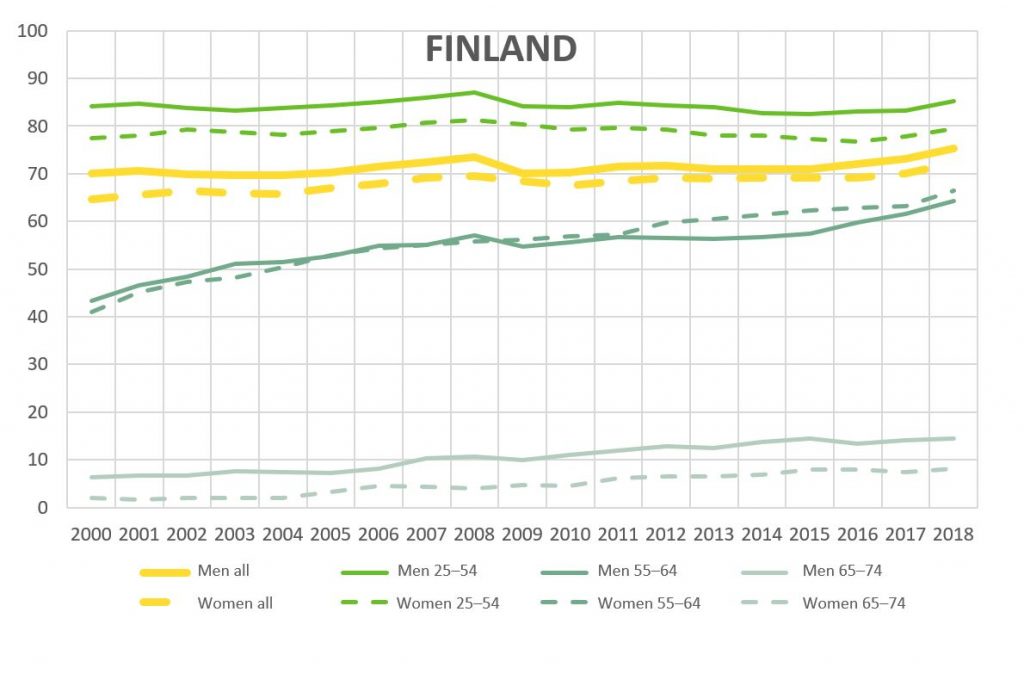 In Japan, for the population of 65 and older, wages accounted for almost 40% of their income and pensions for just over 50%. In Finland, the corresponding figures were 10% and 80% (OECD, 2018). According to OECD estimates (2018), the pension replacement ratio (the ratio of pension to wages) was 34.6% in Japan for average-salaried, full-time employees, compared to 56.6% in Finland. The difference in the significance and amounts of statutory pensions is also reflected in total pension expenditure. In Japan, pensions were 10.2% of the GDP in 2016 and in Finland 13.1%, when the old-age dependency ration for the same year was 43.9 and 35.1, respectively.
Although the proportion of the retired population in Japan relative to the working-age population is substantially higher, their retirement income is significantly lower relative to the gross national income. The meagerness of pension security in part contributes to the poverty among the elderly. Of Japanese over the age of 65, 19% live on less than half of the median household income. The corresponding figure in Finland is just over five percent, compared with the OECD average of 12.3% in 2015 (OECD, 2018).
The impact of Japan’s population structure on productivity growth
Although the employment rate in Japan has improved significantly, living standards would have fallen had labor productivity not increased. Thanks to an average annual growth rate of one percent in labor productivity, Japan ranks number one in terms of growth in living standards. Labor productivity and changes therein are explained by technological development and the subsequent adoption of new technologies, as well as investments in production capacity and the quality of the workforce.
As the relative size of the working-age population increases, living standards rise without the need to increase productivity and the employment rate. This phenomenon, described already earlier in this article, is termed the first demographic dividend (Mason, 2007). Part of the increased output can be invested in tangible or human capital without having to reduce per capita consumption. This makes it possible to raise the level of labor productivity and achieve an effect on living standards that complements the growth of the relative share of the labor force. This is what Mason calls the second demographic dividend.
In a situation where women’s overall fertility is well above the replacement level, a decline in the birth rate will slow down population growth in such a way that the relative share of the working-age population increases. A declining birth rate gives rise to the first demographic dividend. This is inevitably a transient phase, because as the smaller age groups resulting from low birth rates reach working age, some of the larger age groups are already transferring out of employment. If the decline in the birth rate is permanent, the share of the working-age population will soon begin to shrink, as is currently the case in Japan. While the first demographic dividend is temporary, investing part of Perspective its output into education and production capacity can yield a long-term effect on improved living standards.
Ogawa et al. (2010) have studied both the first and second demographic dividends in Japan. As a result of the differences in income and consumption distributions related to the population’s age structure, they have estimated that the income-increasing effect of the first demographic dividend occurred between 1950 and 1980. At its highest, it boosted revenue growth by one percentage point per year. The effect was at its highest when the ratio of the employed to the population peaked in 1969. The negative dividend resulting from the shrinking share of the working-age population began to intensify starting in the 1990s. According to their estimate, it will be at its strongest in the mid-2030s. The income-reducing effect of the negative dividend is correspondingly at about one percentage point.
The beginning of the second demographic dividend, according to Ogawa et al. (2010), coincides with the second half of the 1970s. They estimate that it peaked in the early 1990s, when it was raising annual incomes by nearly 1.5% per year. In terms of duration, this dividend has been longer-lasting and will continue until the middle of this century. However, its effect during our millennium is at its highest at about half a percent and approaches zero at the end of the review period, in 2050. In their assessment, however, the investments of the second demographic dividend that raise labor productivity will not at any stage in the 2000s compensate for the decline in living standards that is caused by the contraction of the working-age population.
The second demographic dividend has mitigated but not eliminated the negative economic effects of population ageing. In Japan, the birth rate fell rapidly after the war from extremely high levels, which is why the dividend it has brought has also been significant. In part, it helps explain Japan’s relatively positive development.
Assessing the effects of demographic change using a comprehensive country comparison, Acemoglu and Restrepo (2017) conclude that if there is any observable empirical relationship in the considered material between population age structure and per capita GDP growth, it is more positive than negative. In the context of a decline in population, the effects of the first and second demographic dividend can trend in different directions. This contributes to a positive dependency between an ageing population and changes in living standards. However, Acemoglu and Restrepo emphasize that the shortage of labor due to ageing results in the selection of less labor-intensive production methods. The ageing of the population accelerates automation and increases labor productivity. This is evident both in international industry–country comparisons and on the basis of more detailed data on areas of employment from the United States.
Acemoglu and Restrepo (2019) have verified that in countries where demographic change has led to a larger decrease in the relative share of the middle-aged labor force compared to controls, this scarce resource has been replaced by the automation of production processes. They are able to explain 40% of the variation in the number of production robots in relation to the labor force by differences in the age structure of the labor force.
In countries with an ageing population, shrinking labor and high wages have led to the automation of production and an increase in labor productivity. However, Acemoglu and Restrepo have examined this phenomenon only in terms of industrial production that is suitable for the robotization of production processes, and not more comprehensively, for example in terms of digitalization and use of artificial intelligence. Their results help to explain the unexpected finding that population ageing does not (at least to date) appear to have had a negative impact on per capita GDP.
The significance of ageing for Japan’s public finances
A significant part of public spending, including statutory pensions and healthcare and care services, is connected to age. As the population ages, this brings challenges to balancing public finances. If tax rates are not to be raised, without expenditure-based reforms or cuts in other public spending, an ageing population will lead to increased public debt. In addition, the tax base may shrink as economic growth slows down with the labor supply declining through ageing. In addition to expenditure growth, declining revenues are likely to reduce the sustainability of public finances.
Figure 5. Total public sector revenue and expenditure and net debt in Japan, 1990–2015, relative to GDP.
Source: OECD, 2019.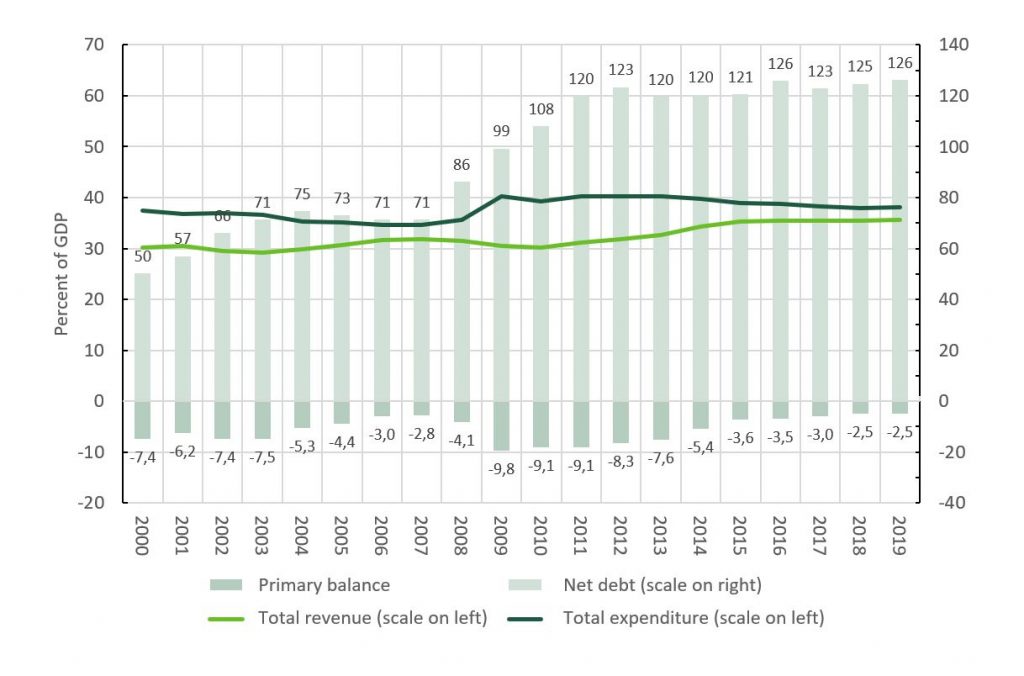 In Japan, public sector revenue as a share of GDP has remained largely constant, near 30% between 1995 and 2010. Since then, the tax rate has risen by about five percentage points. Public spending, on the other hand, has undergone a two-stage shift. First, spending rose from 30% to 35% in the mid-1990s, and by the 2010s, spending relative to GDP had risen to almost 40%. In other words, public finances have had a significant deficit for the last 25 years.
The largest gap between expenditure and revenue was 10%, in 1998 and 2009. In 1998, the currency crisis that mostly affected emerging Asian economies, was also reflected in Japan, where output declined, which is manifested in relative growth in expenditure. The expenditure ratio responded similarly to the 2008 financial crisis, which was reflected in a sharp drop in output in the real economy in 2009.
At the same time, net public debt has risen from almost zero to 120% (Figure 5). Net debt was selected in the figure to describe the evolution of indebtedness, because it is a better reflection of the financial position of the public sector than gross debt, which currently stands at 230% (OECD, 2018). In describing the government financial position, net debt is a better indicator because publicly financed pensions are partially funded. The Japanese government owns significant amounts of non-pension securities and real estate (Wakatabe, 2015). Even in terms of net debt, Japan is a highly indebted country. In 2015, of the OECD countries only Greece had more debt, although Italy’s borrowing was nearly as large (119%).
A significant portion of social expenditure (unemployment, healthcare and pensions) is organized according to the principle of social insurance, where employees, employers and the state all contribute to the financing (National Institute of Population and Social Security Research, 2014). In Japan, public sector social spending as a share of GDP more than doubled between 1990 and 2014. Where in 1990 it was about 10%, in 2014 it reached a level of nearly 22%. Pensions relative to GDP have doubled from 5.2% to 10.5%. In healthcare, the growth was not quite as significant, but long-term care has risen from zero to almost two percent.
Table 1. Development of social expenditure in Japan 1990– 2014 (% of GDP).
Source: Jones & Fukawa, 2017
| 1990 | 2000 | 2014 | |
| Total expenditure | 10.2 | 14.8 | 21.6. |
| Pensions | 5.2 | 7.8 | 10.5 |
| Healthcare | 4 | 5 | 7 |
| Long-term care | – | 0.6 | 2.4 |
| Other | |||
| Total payments | 12 | 15.1 | 21.2 |
| Insurance premiums | 8.5 | 10.4 | 12.6 |
| – Insured | 4 | 5.1 | 6.6 |
| – Employers | 4.5 | 5.4 | 6 |
| General government | 3.5 | 4.8 | 8.7 |
| – The state | 2.9 | 3.7 | 6.1 |
| – Regional government | 0.6 | 1 | 2.5 |
Overall, the financing of social expenditures was in surplus in 1990. At that time, the system’s premiums totaled 12% of GDP, but expenditure was only 10%. Insurance premiums accounted for 8.5% of financing, and general government transfers covered 3.5% of expenditure (Table 1). In 2014, the system was slightly in deficit. Insured premiums have risen by 4.1 percentage points and general government contributions by 5.2 percentage points of GDP. The difference between total government expenditure and revenue was 5.4% that year. If the government’s contribution to social expenditure had remained at the 1990 level, general government revenue and expenditure in 2014 would have been more or less in balance. Since then, the deficit has fallen to below three percent, due to tax increases and spending cuts.
For its part, the rapid rate of indebtedness of Japan’s public finances has been a reaction to the deflation that followed the financial crisis of the early 1990s. The liberalization of capital markets in the late 1980s was followed by a sharp rise in stock and real estate prices, which the Bank of Japan tried to curb with significant interest rate hikes. This led to the bursting of the speculative bubble in the real estate and stock markets and to the collapse of asset values, followed by a fall in consumer prices, which the central bank was unable to stabilize through its monetary policy. The country drifted into deflation at a time of slow economic growth and falling nominal prices. Although GDP grew in real terms, its nominal value did not increase much during the 1990s. Amid falling prices, efforts were made to maintain demand by increasing the general government deficit. Fiscal expansion was needed to stabilize the macroeconomy as demographic change was becoming unfavorable.
In Japan, the pressure to increase public spending as a result of the demographic shifts has coincided with a period of slowing global economic growth, declining demand making it more difficult to adapt to the challenge of demographic changes. Industrialized economies stuck in prolonged secular stagnation seem to have drifted into a state where real interest rates compatible with full employment and capital market equilibrium are extremely low or even negative (Kuusi, 2015). The slowdown in labor force growth or even contraction due to ageing has reduced the need for investment, as companies adapt the growth of their production capacities to slow or non-existent developments in employment. This lowers the investment rate and reduces the demand for capital. On the other hand, the increase in life expectancy relative to retirement age has increased people’s preparedness for a longer retirement age. This in turn has increased the rate of savings and the supply of capital. The decrease in the investment rate and the increase in the rate of savings resulting from the changing age structure contribute to the lowering of market-stabilizing levels of interest rates.
The room for maneuvering that low interest rates have brought about has introduced new characteristics to the process of outlining the future paths of development in Japan’s public finances. In its country report, the OECD has estimated that the general government surplus, i.e., the difference between revenue and expenditure excluding interest expenditure, would have to be in a 2.5% surplus in order to stabilize debt at a sustainable level over a meaningful period (OECD, 2017). The deficit is currently just under three percent of GDP. Based on this estimate, the need for revenue and expenditure adjustment required to stabilize government debt would be more than five percent of GDP.
Olivier Blanchard, a former chief economist at the Perspective International Monetary Fund, and his Japanese counterpart (Blanchard & Tashiro, 2019) have suggested that under the current interest rate regime, Japan could maintain a small budget deficit without disrupting debt sustainability. Public spending should nevertheless be refocused in a direction that supports long-term economic growth. They propose reallocating spending to infrastructure investments, which have fallen to low levels, and to family policy. In this, they reference a study (Japan Center for Economic Research, 2014) that estimates that a French-type investment in families could increase the birth rate and stabilize the now perpetually declining population at a level of 90 million.
The proportion of Japan’s elderly population is projected to grow from the current nearly 30% to 40% by 2060. Demographic change is projected to increase age-related public expenditure connected to old age from 19.5% to 26.5% of GDP over the same period. Pension expenditure is projected to increase by less than one percentage point, but healthcare expenditure is estimated to increase by 2.5 percentage points and longterm care by 3.5 percentage points (OECD, 2019). This will require an adjustment in public spending or an increase in tax revenues. A little over half of public spending is age-related. The cuts can be made to age-related or other costs. Alternatively, tax increases can be based on an expanding tax base as a consequence of growing employment or new tax targets. If these remain the same and the will to touch spending is lacking, the remaining option is to raise tax rates. Blanchard and Tashiro (2019) do not propose increasing borrowing as a solution, and instead call for a moderate approach to the current levels of debt and deficit.
Figure 6. Projected age-related public expenditure and age structure in Japan in 2020–2060.
Source: OECD, 2019.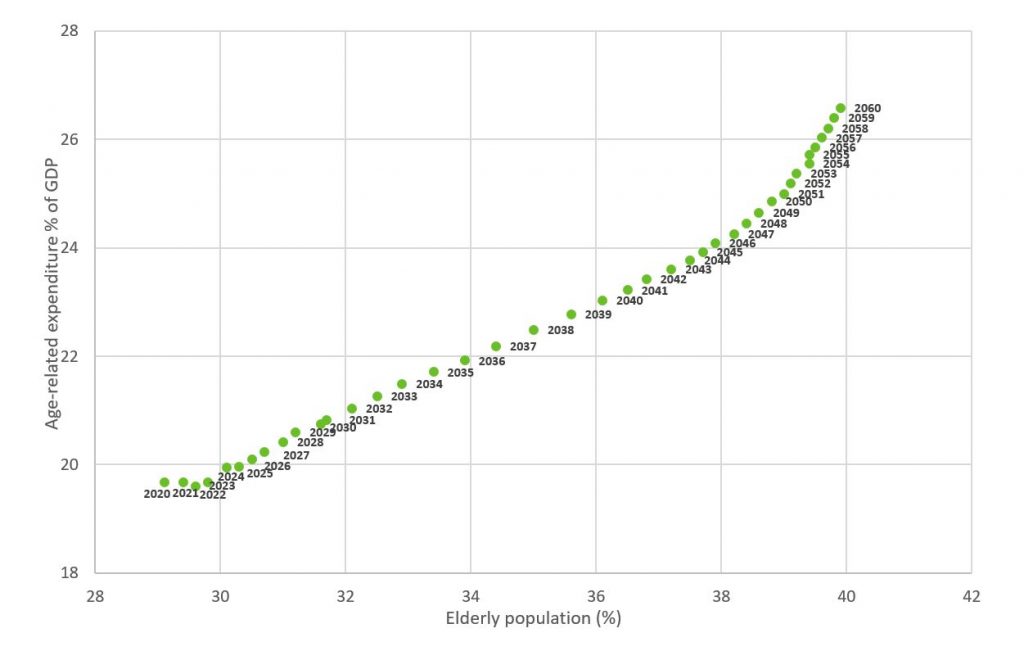
Although Finland’s future demographic shift will bring about a development trend resembling that of Japan’s in terms of the sustainability of public finances, the demographic structure here will not develop nearly at a rate as unfavorable to sustainability as that in Japan. Expenditure on social and health services is projected to increase by four percent of GDP by 2060, with pension expenditure remaining more or less at the current level (see the previous chapter by Tikanmäki and Seuri). The pressures to increase age-related expenditure are substantially lower in Finland than in Japan – although the level of expenditure and taxation is, of course, higher than it was in Japan when that country was in the type of demographic situation that Finland is in now, at the turn of the 2020s.
In conclusion
Up to now, Japan has adapted well to the challenges of an ageing population. Viewed through conventional economic indicators, it has fared better than the comparison countries used here, in which demographic change has not been nearly as much of a barrier to rising living standards. Increased labor force participation and higher productivity growth are behind these more favorable developments. The increased employment rates in all of the countries reviewed here have mitigated the impact of the changing age structure on
improving living standards.
In the case of Japan, it is probably necessary to consider the extent to which the increases in employment are the result of people’s problems earning a livelihood versus increased labor demand, and on the other hand, of increased supply resulting from older people’s improved ability to work. The challenges posed by an ageing population are most evident in the problem of imbalances in public finances.
From Finland’s perspective, the kind of population structure currently prevailing in Japan is still a long way off, and the change is happening much more slowly here. Over the next ten years, we will approach Japan’s current old-age dependency ratio, but it will take a couple of decades to reach it, because according to population projections, the demographic shift is projected to slow temporarily in the 2030s. Even by the middle of the century, the structure of the population will not be as unfavorable in Finland as it will be in Japan in the next ten years.
In terms of labor market adjustment, Finland does not have the same gender gap-based labor force reserve as Japan had at the turn of the millennium, and an increase in women’s employment rates does not offer the same labor supply potential here. On the other hand, the employment rate of men of the best working age is clearly lower in Finland, and the differences in the employment rates of the elderly and retirement-aged are particularly significant.
The need for future adjustment in public finances will not be in the same order as in Japan. Of course, ageing will pose a sustainability challenge to covering Finland’s public finances, but the problem is not as large or rapidly emerging as it is in Japan.
Although Finland’s future demographic shift will bring about a development trend resembling that of Japan’s in terms of the sustainability of public finances, the demographic structure here will not develop nearly at a rate as unfavorable to sustainability as that in Japan.
References
Acemoglu, D. & Restrepo, P. (2017). Secular stagnation? The effect of aging on economic growth in the age of automation. American Economic Review: Papers and Proceedings, 107(5), 174–179.
Acemoglu, D. & Restrepo, P. (2019). Automation and new tasks: How technology displaces and reinstates labor. Journal of Economic Perspectives, 33(2), 3–30.
Blanchard, O. & Tashiro, T. (2019). Fiscal policy options for Japan. Policy Brief 19–7. Peterson Institute for International Economics. Retrieved from https://www.piie.com/publications/policy-briefs/fiscal-policy-options-japan.
Conference Board (2018). Total Economy Database. Retrieved from https://www.conference-board.org/data/economydatabase/index.cfm?id=27762.
Ogawa, N., Mason, A., Chawla, A. & Matsukura, R. (2010). Japan’s unprecedented aging and changing intergenerational transfers. Teoksessa T. Ito & ja A. Rose (ed.), The Economic Consequences of Demographic Change in East Asia, NBER-EASE Volume 19. University of Chicago Press.
Japan Centre for Economic Research (2014). Vision 2050: Maintain position as a first-tier nation. Retrieved from https://www.jcer.or.jp/jcer_download_log.php?post_id=51701&file_post_id=51702.
Jones, R. & Fukawa, K. (2017). Ensuring fiscal sustainability in Japan in the context of a shrinking and ageing population”, OECD Economics Department Working Papers, No.
1413
Kawaguchi, D.& Mori, H (2019). The labor market in Japan, 2000–2018. IZA World of Labor 2019: 385.
Kuusi, T. (2015). Secular stagnation – pitkittyneen pysähtyneisyyden selityksiä ja lääkkeitä. Talous ja yhteiskunta 1/2015.
Lanzieri, G. (2014). Long-term population dynamics in Japan compared with Europe. Japanese Journal of Population Studies, 50, 7–28.
Mason, A. (2007). Demographic dividends: The past, the present, and the future. In: A. Mason & M. Yamaguchi (ed.), Population change, labor markets and sustainable growth:
Towards a new economic paradigm. Elsevier Press.
National Institute of Population and Social Security Research (2014). Social security in Japan.
National Institute of Population and Social Security Research (2018). The financial statistics of social security in Japan FY 2016. Retrieved 1 Oct 2019 from http://www.ipss.go.jp/
ss-cost/e/fsss-16/fsss-16.asp
National Institute of Population and Social Policy Research (2019). Japan life table series. Retrieved 25 Jun 2019 http://www.ipss.go.jp/p-toukei/JMD/00/index-en.html
OECD (2017). OECD economic surveys: Japan 2017. OECD Publishing. https://doi.org/10.1787/eco_surveys-jpn-2017-en.
OECD (2018). Pensions at a glance 2017: OECD and G20 indicators. OECD Publishing. https://doi.org/10.1787/pension_glance-2017-en
OECD (2019). OECD economic outlook database. Statistics of Japan (2019). Labour Force Survey. Retrieved from http://www.stat.go.jp/english/data/roudou/index.htm
UN (2019). World Population Prospects. https://population. un.org/wpp/
Wakatabe, M. (18.1.2015). Japan’s fiscal situation is not as bad as many assume. Forbes. Retrieved from https://www. forbes.com/sites/mwakatabe/2015/01/18/japans-fiscal-situation-is-not-as-bad-as-many-assume/#72c63f2455f0
de Vries, K. & Erumban, A. A. (2017). Total Economy Database: A detailed guide to its sources and methods. Conference Board.
Health disparities by socioeconomic status and place of residence (Suvi Parikka et al.)
Summary
- In Finland, health disparities between different income and educational groups are substantial.
- The sizable differences in mortality between different income groups, however, have not increased.
- Most indicators of the FinHealth 2017 survey that describe well-being, health and functional capacity, and the factors that influence them, show a clear difference by education: those with higher education are in the most advantaged situation and those with only primary education in the weakest.
- Premature death is more common in the eastern and northern parts of Finland than in the western and southern parts. Regional differences in mortality are greater among men than women.
- In the FinHealth 2017 survey’s results regarding health and functional capacity, regional differences are less consistent: some indicators show no regional differences whatsoever, and the order of the regions varies depending on the phenomenon in question. However, according to several indicators, the situation in Southern and Western Finland is slightly better than in the rest of the country.
- In all regions, the difference in mortality between income groups is substantial, and is mainly explained by deaths due to alcohol and circulatory diseases.
- In assessing the impact of the current epidemic and exceptional circumstances, as well as the reforms in the social welfare and social security systems, it is important to determine whether health disparities are growing or diminishing.
In Finland, health disparities between different population groups are substantial. In addition to health inequalities related to sex, differences have been observed between different regions and socioeconomic groups, for example. These have proven fairly consistent, almost regardless of the measure used to evaluate health. Major differences between population groups have been shown using multiple indicators of health status and functional capacity. For example, area of residence and several socioeconomic indicators are connected to health and functional capacity (Palosuo et al., 2007; Finnish Institute for Health and Welfare (THL), 2019). Differences between population groups are determined to be manifestations of inequality when it can be reasonably assumed that the differences could be diminished by various measures. Eliminating health disparities has been an important health policy goal in Finland for many decades (Palosuo et al., 2007), but so far the results have been relatively modest (Ministry of Social Affairs and Health, 2008).
For the population as a whole, data on the mortality differences due to various background factors (e.g., level of education or income) can be obtained by combining data from different registers. Studies have found that, despite efforts to reduce the disparities, differences in life expectancy have increased from the 1980s up to the second half of the last decade, especially between income groups but also between educational groups (Valkonen, Ahonen, Martikainen & Remes, 2007; Tarkiainen, Martikainen, Remes & Valkonen, 2011; Tarkiainen Martikainen, Peltonen & Remes 2017).
This article describes how mortality differences by income group developed in the country as a whole during 1996–2014, and also itemizes the differences by region. Besides overall mortality, key causes of death are also examined. In addition, the article uses the results of the FinHealth 2017 survey to illuminate differences between education groups and areas of residence when it comes to health, functional capacity and the factors that affect them.
Materials and methods used in this chapter
Mortality
The results regarding mortality differences between income groups are based on register data materials that the Faculty of Social Sciences of the University of Helsinki commissioned from Statistics Finland, which was compiled by combining data from various national registers. The calculations were made by THL, the Finnish Institute for Health and Welfare, and the results published in THL’s Terveytemme.fi [= “our heath”] service online and in an article by Parikka et al. (2017). Potential Years of Life Lost (PYLL) between the ages of 25 and 80 is used as the measure of mortality.
The materials, compiled by combining census and mortality register data from Statistics Finland, cover the population aged 25 and over living permanently in Finland in 1996–2014. Annual deaths and person-years were calculated separately by sex, 5-year age group, region and education. Household disposable income was measured in 1995, 2000, 2005 and 2010, and each person’s income decile was determined separately for men and women. Deaths and person-years were calculated annually using the most recent income data. Disposable income included the wages and capital income of all members of the household, as well as income transfers, with the taxes paid deducted. The total income was divided by the number of consumption units in the household. For the institutionalized population, personal disposable income was used. Individuals who had no personal or housing income at all or whose income was not known (less than 0.5% of person-years) were excluded from the materials as far as income analyses were concerned.
In addition to total mortality, deaths were grouped according to the underlying cause of death on the basis of the 54-category cause of death classification of Statistics Finland. The five categories used in the study were alcohol-related deaths, diseases of the circulatory system, accidents (excluding alcohol poisoning), suicide and cancer. For regional results, data from three consecutive years were included to ensure a sufficient number of cases.
Death-risk figures were calculated as the quotient of the number of deaths and the number of person-years by 5-year age group. Confidence intervals were calculated using the Monte Carlo method. The PYLL index expresses the number of life years lost in the population due to deaths in the age group per 100,000 inhabitants of the same age. The index especially highlights problems in health and well-being that increase the risk of death in younger age groups. The upper age limit for premature death in the PYLL index produced by THL is set at 80 years. In the examination of socioeconomic differences in mortality, the lower age limit was selected as 25 years, because a large proportion of those who are younger than that are still studying and their representation in the labor force is clearly lower than in the older age groups.
Health and functional capacity
The results on health status, functional capacity and the factors influencing them are based on the FinHealth 2017 survey, which is a nationally representative health survey (Koponen, Borodulin, Lundqvist, Sääksjärvi & Koskinen, 2018). For the sample, 10,305 persons over the age of 18 and living in Finland were selected randomly to participate. The broad-based study included various themes, such as self-perceived health; quality of life; lifestyles; functional capacity; the prevalence of and risk factors for the most common diseases and public health problems; the need for care and assistance; and the use of health services. The data were collected through health measurements in connection with a physical examination, as well as questionnaires. Blood and urine samples were also collected from the subjects. The results presented in this article pertain to the population aged 30 and over. In this age group, 71% of the sample (n = 9,288) participated in some part of the data collection and 60% participated in the physical examination. The sampling design (i.e., stratification and clustering) as well as weight factors were taken into account in the analyses.
Analyses were performed using a linear regression model for continuous variables, a logistic regression model for binomial variables, and a generalized logistic regression model of polychotomous variables, with age constants. For this article, some examples were selected from the FinHealth 2017 study from different subject areas. The level of education was classified as low, middle and high, based on the respondent’s highest educational attainment. Low (basic) education was defined as primary school, comprehensive school or middle school; middle (secondary) education as vocational school or equivalent, or upper secondary school; and high (tertiary) education as a college degree, or undergraduate or postgraduate degree. The regional classification used was the division into five regional cooperation areas, in compliance with the Government’s proposal discussed in Parliament in 2018 and which largely corresponded to the division of special responsibilities of university hospitals.
In many cases, the difference between the groups varied by age group, and an overall test covering all age groups does not necessarily provide a valid picture of the magnitude of the differences between the groups. The footnotes to the tables show when a statistically significant correlation between age and the background variable under consideration was present (Tables 1 and 2).
The gender gap in premature mortality has narrowed over the last two decades, but men still lose twice as many years of lifeas women.
Development of mortality differences by income
The results show that years of life lost between the ages of 25 and 80 decreased between 1996 and 2014 (Figure 1). The positive development was more rapid for men than for women, and thanks to this, the gender gap has narrowed over the last two decades.
However, premature mortality is still clearly higher for men compared to women. In the period 2012–2014, deaths between ages 25 and 80 caused men a total loss of about 11,600 years of life per 100,000 people nationwide, compared with about 5,500 lost years of life for women.
Figure 1. Potential years of life lost (PYLL) by sex for those aged 25–80 per 100,000 of the same age group across the country in the period 1996–2014.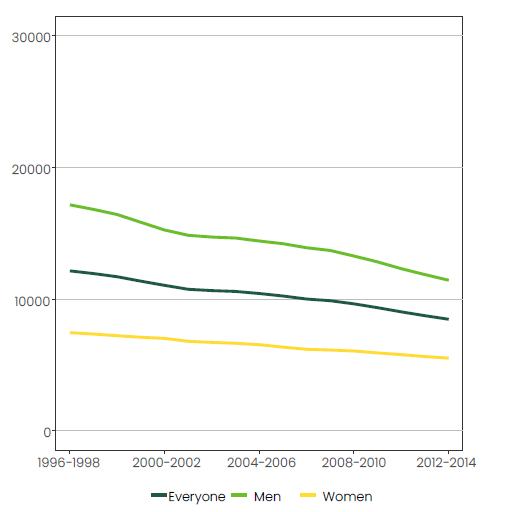
Mortality differences between different income groups were particularly large for men. During the period considered here, the differences grew up to the middle of the first decade of the 2000s (Figure 2). After that, however, the growth of differences between income groups stopped, and the differences narrowed slightly. In the period 2012–2014, in the group of men in the lowest income quintile, the proportion of lost years of life in relation to the population was three times higher than in the highest-income 40%. For women, the number of life years lost was more than double in the lowest-income quintile compared to the highest-income 40%. The number of life years lost by women in the lowest-income quintile in 2012–2014 remained at almost the same level as in the mid-1990s, despite a slight decline after the mid-2000s. In other income groups, female mortality decreased during the study period.
Differences in health and functional capacity by education
Self-perceived quality of life in the FinHealth 2017 study was strongly related to level of education: the higher the education, the better the assessment of one’s own quality of life (Figure 3). The more educated the group, the more likely it was for respondents to perceive their own health as good, and less likely to report at least one long-term illness (Table 1).
Figure 2. Potential years of life lost (PYLL) for men (left) and women (right) by income level for those aged 25–80 per 100,000 of the same age group across the country in the period 1996–2014.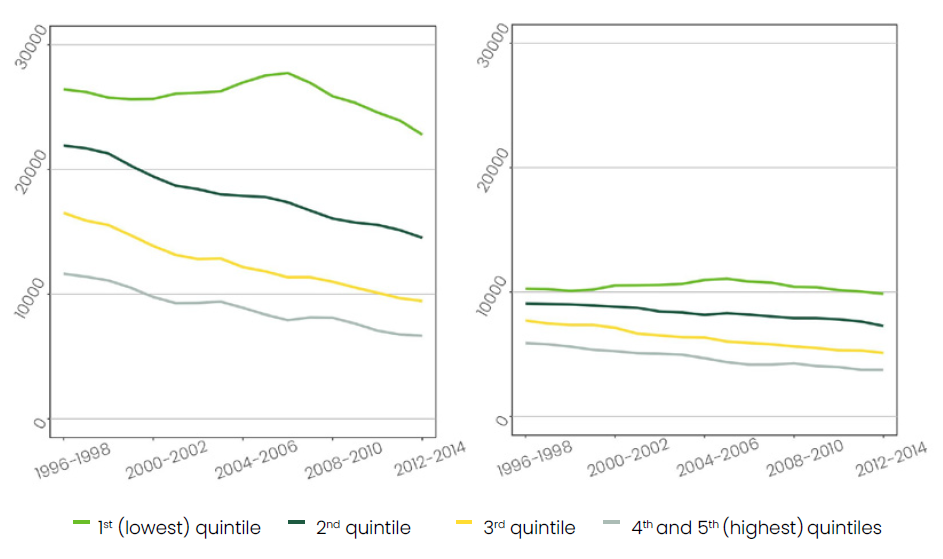
Table 1. Age-standardized1 prevalence (%) or average of certain health and functional indicators by level of education (ages 30+, unless otherwise stated).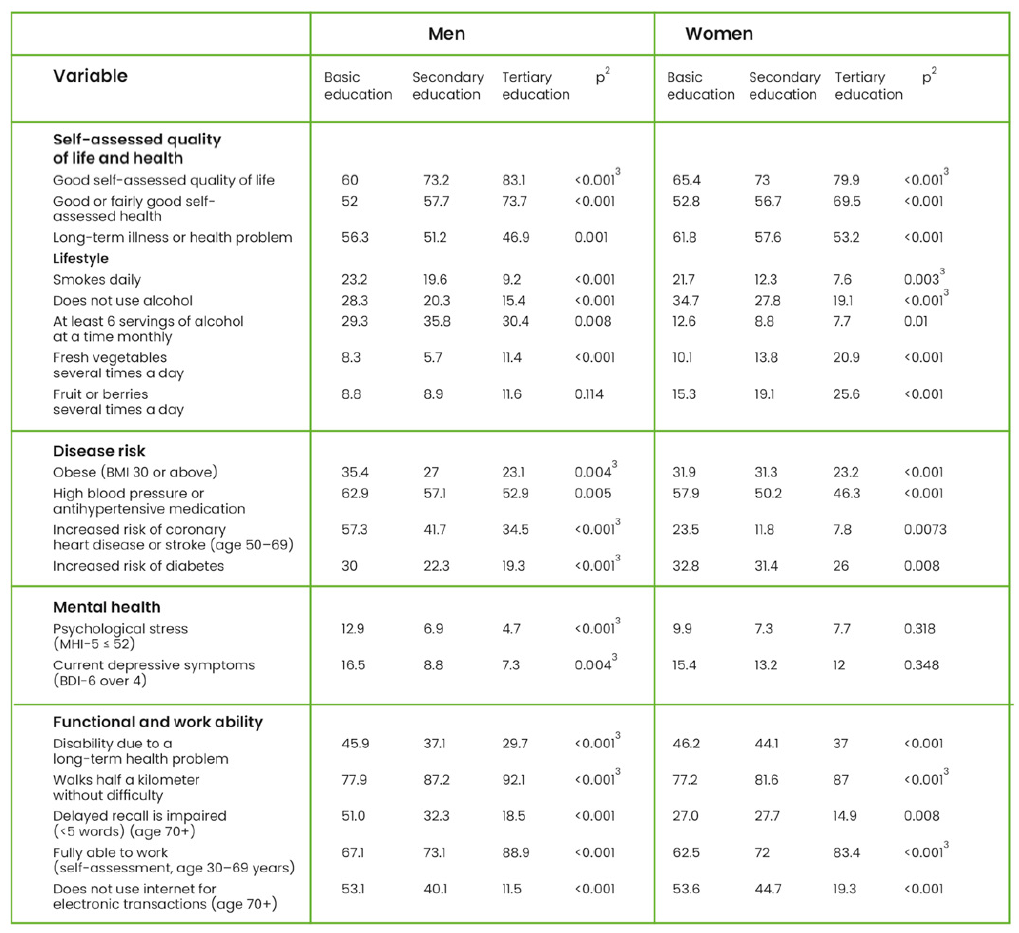
¹The figures are age-standardized (20-year age groups 30–49, 50–69, 70+) using the model separately for each sex.
²Uusimaa Cooperation Area (South Karelia, Kymenlaakso, Päijät-Häme and Uusimaa); Pirkanmaa Cooperation Area (South Ostrobothnia, Kanta-Häme and Pirkanmaa); North Savo Cooperation Area (South Savo, Central Finland, North Karelia and North Savo); North Ostrobothnia Cooperation Area (Kainuu, Central Ostrobothnia, Lapland and North Ostrobothnia); Southwest Finland Cooperation Area (Ostrobothnia, Satakunta and Southwest Finland).
³ Difference in level between education groups.
4 Statistically significant (p <0.05) age-education interaction.
Figure 3. Share (%) of those who assess their own quality of life as good, by education level and 95% confidence interval.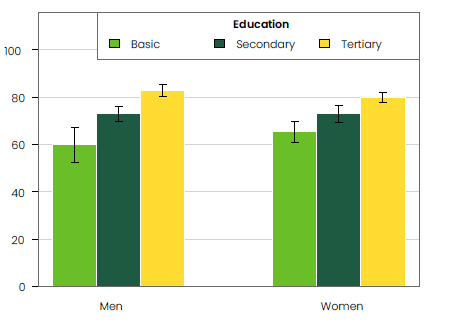
The proportion of non-drinkers was highest among those with a basic level of education; drinking at least six servings of alcohol at a time, which describes drunkenness, was most common among men in the middle education group (Table 1). With the exception of alcohol use, all other lifestyle factors were most favorable to health in the high education group. Smoking was least common among the graduates in the high education group, where high consumption of fresh vegetables and fruits and berries were most common. There was also a significant difference in the prevalence of obesity between education groups: one-third of those with low education but less than a quarter of those with high education were obese (Figure 4). The differences were also similar in terms of the prevalence of risk factors for many somatic diseases: hypertension, coronary artery disease or stroke (Figure 5), and the risks of diabetes were clearly highest in the lowest-education group.
Psychological symptoms reflecting mental health problems were, in light of the MHI-5 mental health inventory, significantly more common in men in the low education group compared with more schooling (Table 1). In men, current depressive symptoms were also most common in the lowest-education group. No similar differences were observed in women.
According to nearly all of the indicators selected for consideration, the more educated the group, the better their ability to function and work (Table 1).
Figure 4. Prevalence (%) of obesity (BMI at least 30), by education level and 95% confidence interval.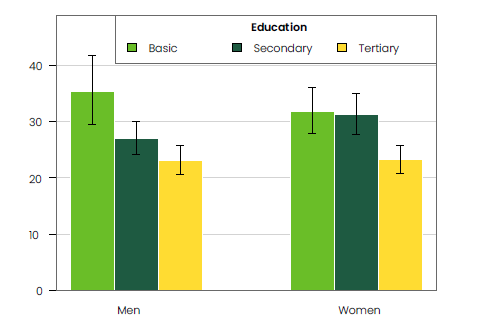
Figure 5. Increased risk of coronary heart disease or stroke (over 10% risk over 10 years) in those aged 50–69, by education level (%) and 95% confidence interval.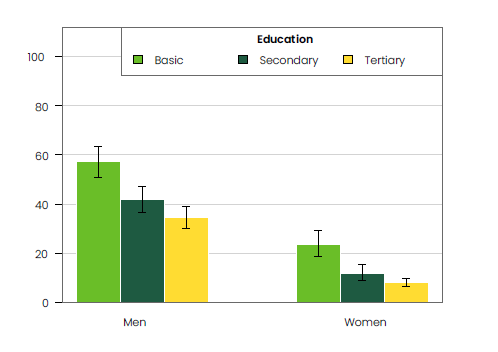
Figure 6. Share of those aged 30–69 (%) who consider themselves fully able to work, by education level and 95% confidence interval.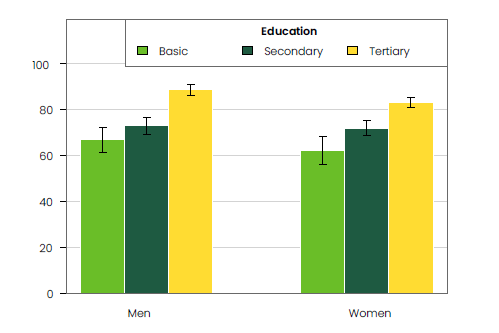
The share of those with no difficulty walking half a kilometer (546 yards) was higher in the highest-education group, similarly to cognitive functioning (memory) and self-reported ability to work, compared to those with less education (Figure 6).
With the rapid digitalization of many services, it is important to ensure adequate access to services, also for those sections of the population that do not have digital access to services. For example, more than half of women and men over the age of 70 with primary education did not use the internet for managing their affairs either on their own or with assistance, and the corresponding proportion in the secondary-education group was nearly half (Table 1).
Mortality differences by income in different regions
Mortality differences between regions had remained substantial. In 2012–2014, the PYLL index for men was higher in the regions of Eastern and Northern Finland than the national average, and in Ostrobothnia, South Ostrobothnia and Uusimaa, lower than in the country as a whole (Figure 7). For women, regional differences were largely similar to those for men, but less pronounced. In Kainuu, premature mortality caused for men a loss of about 15,200 years of life per 100,000 persons. The PYLL index for men in Kainuu was 1.8 times the corresponding figure for Ostrobothnia. Premature mortality among women was highest in Satakunta (approximately 6,500 years of life lost), where the index was 1.4 times higher than in Ostrobothnia.
In 2012–2014, the highest number of life years lost between the ages of 25 and 80 was caused by diseases of the circulatory system (men 26%, women 19%) and cancer (men 23%, women 41%) (Figure 8). Alcohol-related causes accounted for 15% for men and eight percent for women. The proportion of accidents and suicides was also higher for men than for women (19% vs. 10%).
There was significant variation between regions in the number of years of life lost due to different causes of death. For men, alcohol-related deaths resulted in the most loss of life years in North and South Savo, South Karelia, Kainuu and Kymenlaakso. The greatest number of life years lost due to diseases of the circulatory system occurred in Kainuu, Lapland, South Savo, South and North Karelia, Kymenlaakso and North Savo. Kainuu also stood out from other regions due to the high suicide mortality of men. The greatest number of life years lost because of accidents occurred in South Karelia, Kainuu and Kymenlaakso.
Figure 7. Potential years of life lost (PYLL) for those aged 25–80 per 100,000 of the same age group by region and sex in the period 2012–2014 and 95% confidence interval, all causes of death.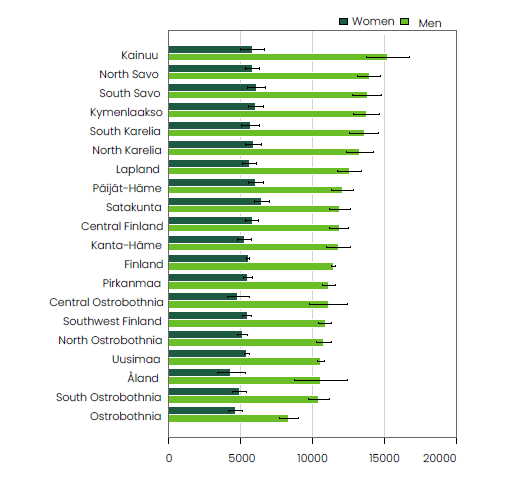
Figure 8. Potential years of life lost (PYLL) for men (above) and women (below) by cause of death and region for those aged 25–80 per 100,000 of the same age group in the period 2012–2014.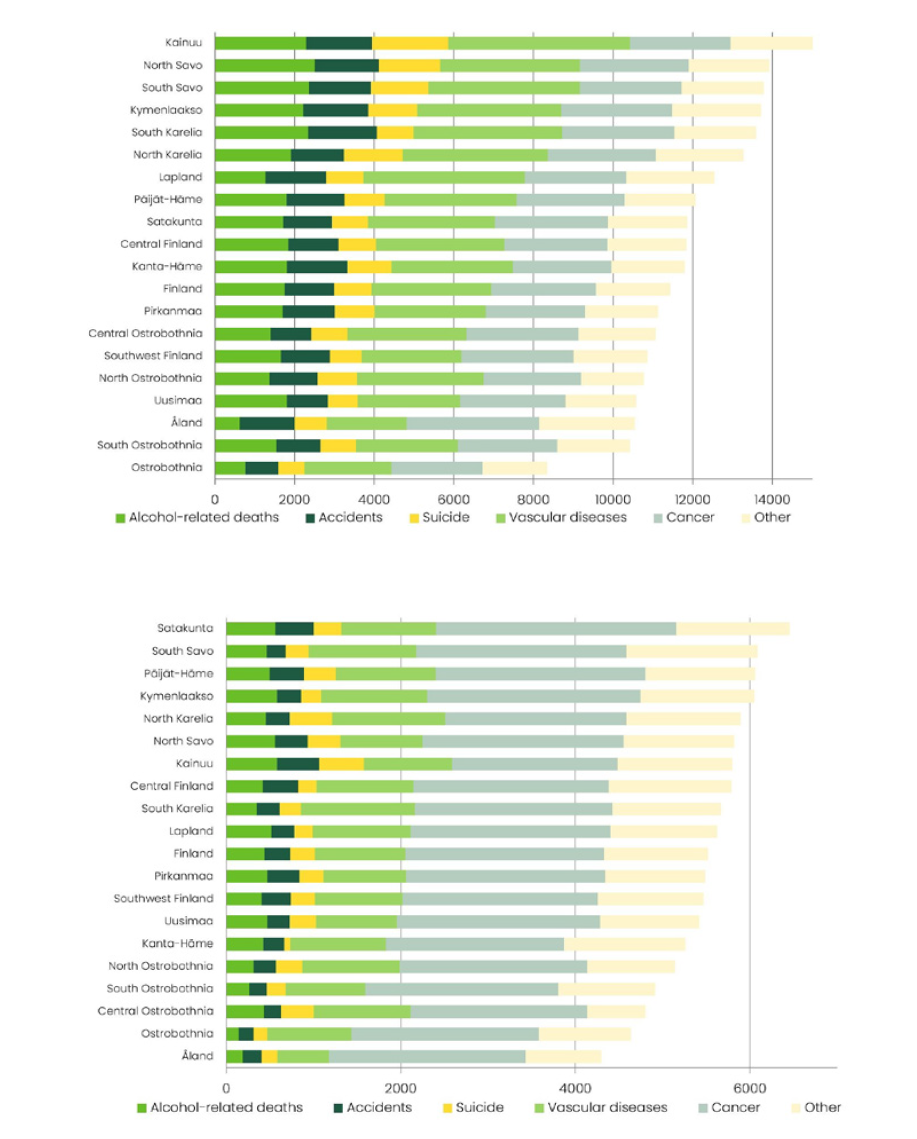
For women, alcohol-related deaths resulted in the greatest loss of life years in Kymenlaakso, Kainuu, Satakunta and North Savo. The greatest number of life years lost due to diseases of the circulatory system occurred in South Karelia, North Karelia, South Savo and Kymenlaakso. Female suicide mortality was highest in Kainuu and North Karelia. The greatest number of life years lost because of accidents occurred in Kainuu and Satakunta; however, due to the small numbers, suicide and accident mortality are associated with a lot of random variation in these regions. For both women and men, regional differences in premature mortality from cancer were quite small.
Differences in premature mortality between income groups were manifested consistently across all regions during 2012–2014 (Figure 9) when comparing the difference between the lowest and the two highest income quintiles (the highest-income 40 percent) in life years lost. In the regions of Kainuu and South and North Savo, the differences between income groups were largest. The number of life years lost in these regions in the lowest income quintile was more than 3.5 times higher than in the highest-income group (i.e., the two highest income quintiles), while in South Ostrobothnia – where the difference was the smallest – the corresponding ratio was 2.5. The regions of Ostrobothnia and Central and North Ostrobothnia are also characterized by lower-than-average premature mortality and narrower differences between income groups. Alcohol and circulatory diseases were the main causes of differences in mortality between income groups, both across the country and in almost all regions, and will therefore be examined in more detail below.
Figure 9. The difference between the lowest and the two highest income quintiles (40%) in potential life years lost (PYLL) by cause of death and region for those aged 25–80 per 100,000 of the same age group in the period 2012–2014.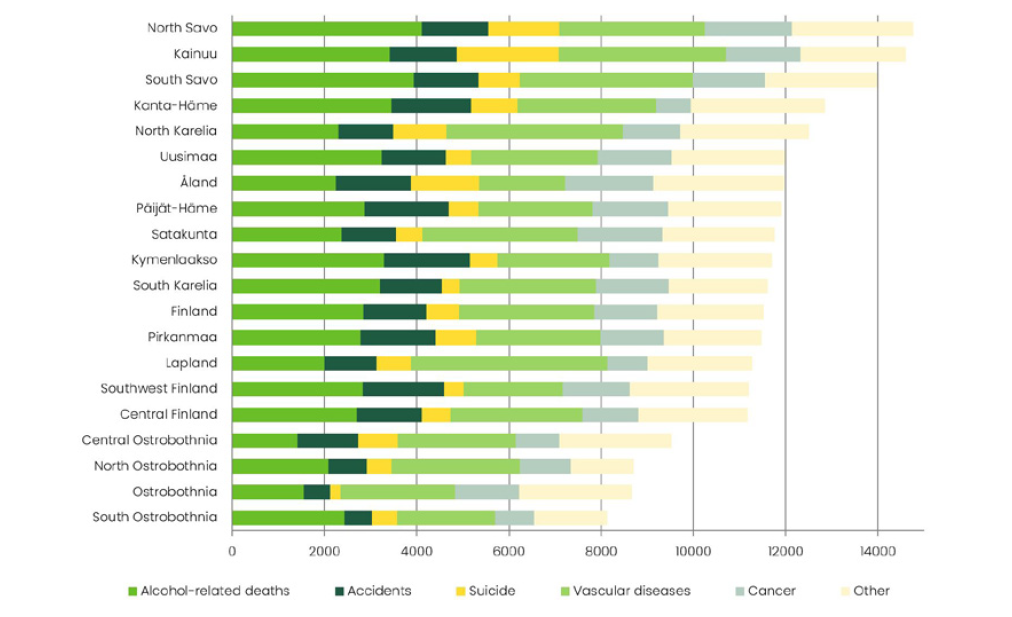
Circulatory diseases and alcohol-related deaths behind differences in mortality
The difference in life years lost due to circulatory diseases between income groups was the largest in absolute and relative terms in Lapland, where the PYLL index of circulatory diseases was almost five times higher in the lowest-income quintile compared to the highest-income 40 percent (Figure 10). Regional differences in life years lost due to diseases of the circulatory system were large, especially in the lowest-income quintile: in Kainuu, Lapland, South Savo and North Karelia, more years of life were lost than the national average for the same income group, and less in South Ostrobothnia, Southwest Finland and Ostrobothnia than in the country as a whole. Among the highest-income 40 percent, the PYLL index of circulatory diseases was higher than for the country as a whole in Kainuu, South Karelia and Kymenlaakso.
Figure 10. Potential years of life lost (PYLL) due to vascular diseases by region and income level for those aged 25–80 per 100,000 of the same age group in the period 2012–2014 and a 95% confidence interval.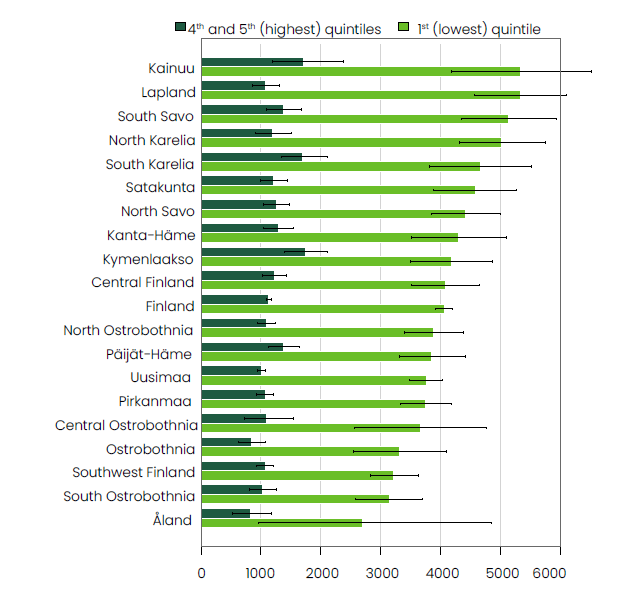
In terms of life years lost due to alcohol-related deaths, the greatest differences were found between the lowest-income quintile and the highest-income 40 percent (Figure 11). Regional differences were particularly pronounced in the lowest-income quintile. In the lowest-income quintile, the PYLL index of alcohol-related deaths was higher in North Savo, South Savo, Kainuu, Kanta-Häme, Kymenlaakso, Uusimaa and South Karelia than the national average for the same income group. Of these, the loss of life years caused by alcohol-related deaths was ten times higher in Northern and South Savo than in the highest-income 40 percent. Years of life lost due to alcohol-related deaths in the highest-income 40 percent aged 25 and over were fairly evenly distributed between the regions, with the exception of the regions of Ostrobothnia and Åland, where the PYLL index of alcohol mortality among the high-income group was well below the national average.
Also for other causes of death, differences between income groups were consistent across regions. Kymenlaakso, Kanta-Häme and Päijät-Häme had the highest number of life years lost due to accidents in the lowest-income quintile; in suicides, Kainuu, North Savo and North Karelia were the darkest places. Regional and income group differences in life years lost due to cancer deaths were smaller than for other causes of death, and regional differences were also partly different: in Kainuu, for example, both the lowest and highest income groups lost fewer life years due to cancer than the national average. (See www.terveytemme.fi.)
Figure 11. Potential years of life lost (PYLL) by region and income level for those aged 25–80 per 100,000 of the same age group in the period 2012–2014 and a 95% confidence interval.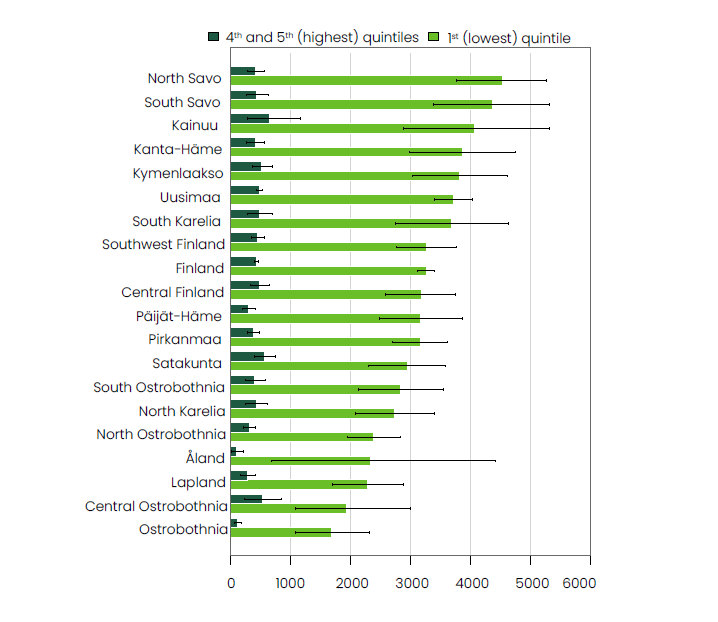
Differences in health and functional capacity by region
Table 2. Age-standardized1 prevalence (%) or average of certain health and functional indicators by educational group (age group 30+, unless otherwise stated).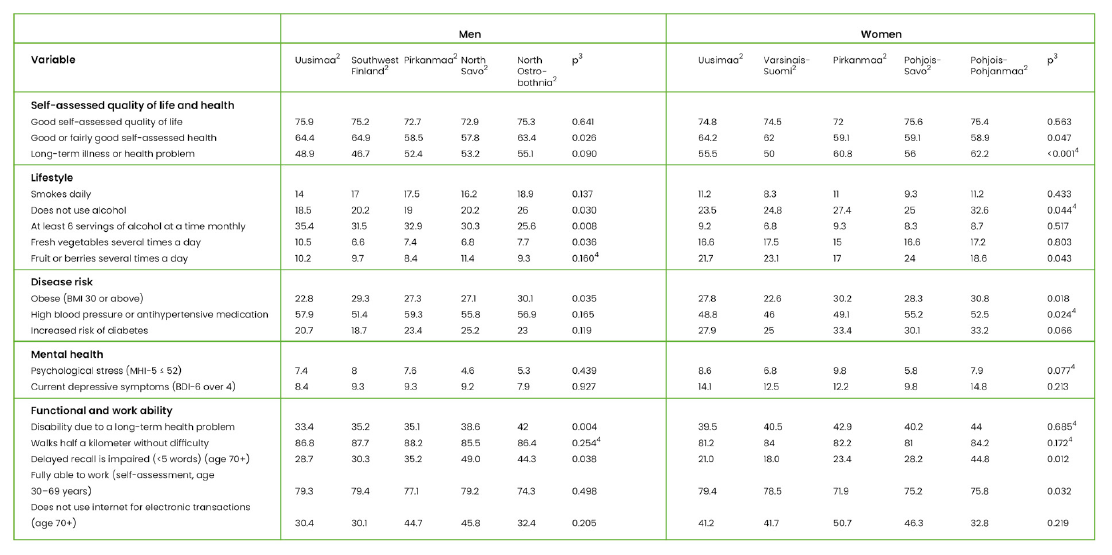
¹The figures are age-standardized (20-year age groups 30–49, 50–69, 70+) using the model separately for each sex.
²Uusimaa Cooperation Area (South Karelia, Kymenlaakso, Päijät-Häme and Uusimaa); Pirkanmaa Cooperation Area (South Ostrobothnia, Kanta-Häme and Pirkanmaa); North Savo Cooperation Area (South Savo, Central Finland, North Karelia and North Savo); North Ostrobothnia Cooperation Area (Kainuu, Central Ostrobothnia, Lapland and North Ostrobothnia); Southwest Finland Cooperation Area (Ostrobothnia, Satakunta and Southwest Finland).
³Difference in level between education groups.
4 Statistically significant (p <0.05) age-education interaction
In the FinHealth 2017 study, there were no significant regional differences to observe whatsoever in certainmphenomena, and the order of the regions varied even where regional differences were found (Table 2). There were no regional differences in, for example, self-perceived quality of life, several lifestyle factors, or in increased incidence of diabetes risk and mental health symptoms.
According to several indicators, the situation in the co-operation areas of Uusimaa and Southwest Finland, which represent the southern and western parts of Finland, was slightly better than in the rest of the country. For example, self-perceived health was somewhat better in these areas and the share of chronically ill patients (Figure 12) was slightly lower compared to other areas.
However, all areas had their strengths and weaknesses. The share of the non-drinking was highest in Northern Finland (North Ostrobothnia’s co-operation area) (Figure 13). The share of those who ate fruit and berries several times a day was slightly higher in Eastern
Finland (North Savo co-operation area) than in other areas (Figure 14).
Figure 12. Share (%) of those who reported a long-term illness or other long-term health problem by region and 95% confidence interval.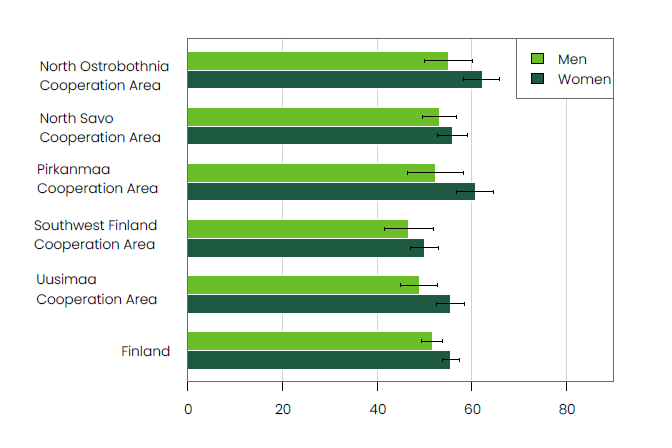
Figure 13. Share of non-drinkers (%) by region and 95% confidence interval.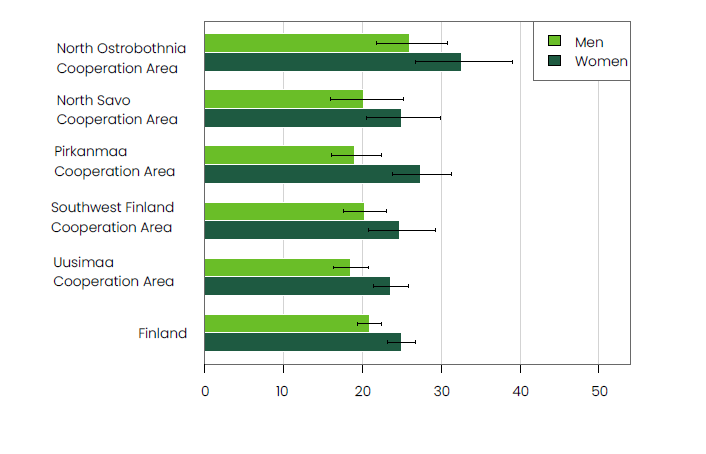
Figure 14. Share (%) of those who eat fruit or berries several times a day by region and 95% confidence interval.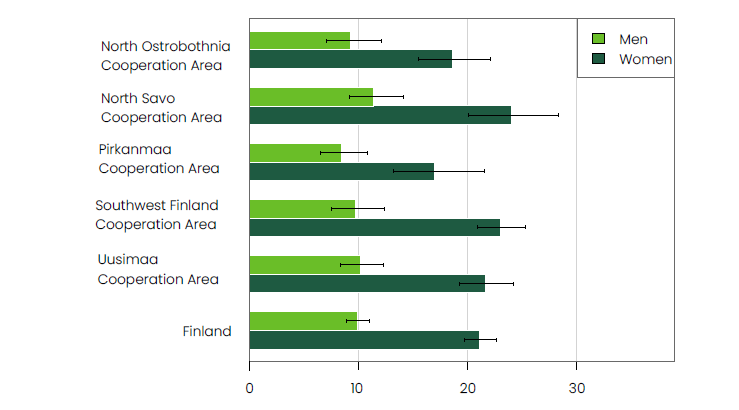
The growth in the mortality gaps between income groups came to a halt at the end of the first decade of the 2000s, and since then the gaps have narrowed slightly.
Discussion
Health disparities remain high between different income groups, although premature mortality has declined for men in all income groups over the past twenty years and for women in all but one of the lowest income groups. The growth in the mortality gaps between
income groups came to a halt at the end of the first decade of the 2000s, and since then the gaps have narrowed slightly.
The study by Tarkiainen et al. (2017) examined the causes of death underlying the halt in and slight narrowing of the growth of life expectancy differences between socioeconomic groups observed in the 2010s. Most of the narrowing of the mortality gap was due to a reduction in alcohol-, accident- and violence-related mortality in the lowest-income quintile, especially among working-age men. The significance of alcohol in the development of mortality differences was highlighted when taking into account deaths in which alcoholism or intoxication was a contributing factor. The results also suggest that some of the positive developments in mortality from circulatory diseases, accidents and violent causes may be related to a decrease in alcohol consumption. The time points, income groups, mortality rate classification and mortality rate are different in this study, but the same factors explain most of the slowdown in growth in the differences even when viewed through lost years of life.
The FinHealth 2017 study found clear differences between different education groups for most of the examined indicators of health, well-being and functional capacity. The differences mostly tend in a similar direction: most of the problems occur most commonly
among those with low education and least commonly among those with high education. This finding is consistent with previous data (Palosuo et al., 2007) and is also in line with the results of the Health 2011 Survey (Martelin, Karvonen, Linnanmäki, Prättälä & Koskinen, 2012). Differences in self-perceived health status by education level have remained significant when examining time trends over more than thirty years (Lahelma, Pietiläinen, Pentala-Nikula, Helakorpi & Rahkonen, 2019). Differences in health and functional ability by education level are influenced by the fact that many of the living conditions and work-related issues that are connected to health are also connected to educational attainment. In the FinHealth 2017 study, in the primary education level had the lowest share of those living
in a relationship and the highest share of those living alone, whereas those who felt that their livelihood was sufficient were clearly best represented in the higher education group (Koskinen et al., 2018). Income-based health disparities remain significant in Finland also
in this century (Karvonen, Martelin, Kestilä & Junna, 2019).
Regional differences in health are quite clear-cut in Finland. In the examination of potential years of life lost (PYLL index), differences in mortality between the regions are substantial, especially for men. In Eastern and Northern Finland, premature death remains more common than in the West and South. For women, regional differences run largely parallel to those for men, but are less pronounced. The differences between income groups in the population as a whole are consistent across all regions, and most pronounced in North and South Savo and Kainuu. Circulatory diseases and alcohol-related deaths are the main factors explaining the differences in mortality between income groups. If Health and ageing the situation in the country as a whole and in every income group were as good as it is currently in the most advantaged population group, namely the highest-income 40 percent of Ostrobothnia, the number of life years lost in the whole population would decrease by almost half compared to the present situation. Correspondingly, the number of life years lost due to diseases of the circulatory system would be reduced by almost 60%, and the number of life years lost due to alcohol-related deaths would be reduced to as little as one tenth of the current level.
Regional differences were also observed in the FinHealth 2017 study, but they were not nearly as consistent as regional differences in mortality, and were evident in fewer indicators than in the 2011 analyses (Martelin et al., 2012). In general, the differences between the extensive areas examined are mostly relatively small, and clearly smaller than the mortality differences between individual regions. This is largely due to the fact that the results of the FinHealth study describe differences between the regional cooperation areas, and most of these extensive areas include both healthier-than-average and sicker-than-average regions. In part, the small differences may also be due to the most vulnerable groups being “wiped out” in the surveys. However, there are significant differences between regions in many health and functional indicators based on register data. For example, according to the Finnish Institute for Health and Welfare (THL) morbidity index, the morbidity in the sickest region (North Savo) is about twice as high as in the healthiest region (Åland). Even within regions, morbidity varies considerably: in some regions, the health of its people may differ significantly from the health of those living in a neighboring municipality (THL, 2019).
The mechanisms by which regional differences in mortality and health come about are complex and often related to a region’s socioeconomic demographics and migration, which may be selective by health. There are also several factors behind socioeconomic health inequalities: on the one hand, poor social status can lead to poor health and an increased risk of premature death through various mechanisms, but on the other hand, health problems can impair a person’s social status (Kröger, Pakpahan & Hoffmann, 2015). In addition, the differences in register-based data may also in part reflect differences in treatment practices rather than in the health status of the population; regional health surveys would be required to confirm this.
What could be done to reduce the differences?
Reducing health disparities requires action on multiple fronts. National solutions are important, including taxbased measures used in alcohol, tobacco, sports and nutrition policies, as well as the promotion of equality in education and employment opportunities. In reforming social and health services, reducing regional inequalities requires directing resources especially to those areas where the mortality levels and inequality between income groups are greatest (Mäkelä, Martikainen & Peltonen, 2017; Koskinen & Puska, 2017). In the
prevention and treatment of alcohol-related harm and mental health problems, cross sectoral services and equal access to social and health services are particularly important. In preventing and treating the most common public health problems, the key is to ensure equal opportunities for early detection, guidance and access to care. For those with the lowest income, the challenge is to ensure accessibility of easy-to-access local services, especially in sparsely populated areas.
In reforming social and health services, reducing regional inequalities requires directing resources especially to those areas where the mortality levels and inequality between income groups are greatest.
In addition to national, structural measures, regional measures to improve living conditions and promote healthy lifestyles are also important. Regional well-being reports are a useful tool in this, defining the objectives and measures that a regional actor, such as a regional association or hospital district, will do in collaboration with other actors to promote the well-being and health of residents and to reduce inequality. Regional data on mortality disparities as well as population surveys that produce regional data are an important
starting point for this task.
Reducing health disparities between different parts of the population has long been a key goal of Finnish health policy, but the success has been modest. In certain instances, differences have actually grown over the last few decades, including differences in life expectancy by level of income (Tarkiainen et al., 2017; Parikka et al., 2017). Public health challenges are addressed most effectively by improving the health of the populations in which the particular challenge is most common. The FinHealth 2017 research material, together with the previous FINRISKI and Health 2000/2011 data, offers excellent opportunities to determine the changes in health, functional capacity, lifestyles and use of services according to population group, and for identifying the causes of the differences (e.g., childhood circumstances, social mobility, living conditions and working conditions, system of services; see Lahelma et al., 2007). Follow-up studies should also focus on factors that predict and protect against intergenerational transmission of (“inherited”) social disadvantages (Vauhkonen, Kallio & Erola, 2017). However, already published research shows that reducing health disparities should remain a key objective of social policy.
References
Karvonen, S., Martelin, T., Kestilä, L. & Junna, L. (2019). Tulotason mukaiset terveyserot. In L. Kestilä & S. Karvonen (eds.), Suomalaisten hyvinvointi 2018 (pp. 101–119). Finnish Institute for Health and Welfare (THL).
Koponen, P., Borodulin, K., Lundqvist, A., Sääksjärvi, K. & Koskinen, S. (eds.). (2018.) Terveys, toimintakyky ja hyvinvointi Suomessa. Report 4/2018. Finnish Institute for Health and Welfare (THL).
Koskinen, S. & Puska, P. (2017.) SOTE ja alueelliset terveyserot. Erikoislääkäri, 27(1), 24–27.
Koskinen, S., Martelin, T., Borodulin, K., Lundqvist, A., Sääksjärvi, K. & Koponen P. (2018.) Terveyden, toimintakyvyn ja niihin vaikuttavien tekijöiden vaihtelu koulutuksen ja asuinalueen mukaan. In: P. Koponen, K. Borodulin, A. Lundqvist, K. Sääksjärvi, S. Koskinen (ed.), Terveys, toimintakyky ja hyvinvointi Suomessa (pp. 178–186). Report 4/2018. Finnish Institute for Health and Welfare (THL).
Kröger, H., Pakpahan, E. & Hoffmann, R. (2015). What causes health inequality? A systematic review on the relative importance of social causation and health selection. European Journal of Public Health, 25(6), 951–960.
Lahelma, E., Rahkonen, O., Koskinen, S., Martelin, T. & Palosuo, H. (2007). Sosioekonomisten terveyserojen syyt ja selitysmallit. Teoksessa H. Palosuo, S. Koskinen,
E. Lahelma, R. Prättälä, T. Martelin, A. Ostamo … & E. Linnanmäki (ed.), Terveyden eriarvoisuus Suomessa. Sosioekonomisten terveyserojen muutokset 1980–2005 (pp. 25–37). Ministry of Social Affairs and Health publications 23. Yliopistopaino.
Lahelma, E., Pietiläinen, O., Pentala-Nikula, O., Helakorpi, S. & Rahkonen, O. (2019). 36-year trends in educational inequalities in self-rated health among Finnish adults. SSM – Population Health, 9 [100504]. https://doi.org/10.1016/j.ssmph.2019.100504
Martelin, T., Karvonen, S., Linnanmäki, E., Prättälä, R. & Koskinen, S. (2012). Terveyden, toimintakyvyn ja niihin vaikuttavien tekijöiden vaihtelu koulutuksen ja asuinalueen mukaan. In: S. Koskinen, A. Lundqvist & N. Ristiluoma (ed.), Terveys, toimintakyky ja hyvinvointi Suomessa 2011 (pp. 202–10). Report 68/2012. Finnish Institute for Health
and Welfare (THL).
Mäkelä, P., Martikainen, P. & Peltonen, M. (2017). Sosioekonomiset erot alkoholikuolleisuudessa ja alkoholin käytössä. Tutkimuksesta tiiviisti 4/2017. Finnish Institute for Health and Welfare (THL).
Palosuo, H., Koskinen, S., Lahelma, E., Prättälä, R., Martelin, T., Ostamo, A., … & Linnanmäki, E. (ed.) (2007). Terveyden eriarvoisuus Suomessa. Sosioekonomisten terveyserojen muutokset 1980–2005. Ministry of Social Affairs and Health publications 23. Yliopistopaino.
Parikka, S., Martelin, T., Koskela, T., Härkänen, T., Kilpeläinen, K., Tarkiainen, L. & Koskinen, S. (2017). Tuloryhmien väliset kuolleisuuserot maakunnissa 1996–2014. Tutkimuksesta tiiviisti 5/2017. Finnish Institute for Health and Welfare (THL).
Sosiaali- ja terveysministeriö (2008). Kansallinen terveyserojen kaventamisen toimintaohjelma 2008—2011. Ministry of Social Affairs and Health publications 16.
Yliopistopaino.
Tarkiainen, L., Martikainen, P., Remes, H. & Valkonen, T. (2011). Tuloluokkien väliset erot elinajanodotteessa ovat kasvaneet vuosina 1988–2007. Suomen lääkärilehti, 66(48), 3651–3657.
Tarkiainen, L., Martikainen, P., Peltonen, R. & Remes, H. (2017). Pitkään jatkunut sosiaaliryhmien välisten elinajanodote- erojen kasvu on pääosin pysähtynyt 2010-luvulla Suomen lääkärilehti, 72(9), 53–9.
Terveyden ja hyvinvoinnin laitos (2019). THL:n sairastavuusindeksi 2014–2016. Statistical report 30/2019. Retrieved from www.thl.fi/sairastavuusindeksi
Valkonen, T., Ahonen, H., Martikainen, P. & Remes, H. (2007). Sosioekonomiset kuolleisuuserot. In: H. Palosuo, S. Koskinen, E. Lahelma, R. Prättälä, T. Martelin, A. Ostamo, … & E. Linnanmäki (ed.), Terveyden eriarvoisuus Suomessa: sosioekonomisten terveyserojen muutokset 1980–2005 (pp. 44–64). Ministry of Social Affairs and Health publications 23. Yliopistopaino.
Vauhkonen, T., Kallio, J. & Erola, J. (2017). Sosiaalisen huono-osaisuuden ylisukupolvisuus Suomessa. Yhteiskuntapolitiikka, 82(5), 501–512.
Immigration – threat or opportunity? (Mauri Kotamäki)
Summary
- Finland’s net migration has about tripled since the 1990s, now averaging about 15,000 people a year. Internationally, however, Finland’s migration is still low.
- Finland’s population is ageing and the birth rate is falling, leading to an unfavorable old-age dependency ratio between the working-age and retirement- age segments of the population. Increasing immigration levels has been proposed as a solution to the dependency ratio problem.
- This chapter examines the impact of immigration on the receiving country’s labor market and public finances through mathematical models, calculations and empirical evidence. However, it is worth remembering that bolstering Finland’s economy is not the only reason to take in immigrants – also humanitarian reasons, for example, are important in themselves.
- The impact of immigration on the wage levels and employment of the native population is, on average, small, although in the short term, immigration may displace the work of the low-skilled native population in some sectors. In the long term, immigration will increase overall economic activity and enable the native population to move to higher- skilled jobs. The effects of highly skilled immigrants on the labor market are exclusively positive for both the immigrants and the native population.
- Immigration affects public finances in different ways depending on the employment and age of immigrants. If immigrants arrive between the ages of approximately 10 and 45, and if they are employed at roughly the same rate as the native population, immigrants have a positive impact on public finances.
- Immigrants’ employment rate is connected to the reason for their immigration and the length of their stay in the country. The employment rate of employment-based migrants is even higher than that of the native population immediately following immigration, and it will remain so. The employment rate of those who came here to study will surpass that of the native population 5–10 years after their arrival in Finland. The employment rate of those who moved to Finland for other reasons will remain lower than that of the native population, but it increases the longer they stay.
- Immigration can therefore be part of the solution to a deteriorating dependency ratio, as long as it is primarily driven by employment or studies in Finland. Methods for obtaining this kind of immigration include, for example, facilitating the process of obtaining study and work permits for international students, accelerated the processing of residence permits for immigrants who meet certain criteria, and making it easier to employ immigrants. In addition, research is needed into how changes to economic policy affect or potentially affect immigrants in particular.
Immigration elicits strong feelings both for and against. Some feel that immigration limits the opportunities of the native population to live and engage in enterprise in Finland. Others see immigration as a vital condition for preserving the Finnish welfare state.
On average, Finnish attitudes towards immigrants are slightly more negative than in the rest of Europe. Responses regarding attitudes in Finland and also in other European countries towards immigration can be found, for example, in the European Social Survey (2014). The study asked how many immigrants Finland should allow from poorer European countries. In Finland, about 43% responded, “Allow many” or “Allow some”, whereas in Sweden the corresponding figure was 88%. The average for all countries participating in the study for this response was 55%. On the basis of this survey, Finland appears to be a less immigration-friendly country than Sweden or the EU countries on average. However, considering the fear of labor shortages and the demographic shift, can Finns really afford to hold onto the preconceived attitudes described above?
When viewed from an immigrant’s perspective, an examination of the issue reveals that Finland is not as attractive a place as is sometimes thought. Relaxing and modifying immigration policies to better promote employment-based immigration would not result in an uncontrolled influx of immigrants to Finland. Even from EU countries that are many times poorer than Finland, not enough newcomers are heading to this country, despite people’s ability to move freely within the internal market. Immigrants primarily go to other countries.
In the big picture, when it comes to immigration, Finland has been a passive bystander or, at worst, a deterrent to employment-based immigration. Finland has chosen a completely different policy path than the other Nordic countries, where the share of immigrants in the population is much higher.7 It is high time to engage in a broader, analytical discussion on how to address demographic change and what role a more active immigration policy could play in this.
The intent of this article is to provide background from the perspective of immigration for the tangled web of problems connected to the economic factors that arise from demographic change. Immigration is treated here as a broad entity, although it should be remembered that, in the end, almost all immigration should be employment-based. In other words, regardless of the reasons for immigration, efforts should be made to find employment for all migrants of working age in the open labor market – the same as for the native population.
In matters of immigration, Finland has been a passive bystander or, at worst, a deterrent to employment-based immigration.
The second section of this article asks what statistics tell about immigration in Finland. The third section contains a brief discussion of one economic theory to help outline the activities of immigrants in the labor market and illuminate our thinking on the subject. And what does empirical research say about the impact of immigration on the labor market? Section four delves into this issue. Immigration to Finland from abroad is a new and small-scale phenomenon, and there is no comprehensive research literature on the case of Finland in particular. Therefore, we have to rely largely on international literature when considering different channels of influence.
The fifth section looks into the economic effects of immigration according to the research literature or calculations made by various organizations. At the same time, it must be emphasized that economic benefit is not the only measure of immigration. Immigration, especially humanitarian migration, also involves making political choices informed by values, that are not defined by economic indicators alone. The sixth section presents proposals for improving Finnish immigration policy. Section seven is a summary.
7 In 2018, immigrants accounted for 7% of the population in Finland, 10% in Denmark, 18% in Sweden and 15% in Norway.
A look at Finland’s immigration statistics
Finland produces good public statistics on the basis of which we can say a lot about immigrants’ statistical backgrounds. We know with some precision, for example, how immigrants enter the labor market, how much they pay in taxes, what sectors they end up in and the extent to which they use social benefits. The following is a brief overview of immigration statistics in Finland.
Figure 1. Immigration, emigration and net migration in 1990–2018 in Finland.
Source: Statistics Finland, 2018.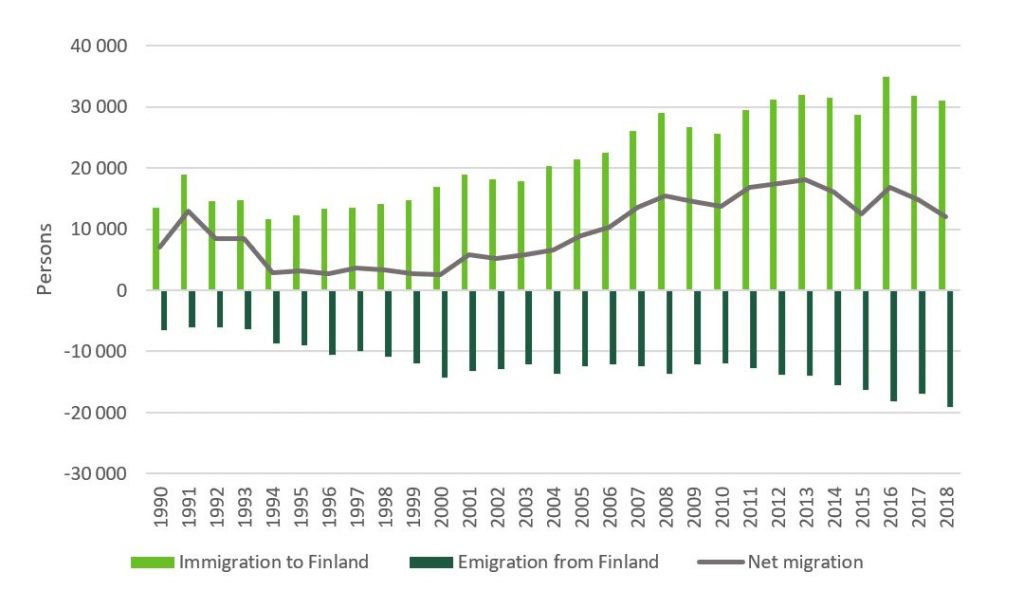
Figure 1 shows that immigration flows in Finland have increased over the last three decades. In the 1990s, annual net migration averaged 5,600 people per year, in the 2000s it was 9,000 people, and in the 2010s more than 15,000 people. During the same period, the structure of immigration has changed. In 1990, nearly 90% of those who emigrated from Finland and more than 50% of those who came to Finland were Finns. In the latest year of statistics, 2018, only 26% of those who moved to Finland were Finnish citizens, while only 60% of those who left Finland were part of the native population. The movement of people across national borders has increased overall. The share of Asians in particular has increased among immigrants to Finland. In 1990, about nine percent of immigration originated in Asian countries, while in 2018 the corresponding percentage was already 27.
Internationally speaking, Finland’s (net) migration is low: according to OECD (2020) statistics, in 2018, seven percent of the population was born abroad. In Denmark, for example, the corresponding figure was around 10%, in Norway 15%, in Sweden 18%, and in Switzerland as high as 30%. On the one hand, the small proportion of immigrants is a result of Finland’s immigration policy, but on the other hand, it can also be said that Finland has not attracted citizens from the EU’s Schengen countries – not even from nations whose standard of living is clearly lower than ours.
There has been no major change in age or sex distribution in immigration between 1990 and 2018. Figure 2 shows the age and sex distribution of net migration in 2018. Net migration centers more on men who arrive in greater numbers than women. Instead, women are somewhat more likely than men to leave Finland.
Figure 2. Net migration sorted by age and sex in 2018.
Source: Statistics Finland, 2018.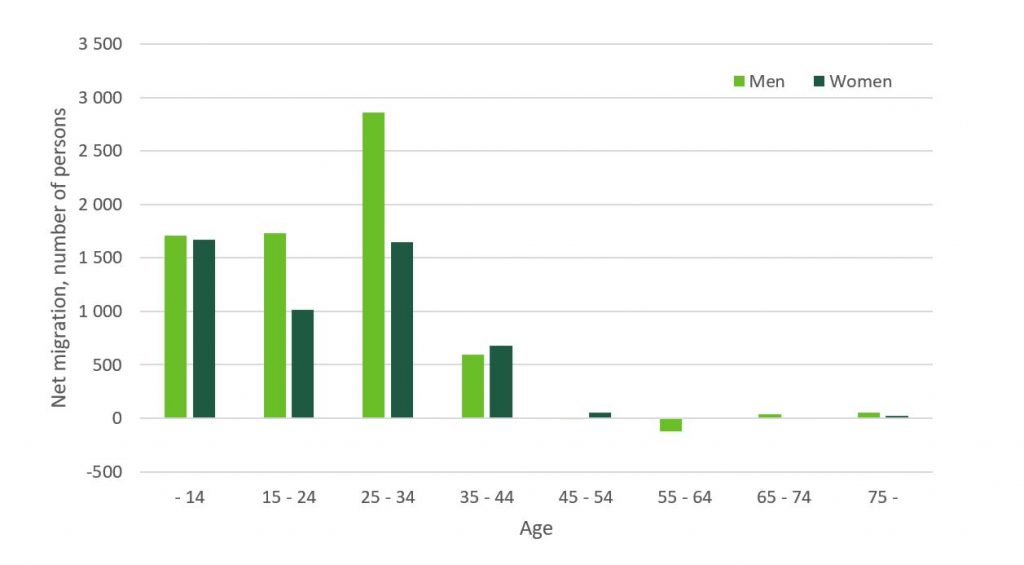
Employment and unemployment among immigrants is the subject of active debate – and rightly so; as will be noted later in this article with reference to published research, immigrants’ success in the labor market largely determines the economic viability of immigration. Table 1 details the labor market position of men and women born both in Finland and abroad in 2018.
The employment rate of people born in Finland is about 10 percentage points higher than of those born abroad. In the case of women in particular, the situation of foreigners differs significantly from those who were born in Finland: their employment rate is 17 percentage points lower. The participation rate, i.e., the share of the employed and unemployed in the population, is also lower, which partly reflects the wider use of the home-care allowance among immigrant women. According to Tervola (2015), just over two out of five two-year-old children in the native population were in home care, while the proportion was on average twice as high among the immigrant population.
For decision-makers, an important piece of information is how the people arriving in Finland for different reasons succeed in the labor market. One of the few statistical sources to document the reason for immigration is the UTH survey on work and well-being among people of foreign origin, whose data is collected every eight years in connection with the Statistics Finland labor force survey (Larja & Sutela, 2015). According to this data (Figure 3), the employment rate of purely employment-based migrants has been high since the date of immigration and also remains high over time. The employment rate of those who moved to Finland to study is also high, and it grows higher, the longer someone resides in the country. On the other hand, for those who come as refugees, for example, or because of family or other reasons, the employment rate remains lower than of the native population. However, the link between employment and length of stay seems to be positive for those who arrived for reasons of family, studies and refugee status.
Busk, Jauhiainen, Kekäläinen, Nivalainen and Tähtinen (2016) studied the career paths of immigrants in 1995, 1996, 2000, 2001, 2005 and 2006 on the part of foreign citizens who immigrated to Finland. The individuals were followed until 2013 or until they left Finland. The majority, about 70–80%, of the foreign nationals surveyed in the data were of working age. The results obtained by the researchers are in line with the UTH-survey of Statistics Finland in that the rate of employment increased with the time spent in the country. However, the differences in levels of employment between the UTH survey and the register data are considerable. The differences are mainly explained by the different definition of employment in the registers and in the survey.
Table 1. Labor force status (%) of Finnish-born and foreigners in 2018.
Source: OECD (Labor Force Survey).
| Employment | Unemployment | Participation rate | ||
| Finnish-born | Men | 73,7 | 7,3 | 79,5 |
| Women | 71,9 | 6,8 | 77,1 | |
| Foreigners | Men | 70 | 11,9 | 79,5 |
| Women | 54,9 | 16,6 | 65,8 |
Figure 3. Employment rate of 20–64-year-olds with a foreign background by length of residence and reason for immigration.
Source: Statistics Finland’s UTH survey, 2014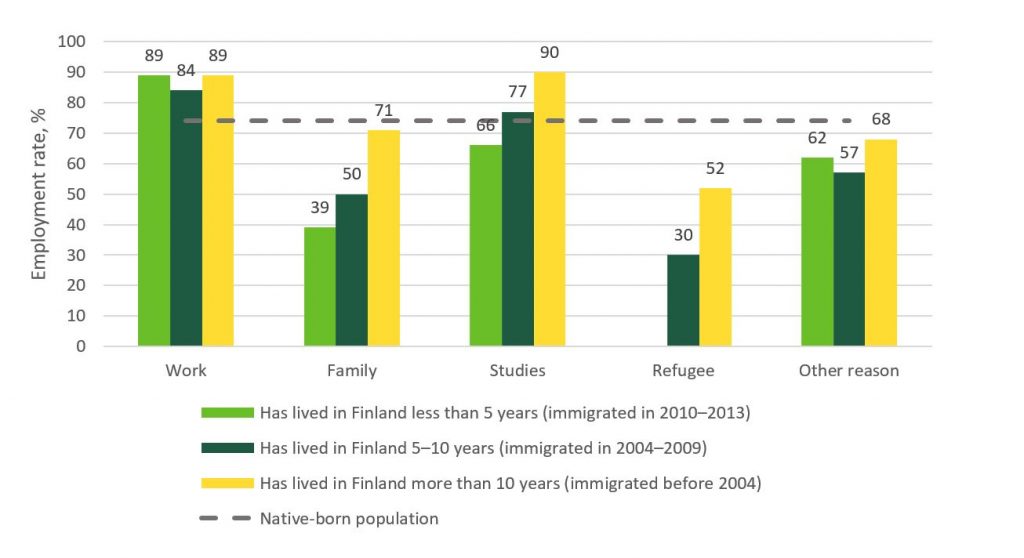
Busk et al. also examined the development of earned income, which clearly trended upward (Figure 4). The development of earned income also varied significantly by group of countries and by sex. The development of earned income was faster for men than for women, although women’s median income, too, increased with the length of their stay in the country. By group of countries, the median income of those from Western and Southern Europe in particular developed favorably as a function of duration of residence.
Background on the effects of immigration on the labor market
This section briefly presents one way to illuminate our thinking regarding the labor market effects of immigration. This section is technical in nature, although mathematical equations have been eliminated from the text and converted into verbal descriptions.8 One method used in the published research to examine the effects of immigration on the labor market is to try to assess shape of the production function. The production function is a mathematical description of how commodities are produced by combining factors of production. Simply put, for example, a restaurant combines inputs by paying salaries to employees who make food in the restaurant’s kitchen that is sold as a commodity to customers. The factors of production are therefore labor (chefs, waiters) and capital (kitchen, kitchen utensils).
Figure 4. Development immigrants’ median income while in the country for those with at least one working day per year.
Source: Busk et al., 2016, Fig. 4.13.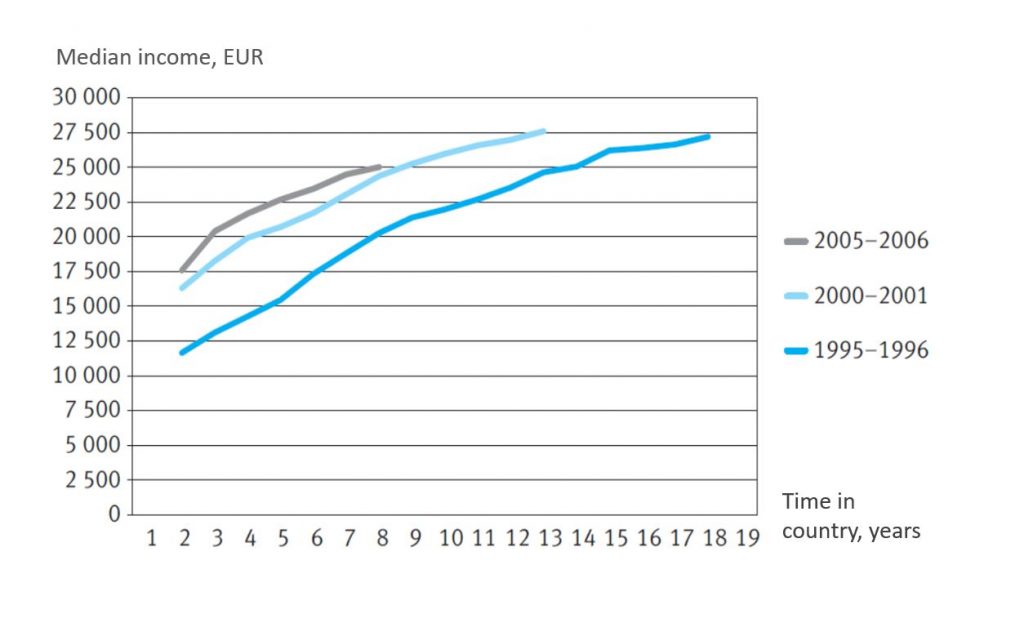
In this context, Card’s (2009) article is used as a basis to argue that the demand model for labor is consistent with the CES production function, which takes into account both educational attainment and immigration status. For example, it makes it possible to consider the question, to what extent does the entry of low-skilled immigrants displace the employment of the native population with a similar level of education. The production function can be used to deduce the level of wages offered by companies or, conversely, the demand for labor by assuming that over the long term, the company will hire more workers for as long as it remains profitable.
The analysis assumes a conventional economic approach to labor supply, where people’s preferences and wage levels determine how much labor input is provided to the labor market. The core idea is to acknowledge the link between wage levels and labor supply. In a balanced labor market, demand is equal to supply, and the level of wages is the price that balances the market. Given the assumptions described above as well as the usual mathematical requirements for function shapes, it is possible to graphically illustrate the effects of immigration on wage levels and employment in different population groups.
The key parameters for the analysis relate to the production function. Card’s (2009) summary of the empirical literature is that the elasticity of substitution (δ) between low- and highly educated people is about 1.5–2.5 and the elasticity of substitution (σ) between immigrants and the native population within educational groups is about 20. The greater the value of substitution elasticity, the more the factors of production resemble one another. When the elasticity of substitution is infinite, the factors of production are complete substitutes: it does not matter whether the factory employs 100 immigrants, 100 members of the native population, or any linear combination thereof.9 On the other hand, when substitution elasticity is zero, commodities are complete substitutes, i.e., adding one factor of production does not increase production at all.
Figure 5 graphically illustrates a concrete example that can be deduced from the model briefly described above, when the number of low-skilled immigrants in society is increasing. In the figure, the green, ascending lines are supply curves and the blue, descending lines are direct demand curves.10 The analysis begins from an increase in immigration of low-skilled individuals (top left) – the supply curve shifts to the right, the wage level decreases, individual labor supply decreases, and we move along the supply curve to the lower demand curve. There is a wage level for every population group, which balances the labor market. The supply curve shifts only for low-skilled immigrants. In other cases, we move along the supply curve and the demand curves shift – after all, the supply curve is a function only and exclusively of people’s preferences and the group-specific wage levels.
The results are intuitive. The increase in the number of low-skilled immigrants in the labor market is displacing the work of the low-skilled native population. At the same time, however, aggregate demand is rising, leading to higher wage levels and employment for highly educated people. An increased workforce in the form of low-skilled immigrants will lead to an increase in economic activity.
In addition to qualitative results, quantitative results are also important, especially the relationships between different variables. Does the increase in foreign labor displace a lot or only a little of the employment of the native population? And does immigration bring down wages for the native population? We will return to empirical evidence in more detail in subsequent sections, but based on the theoretical reflection in this section and on a few empirically identified parameters, we can conclude that the adverse economic effects of immigration on the native population are on average quite small, if not negligible. The effect illustrated in the figure is an average one for the national economy as a whole. It is true that, within a single sector, a large increase in immigrant labor could change the labor market position of the native population more significantly.
The model described in the electronic appendix is used to quantify the result described above. In other words, an answer is sought to the question of “What would happen in the labor market if the number of low-skilled immigrants were doubled?” Table 2 illustrates the results. Naturally, the results depend on the assumptions made, but with plausible parameter values, intuition is maintained. In other words, a relatively significant increase in the number of immigrants would, on average, have little effect on the labor market. A 100% increase in the number of low-skilled immigrants would reduce the wage level of that population by only about four percent.
Figure 5. Impact on wages and employment when the number of low-skilled immigrants increases in the labor market.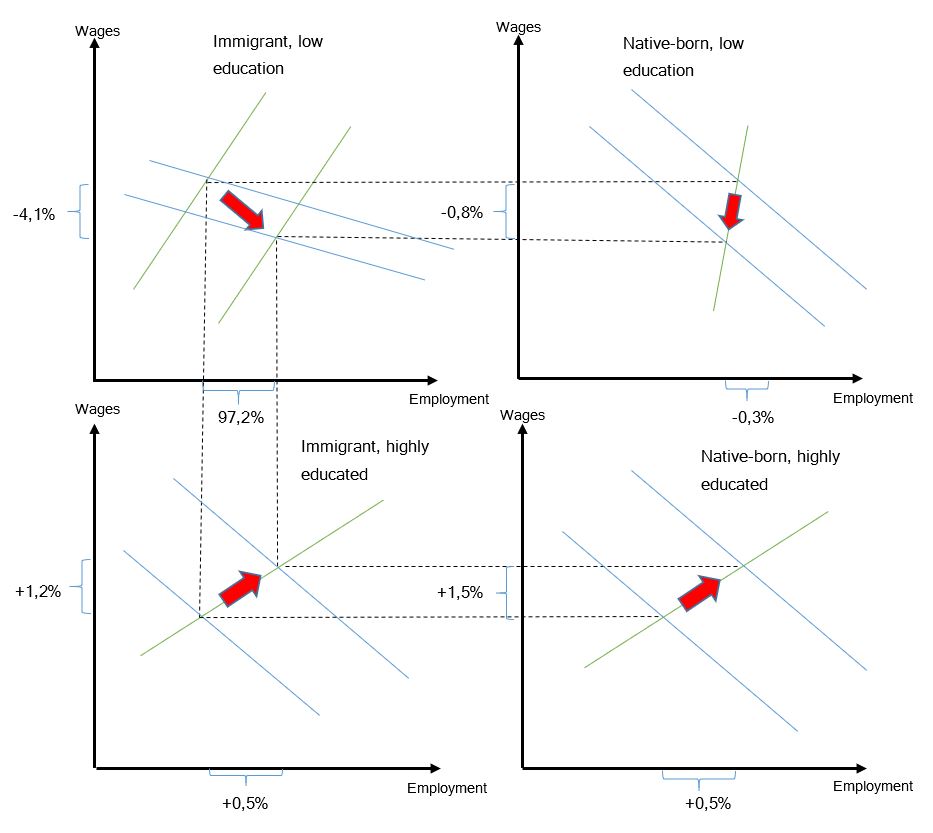
Table 2. Sample results on the impact of the growth of the low-skilled immigrant population on employment and wage levels.
| Change, % | ||||
| Population | Employment | Wages | ||
| Low education level | Immigrants | 100 | +97.2 | -4.1 |
| Native-born | 0 | -0.3 | -0,8 | |
| Highly educated | Immigrants | 0 | +0.5 | +1.5 |
| Native-born | 0 | +0.5 | +1.5 | |
The model presented above is not a perfect depiction of the world, but it does provide a good framework for analysis. The model finetunes our thinking and reveals interesting mechanisms among the effects of immigration. The two main results produced by the model
are thus:
- The negative effects of immigration on the native population’s labor market are, on average, small.
- In relative terms, immigration is most detrimental to the position of other immigrants who are already in the country.
The next section examines the empirical literature and confirms the arguments raised above.
Previous literature on the economic effects of immigration
This section is focused on the effects of immigration from the perspective of the economic research. The following is a brief overview of, for example, how immigration affects the position of the native population in the labor market as well as of immigration’s effects on the balance of public finances.
Although this article is of particular interest to employment- based migration, the results documented in this section are connected to immigration more broadly. This is because the international literature typically studies immigration at a fairly general level, not just employment-based migration.
The wage effects of immigration are small
How does immigration affect the wages and employment of the native population? Does immigration destroy jobs for the native-born and lower overall wage levels? The simplest model of supply and demand would suggest that, as labor supply increases, the pressure on increasing wages would ease. In other words, wage levels would remain lower compared to a situation in which there is no immigration. However, as shown in the previous section, the issue is not quite that straightforward. A simple supply and demand framework may not adequately reflect the functioning of the labor market.
Figure 6. Number of research articles (Y-axis) according to the wage impact assessment of immigration (X-axis).
Source: Peri, 2014, p. 3.
In his review article, Peri (2014) notes that empirical evidence from the last thirty years does not support the view that immigration lower wages for the native population – at least not in a significant way. The review article in question surveys 27 studies and documents the distribution of their wage impact estimates in Figure 6. Most of the results examined are close to zero.
Peri documents nine possible reasons for immigration’s small impact on the native population’s wages:
- In reality, migration flows are often so small that no significant impact can occur.
- Immigrants do not compete for the same jobs with the native population.
- Immigrants bring new skills and perspectives to the destination country, which may increase innovation and ultimately raise the wage levels of the native population.
- The native population in competition with immigrants in the labor market responds by specializing more in job responsibilities that are more dependent on social interaction skills, where they have a comparative advantage. Specialization helps the native population to update their job tasks and protects their jobs (wages) from the competition created by immigration.
- Paying immigrants lower wages allows companies to expand, which results in employment for the native population in particular.
- The arrival of immigrants in a given geographic region results in the emigration of the native population, so that locally, there is no wage or employment response.
- Immigrants are also consumers who increase the overall demand for goods and services in the destination country, leading to investment as well as wage and employment growth.
- Low- and high-productivity jobs are often mutually supportive. Hence, an increase in low-skilled immigrants supports the labor market activity of high-productivity people.
- An adequate labor supply makes it easier to establish new businesses and expand existing ones, which raises wage levels for both immigrants and the native population.
In addition to the review article mentioned above, an extensive committee initiative in the UK in 2012, for example, summarizes the wage impact as follows: “Studies estimating the impact of migrants on UK wages have generally found little or no impact on average wages. However, in some studies migrants were found to increase wages at the top of the UK wage distribution and to lower wages at the bottom” (Migration Advisory Committee, 2012, p. 10).
Dustmann, Frattini and Preston (2013) address the issue of wages by zeroing in on wage distribution and not merely average wages for certain groups (see Figure 7). According to the results, the position of immigrants already in the country typically weakens in the wage distribution as a result of immigration. Second, immigration has a negative effect on wage levels at lower wage levels, i.e., in the two lowest income deciles. Third, the impact of immigration on higher salary grades is positive.
Figure 7. The effect of immigration on the wage level of the whole population by tenths of wage distribution.
Source: Dustmann et al., 2013.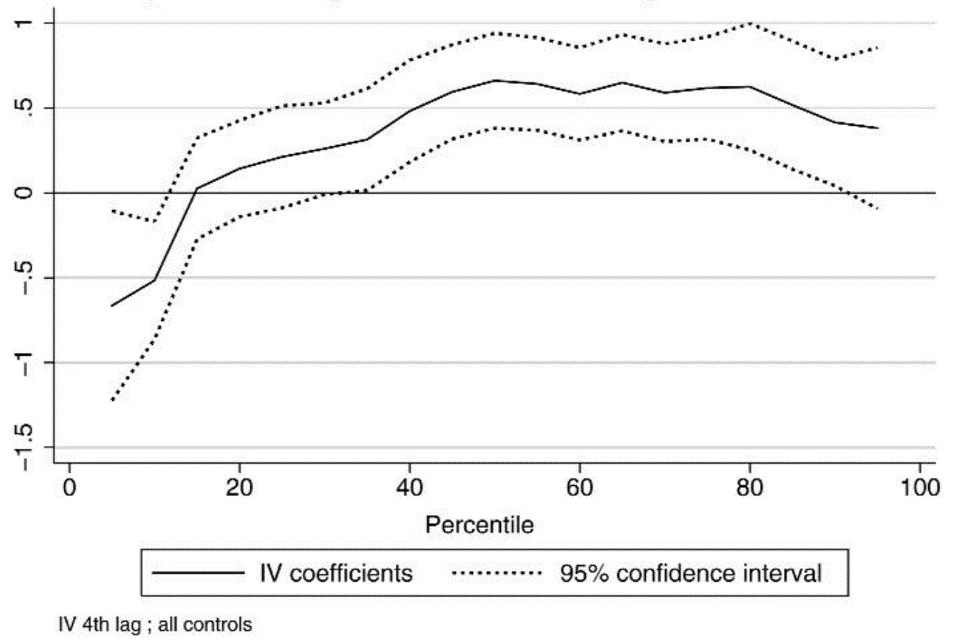
The wage effects of immigration can also be viewed from the reverse perspective. Immigrants are known to earn lower wages than the native population, but does the wage gap ever close? Anderson and Huang (2019) explicitly address this issue in their article, “Can immigrants ever earn as much as native workers?”
According to the article, in developed countries, the wage level of a first-generation immigrant is close to that of the native population after about twenty to thirty years in the country. Admittedly, there are immigrant groups whose income levels never reach that of the native population. For example, women assimilate slightly faster than men. Cultural or linguistic background is naturally important: when immigrants share a common language with the native population, assimilation is faster. In general, people with a higher skill level (education level) adapt faster than people with a lower level of skills. Also, a hostile or increasingly worsening atmosphere in the destination country reduces the desire of immigrants to stay in the destination country and to integrate into its culture. Recent examples can be found, for example, in Germany in the 1990s, when violent xenophobia increased significantly (Steinhardt, 2018), and in the United States, where the same thing happened vis-à-vis the Muslim population in the aftermath of the September 11th terrorist attacks (Gould & Klour, 2016).
Immigration does not displace the native population in employment
In the UK, government committees have issued a number of high-quality review articles in a variety of areas. One such report arose from the UK’s preparations for exiting the EU with regard to the effects of immigration (MAC, 2018). The report reviews 12 research articles published between 2003 and 2018 on the topic of this sub-section. The following describes the report’s three conclusions in the case of the United Kingdom (MAC, 2018, pp. 24–25) and also briefly reviews, by way of example, one study on each topic. A more comprehensive literature review of the research in items 1–3 can be found in the MAC report.
- ”Little or no overall impact of immigration on the level of employment or unemployment of existing workers”
Dustmann, Fabbri and Preston (2005) examined regional migration flows and changes in regional labor markets during 1983–2000, using the British Labor Force Survey. The researchers used three different identifying assumptions resulting from different econometric methods. The researchers argued that straightforward OLS and difference estimators suffer from measurement errors as well as a simultaneity bias. Instead, with the instrumental variables estimation method, they attempt to take into account the potential problems mentioned above. According to the results obtained with the instrumental variables estimation methods, an increase in immigration of one percent in relation to the size of the native population leads to a decrease of 0.07% in the employment of the native population.11 The estimated effect is small and not statistically significant. In the case of unemployment, the value of pseudo-elasticity is 0.66, also a low impact estimate and not statistically significant. - ”Where an impact is found it tends to be concentrated among certain groups”
Furthermore, Dustmann et al. (2005) sort the effects also by education level. The impact on people with an advanced level of education is 0.111, meaning that immigration would seem to slightly improve employment among them. By contrast, people with intermediate education and the unqualified (without a degree) are negatively affected by immigration, with pseudo-elasticities of -0.179 and -0.028, respectively. Roughly speaking, the results add up to the above total elasticity value of 0.07. However, the results are estimated somewhat imprecisely. - ”Impact differs depending on the economic cycle”
Lucchino, Rosazza-Bondibene and Portes (2012) observed that immigration has no effect on unemployment in the UK regardless of the stage of the business cycle. Perhaps more convincing evidence, however, is provided by Dustmann, Glitz, and Vogel (2009), who examined the variation in unemployment among immigrants and the native population in relation to the business cycle in Germany and the United Kingdom. The results show that immigrants react more strongly to economic cycles than the native population. Germans with a medium level of education reacted 2.4 times as strongly to cyclical shocks as Germans with a university degree. In contrast, the corresponding figure for immigrants from OECD countries is 4.2 and for non-OECD countries 5.7. In the case of lower education levels, the reaction of immigrants from OECD and the native population to a cyclical shock is similar, i.e., at an unemployment 4.5 times higher than that of highly educated Germans, whereas those from outside the OECD countries react 6.7 times as strongly.
The issue was also addressed in another review article in 2014, with Constant’s (2014) question in her title, “Do migrants take the jobs of native workers” where her interpretation, on the basis of research evidence, was that no, they usually do not. On the contrary, immigration typically increases production, entrepreneurship and innovation, and enables native workers to shift to jobs requiring higher skills. The short-term effects on the employment of native workers are generally small and not significant. At worst, immigrants have a negative impact on the labor market position of other immigrants who arrived before them. The immigration of high-skill workers, in turn, improves productivity and economic growth in the destination country and thus improves the position of everyone.
Constant (2014) nevertheless adds an important footnote to her findings: the above-mentioned favorable results apply only when the labor market is sufficiently flexible. Only then will companies be able to adapt effectively to changes in immigration and, thus, in the supply of labor. For example, stringent protection against redundancies is a factor that reduces the likelihood of hiring among companies, especially when it comes to low-skilled occupations, thus affecting certain groups of immigrants in particular (d’Amuri & Peri, 2011).
Immigration improves productivity
In the long term, immigration improves productivity and thereby raises wage levels, as wages adapt to overall developments in productivity within the national economy. Next, we review three articles representing the forefront of economic research on the link between immigration and productivity.
Ottaviano and Peri (2006) empirically demonstrated that in the United States, higher wages and rents amongthe native population are positively correlated with amore multicultural living environment. The empirical finding is consistent with the causal conclusion that a multicultural environment makes Americans more productive. On the other hand, the researchers were unable to rule out a competing explanatory model, according to which it might actually be about the characteristics of the native population. It is possible, for instance, that people with a higher level of education have more favorable attitudes toward multiculturalism and have therefore chosen to live in a more international environment. In this case, the link between multiculturalism and productivity is not necessarily causal.
Peri (2012) studied the long-term effects of immigration on employment and productivity. In light of this research, immigration does not appear to have an impact on the employment of the native population, but instead, the link between immigration and total productivity is strong. In particular, productivity seems to grow in low-skill sectors. It is likely that at least part of the increase in productivity is due to the fact that immigrants specialize in labor-intensive tasks, as a result of which a larger proportion of the native population moves to specialize in jobs that demand more social interaction.
In his review article, Grossmann (2016) examined the effects of immigration on investment and productivity in both the immigrant’s country of origin and destination. According to the results, immigration of the highly educated increases direct foreign investment, in addition to which the opportunities for companies to invest abroad improve. Highly educated immigrants
have significant and positive effects on income levels and productivity; in particular, foreign-born engineers increase society’s openness to innovation and thus improve productivity. On the other hand, Grossmann notes that the impact on productivity remains small in the case of low-skilled immigrants.
Peri (2014) documents an interesting detail in the connection between immigration and productivity. The positive effects of immigration remain small if wages are very rigid and there is institutional exclusion of certain groups. Peri’s article makes reference to some Southern European countries, but it is also possible to argue that the Finnish labor market meets these conditions for rigidity (see, for example, WEF, 2019). It should be underscored that the impact of immigration is conditional upon the institutions of the destination society.
In Finland, Mika Maliranta and Satu Nurmi (2019) have studied this issue from an enterprise perspective. According to their results, the growth of added value and job creation in immigrant-owned companies has been rapid during 2007–2016. However, immigrant-owned companies do not seem to increase the productivity of the Finnish economy, because the growth is based above all on strong growth in labor input – immigrant-owned companies seem to employ more people than other companies, albeit at a lower than average wage level. The impact of the growth in employment is limited due to the small number of these types of companies. In 2007–2016, the share of immigrant-owned companies among businesses has been in the order of a few percent.
Immigration increases production, entrepreneurship and innovation, and enables native workers to move to higher-skilled jobs.
The complex link between immigration and public finances
The issue of the effects of immigration on public finances is a contested issue both politically and in research. The political commotion stems from the opposition to immigration often being framed as originating in fiscal considerations, with claims that immigration is a burden on public finances. On the other hand, others who support immigration also make reference to its
economic justifications, citing its role as a panacea for labor shortages and demographic change. From a research perspective, immigration is a subject of debate because of the difficulty of assessing its fiscal impacts, and because the assessments are based on a large variety of assumptions.
Nevertheless, immigration is such an important societal issue that its impact on public finances have been studied in multiple countries. Next, we will review how the fiscal impact of immigration has generally been assessed in the literature and review the calculations of a few comparison countries. The articles discussed in this section deal with immigration as a whole and are therefore not limited to employment-based migration – although the labor market impact of immigration is perhaps the single most important factor in this context.
Immigration’s impact on public finances should not be approached as a purely static fiscal matter, within the limits of a single reference year, but rather from a generational perspective. The public costs of immigration are strongly influenced, for example, by the age at which people arrive in a country and how long they live there.
In the context of immigration, the typically used methodology is generational accounting (see, e.g., Auerbach et al., 1994 and Kotamäki & Vaittinen, 2019). The guiding principle of generational accounting is to granulate public revenues and expenditures by age group, thereby forming age-specific net tax profiles. In this way, it is possible to calculate the impact of different cohorts, i.e., persons born in a given year, on public finances, with certain assumptions regarding economic and demographic developments. In addition, when analyzing immigration, the population must be divided into the native population and immigrants, with separate net tax profiles formed for each group.
The discounted amount of age-specific (future) net taxes is interesting in itself because it indicates a sustainability gap – that is, whether government revenue and expenditure are balanced in the long term, assuming the prevailing policy. However, the assessment of the budgetary impact of immigration has focused primarily on the differences between the native population and immigrants, rather than on the idea of the sustainability gap.
We will now examine the case of Germany a bit more closely. Finland is often compared to Germany, and although the two societies differ, their demographic development has been similar – the demographic structure of both countries is challenging, and both are at the EU’s forefront when it comes to population ageing.
Hinte and Zimmermann (2014, section five) calculate Germany’s generational accounts from the perspective of immigration. The net tax profiles used by the researchers are copied into Figure 8 and Table 3. On the basis of Figure 8 and Table 3, the contribution of different age groups to public finances becomes clear. In the 1996 data year, net taxes on both Germans and immigrants are negative until just over age 20. In other words, they receive more income transfers than they pay in taxes. This is followed by their active phase in the labor market, with net taxes being positive roughly until age 60. In the 20–60 age group, the native population contributes more to public finances in euros than immigrants do. On the other hand, after age 60, the contribution of the native population to public finances is more negative than that of immigrants.
Taken together, the age group-weighted contribution of both population groups to public finances in one cross-sectional year is positive by EUR 2,000–3,000 per capita. It is important to note that this positive figure applies to a one-year cross-section that does not take into account, for example, demographic developments over time.
The relevant effect is therefore not the net tax figure in Table 3, and the ultimate, overall effect can only be obtained by taking into account demographic developments. In fact, a misinterpretation of the figures in Table 3 could lead to the conclusion that the economy would have a strong sustainability surplus – this was not the case in Germany at the time, according to Hinte and Zimmermann.
Table 3. Total net taxes by age group in Germany in 1996.
Source: Hinte & Zimmermann, 2014, Table 10.
| Germans | Immigrants | |||
| Age | % of population | Net taxes per capita | % of population | Net taxes per capita |
| <20 | 21,3 | -8000 | 28,2 | -7700 |
| 20-60 | 60,4 | 10500 | 67,1 | 6900 |
| 60-80 | 18,4 | -10300 | 4,7 | -6200 |
| Total | 100 | 2700 | 100 | 2100 |
Figure 8. Net taxes paid by age group in Germany in 1996.
Source: Hinte & Zimmermann, 2014, Fig. 3.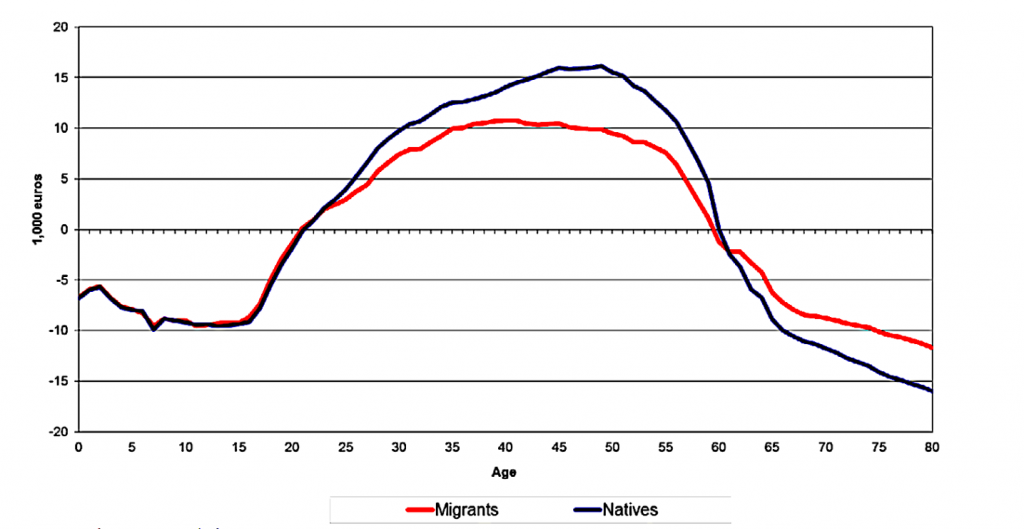
Figures according to generational accounting are reported in Figure 9 and Table 4. In other words, they report the computational contribution of both the native population and of immigrants to public finances over the remaining life cycle of the age groups, which changes the figures radically compared to the one-year cross-sectional figures presented above.
According to the researchers, the generational accounts of the native population and immigrants are somewhat close to one another up to about age 45. It is worth noting that the generational account of newborns is negative, indicating that the income generated by a newborn to public finances during its life cycle is not sufficient to cover public expenditure, i.e., fiscal policy is not sustainable. The economy will eventually need to be adjusted either through tax increases or spending cuts.
Table 4. Total net taxes by age group over the whole life cycle in Germany in 1996.
Source: Hinte & Zimmermann, 2014, Table 11.
| Germans | Immigrants | |||
| Age | % of population | Net taxes per capita | % of population | Net taxes per capita |
| <20 | 21,3 | 16700 | 28,2 | 1600 |
| 20-60 | 60,4 | 27500 | 67,1 | 60300 |
| 60-80 | 18,4 | -185800 | 4,7 | -115300 |
| Total | 100 | -14000 | 100 | 35500 |
After about age 45, the generational accounts of the native population and immigrants begin to diverge, with the generational account of the native population being clearly more negative than that of immigrants. This is problematic from a fiscal point of view, as the German population is ageing. Due to the significantly higher share of the elderly in the native population in Germany, the generational account of the native population is on average about EUR 14,000 in the negative. On the other hand, the high proportion of immigrants of working age and immigrants’ smaller proportion among the elderly – only around five percent in 1996 – turn the combined generational accounts of immigrants in the positive by EUR 35,500.
According to the results of Hinte and Zimmermann, in terms of life cycle income, immigrants significantly improve the balance of public finances, whereas the native population is a net recipient. The most important factor is demographic – the age structure of immigrants is more favorable for public finances than that of the native population. About two-thirds of immigrants are net contributors, while in the native population, only about half of the population are net contributors.
The researchers’ calculations show how important it is to take into account the entire life cycle of age groups as well as demographic developments. One limitation of the calculations is that the net tax profiles for public finances are from 1996. It is possible, in fact even probable, that the net tax profile in Germany has since become more favorable, for example as a result of a sharp increase in the employment rate. It is a problem, however, that no recent immigration-specific generational accounting calculations are available for Germany.
Figure 9. Generational accounts by age group in Germany.
Source: Hinte & Zimmermann, 2014, Fig. 4.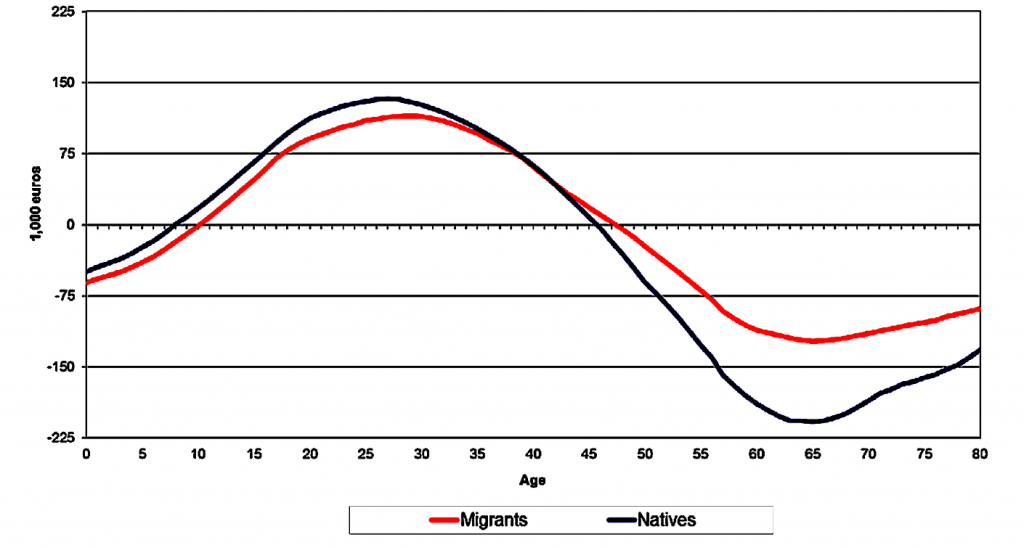
Similar calculations have been made for other countries. In the United States, Auerbach and Oreopoulos (2000) calculated that immigration is relatively cost-neutral in terms of public finances. In Spain, immigration has been found to have significant positive effects on public finances (Collado, Iturbe-Ormaetxe & Valera, 2004), not least because of Spain’s falling birth rate, which in turn has put pressure on public finances more broadly. Immigration is one mechanism that can help counteract the problems stemming from falling birth rates. In the Netherlands, on the other hand, Roodenburg, Euwals and ter Rele (2003) calculated that for immigrants from outside the Western countries, the unemployment rate is high, income transfers are significant, and their contribution to public finances negative. In line with the Dutch results, Hinte and Zimmermann (2014) note that in Denmark, data from 2000 show that the generational account of immigrants from Western countries is positive, whereas for those from non- Western countries, the account is strongly negative. Finland’s results are reviewed in section five.
Other effects of immigration
In addition to the direct economic effects discussed above, immigration has a number of different effects on various societal phenomena. The following is an example of a few interesting channels of influence.
Global trade is one of the factors by which humankind prospers. Genç (2014) reviews a total of 48 studies from 1994 to 2010 and finds that immigration has a causal and positive relationship to international trade. The magnitude of the effect depends on, among other things, a migrant’s country of origin, the globally traded basket of goods, and the number and level of education of immigrants. According to the results, an average 10% increase in the number of immigrants increases trade by about one percent. The researcher takes special note of highly educated immigrants, who have a greater positive impact on global trading, whereby it may be useful for an individual country to try to attract highly skilled immigrants solely from the perspective of increasing international trade.
In the context of immigration, the main focus is on direct economic effects, such as effects on the labor market. Less attention has been paid to the other price effects of immigration. Furtado (2015) reviews the impact on childcare costs, which in turn can affect gender pay and birth rates. Research data on the subject suggest that immigration lowers the prices of domestic services and, as a result, highly educated women in particular respond by offering more labor to the labor market or, alternatively, by having more children. According to Furtado (2016), a one-percentage-point increase in the number of low-skilled immigrants increases the likelihood of highly educated women 1) working more than 50 hours a week, by 0.78 percentage points, and 2) having more than one child, by 0.29 percentage points. Something to note regarding Furtado’s article is that it utilizes data from the United States, and it is unclear to what extent the results can be generalized to a country with a different day-care system, such as Finland.
Crime is also often mentioned in the context of immigration. It is true that, in many countries, immigrants commit relatively more crimes (Lehti, Aaltonen, Hinkkanen & Niemi, 2014). There are few empirical articles in which a causal impact has been isolated from pure correlation. Bell (2019) reviews the reasons for why correlation in this context does not necessarily lead to a causal connection and discusses the few articles in which a causal connection has been credibly established.
Bell, Fasani and Machin (2013) study the cases of England and Wales, where two major waves of immigration arrived in the 2000s: asylum seekers from Iraq, Afghanistan, Somalia, former Yugoslavia, etc., and with the enlargement of the EU, immigrants from the former Soviet Union. According to the study, as a result of an increase in the number of asylum seekers, property crime will increase slightly: a one-percentage-point increase in the number of asylum seekers led to an increase of about 1.1% in property crimes. By contrast, with immigrants from Eastern Europe, the opposite is true: an increase of one percentage point in the number of immigrants from Eastern Europe led to a 0.39% reduction in crime. Violent crime does not increase in either case.
Bianchi, Buonanno and Pinotti (2012) studied Italian immigration between 1990 and 2003. They showed that the total number of immigrants is related to crime by a factor of 0.1%. However, as noted earlier, causality is not the same as correlation. When researchers apply instrumental variable methods in the same way as Bell et al. (2013), a causal and statistically significant effect on crime is not found.
The third study to identify a causal connection is that of Spenkuch (2014), which centers on the United States in 1980, 1990 and 2000. Again, researchers found no effect on violent crime, but did find a causal link to property crime: a 10% increase in the share of immigrants led to an approximately 1.2% increase in property crime.
In addition, Spenkuch divides the materials into Mexicans and other immigrants. Mexicans have a weaker labor market position than other immigrant groups, which is also a predictor of higher crime. The results show that the coefficient estimated for Mexicans is statistically significantly positive, while for other immigrants it is negative (and statistically insignificant).
Bell (2019), among others, takes the above as one piece of evidence of the link between immigration, crime and employment. For both the native population as well as for immigrants, social deprivation causes criminality. When someone is unable to enter the labor market, they are at a higher risk of drifting into a crime. The conclusion, then, is that ensuring the employment of both the native population and of immigrants is an effective way to eradicate crime. Being an immigrant in and of itself does not result in much of an increase in crime but being disadvantaged does.
The economic effects of immigration in Finland
In the previous sections of this article, immigration is mostly discussed as a broad entity. This is a consequence of the nature of the international literature, which often does not distinguish between employment-based and other forms of immigration. In Finland, the effects of immigration on the national economy have been studied to some extent, but not much is known about the effects of purely work-based immigration. In the following, we examine the effects of immigration on public finances and try to fork out the effects of employment-based immigration in Finland.
The Government Institute for Economic Research, or VATT, working group (2014, section five) reviews the channels of economic impact from immigration on public finances. These effects depend on four factors: (i) the success of immigrants and their children in the labor market, (ii) the age of immigration and emigration, (iii) the financing of collective public services, and (iv) the effect connected to the labor market and the market for goods. The study by the VATT working group looks at the direct effects, i.e., points (i) and (ii), from the standpoint of all immigrants.
Using the same methodological principle as Hinte and Zimmermann (2014), the VATT working group creates age group-specific net tax profiles, as illustrated in Figure 10. It appears that those under 20 are clearly on the receiving end of public finances, while in the calculation, those aged from just over 20 up to 63 in the native population are typically employed and thus net payers. Immigrants, on the other hand, typically enter the country between the ages of 25 and 40, and their impact on public finances is clearly different from that of the native population.
The ultimate impacts, however, cannot be deduced from age profiles such as those in Figure 10, and the effects should be considered for the whole life cycle. Indeed, the VATT working group examines three different scenarios that vary the income and net income transfers of immigrants and their children throughout their life cycle. In the first scenario, immigrants and their children do as well as members of the native population. This assumption has been used, for example, by the Ministry of Finance in its sustainability deficit sensitivity analyses (Ministry of Finance, 2019). In the second scenario, immigrants are doing as well on average as the immigrants who arrived in 1983–2002, but their children are identical to the children of the native population. In the third scenario, immigrants and their children do as well as immigrants on average in 1983–2002.
Figure 10. Annual net effect of the native-born and immigrants on public finances, EUR.
Source: VATT Working Group, 2014, Fig. 14.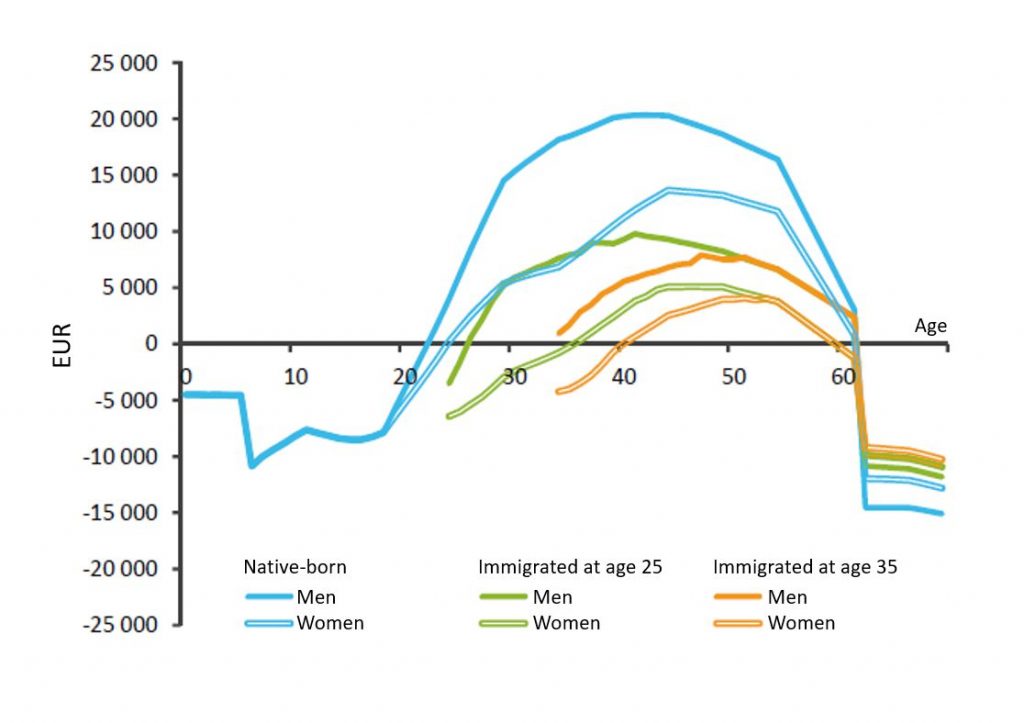
Figure 11. Impact of immigrants and the native-born on public finances.
Source: VATT Working Group, 2014, Fig. 15.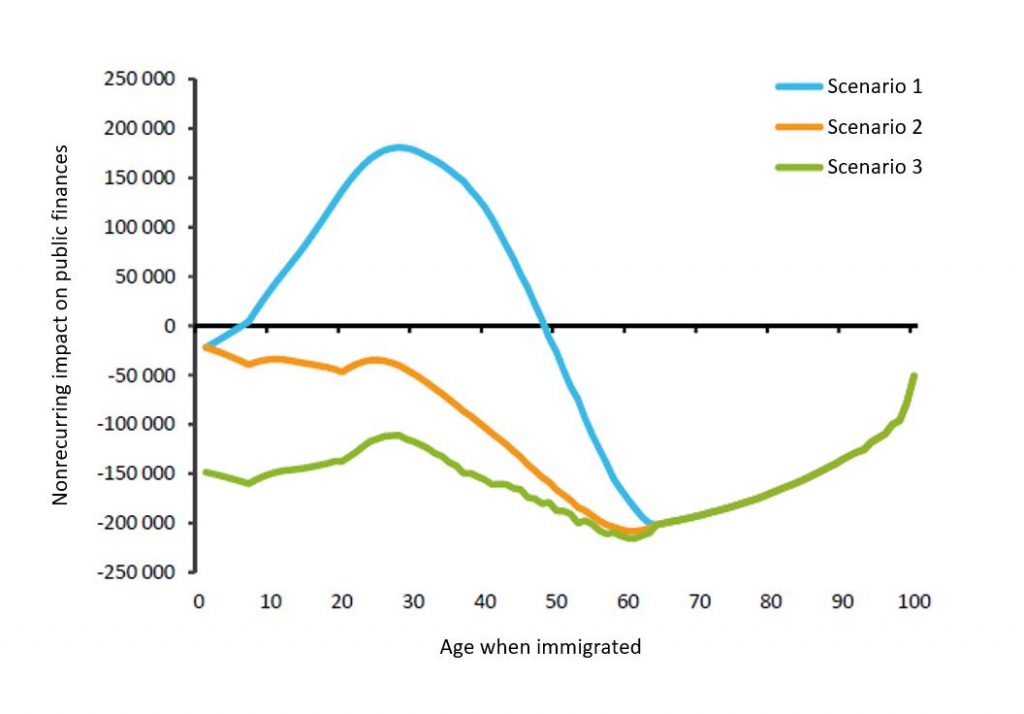
Figure 11 shows that the impact of immigration on public finances depends in particular on labor market performance and age of immigration. It should be noted, first of all, that for example a newborn of the native population12, for example, increases the general government deficit, reflecting the problems of the Finnish economy and the sustainability deficit of public finances. In the first scenario, the impact on public finances of a person who immigrated to the country at around age 30 is markedly positive, to the tune of almost EUR 200,000. In the case of those over 50, on the other hand, the impact on public finances is to increase deficits.
The more pessimistic the assumed labor market success of immigrants and their children, the more detrimental the impact on public finances appears to be (scenarios 2 and 3). According to the VATT working group, if the labor market performance of immigrants (and their children) reflects the average performance in 1983–2002, the average impact on public finances of a person who immigrated at any age will be negative.
The calculations of the VATT working group demonstrate the potential impact of the age at which someone immigrates and the impact of integration, when it comes to the budgetary impact of immigration. They do not take into account important effects on the general balance (e.g., increase in consumption) or, for example, important changes in social security (e.g., linking retirement age to life expectancy). It is also possible that in the case of employment-based migration, the effects would be closer to the first scenario than to the second scenario.
Salminen (2015, 2019), too, conducts a detailed review of the costs related to immigration. Salminen’s 2015 article deals with the net effects of public finances, but the exaggeratedly essential periods of childhood, adolescence and old age in terms of immigration are excluded from the study, and therefore the more general conclusions may be misleading. In the 2019 report, Salminen examines the life-cycle effects of immigration, but focuses on two groups of immigrants selected on the basis of place of birth. Salminen’s idea regarding strong differences between immigrant groups is worth noting. On the other hand, it is difficult to draw more general conclusions about immigration by looking at immigrants from individual countries who arrived mainly for humanitarian reasons.
Kinnunen, Mäki-Fränti and Viertola (2013) examine the life-cycle effects of immigration in Finland. The calculation assumes that annual net immigration would increase from 17,000 to 25,000 between 2021 and 2060 and that the age distribution of immigrants would remain
the same. According to the pressure calculation, the above-mentioned increase in net immigration of 8,000 people would lead to a 0.6 percentage points lower sustainability deficit, meaning that this would allow a permanent reduction in taxation or a permanent increase in expenditure of EUR 1.4 billion relative to 2018 GDP.
The Ministry of Finance (VM, 2020) is along the same lines as Kinnunen et al. in concluding that an increase in net immigration of 7,500 people would reduce the sustainability gap by 0.84 percentage points. The underlying assumption here, too, is optimistic, anticipating the labor market success of immigrants to resemble that of the native population. The assumption is therefore optimistic when looking at immigration broadly (see section two), but it is possible to argue that the assumption is moderately plausible in the case of employment-based immigrants. After all, according to the Statistics Finland Labor Force Survey, the employment rate of those who immigrated for employment reasons is higher than that of the native population (see Figure 3). In addition, the significant budgetary costs of childhood and adolescence are not incurred by those who arrive as adults.
8 The mathematical model itself is written out in an electronic appendix, which can be found using the report’s online version available at www.vaestoliitto.fi/verkkojulkaisut/sustainable-population-development-in-finland/.
9 Assuming a constant production volume and a negligible difference in productivity between groups. In the analysis itself, both of these simplifying assumptions are elaborated on.
10 The supply curve is bullish because the higher the wage level (ceteris paribus), the more reluctant people are to work. On the other hand, the demand curve is descending because the lower the cost of labor, the more eager companies are to hire people.
11 If the size of the native population is 100 and immigration increases by 10 units, the employment of the native population will decrease by an average of 0.7 units.
12 See the first scenario in Figure 11, and age at entry is zero.
What can be done to improve Finnish immigration policy?
Almost all immigration is, or at least should ultimately be, employment related – both working-age and able-bodied people born in Finland or elsewhere should be trying to enter the labor market to the best of their abilities. This section considers measures to improve employment among immigrants. A single solution is not applicable to all problems, and different methods are effective for different immigrant groups. The question is, how can Finland be more effective in attracting foreign workers to Finland or encouraging those already in Finland to enter the labor market more successfully?
Student workforce
Global demand for higher education has grown strongly since the 1960s (Chevalier, 2014). Figure 12 shows the number of international students in the world and in Finland in 1997–2017. There were about two million international students worldwide in 1997, compared to more than five million in 2017. The number of foreign students studying in Finland has increased sixfold from more than 4,000 in 1998 to more than 24,000 in 2017. Globally, human mobility has increased and so has the number of international students. Only a tiny, albeit recently growing minority of this large number ends up in Finland.
Figure 12. Number of international students in the world and number of foreign students studying at Finnish universities.
Source: UNESCO.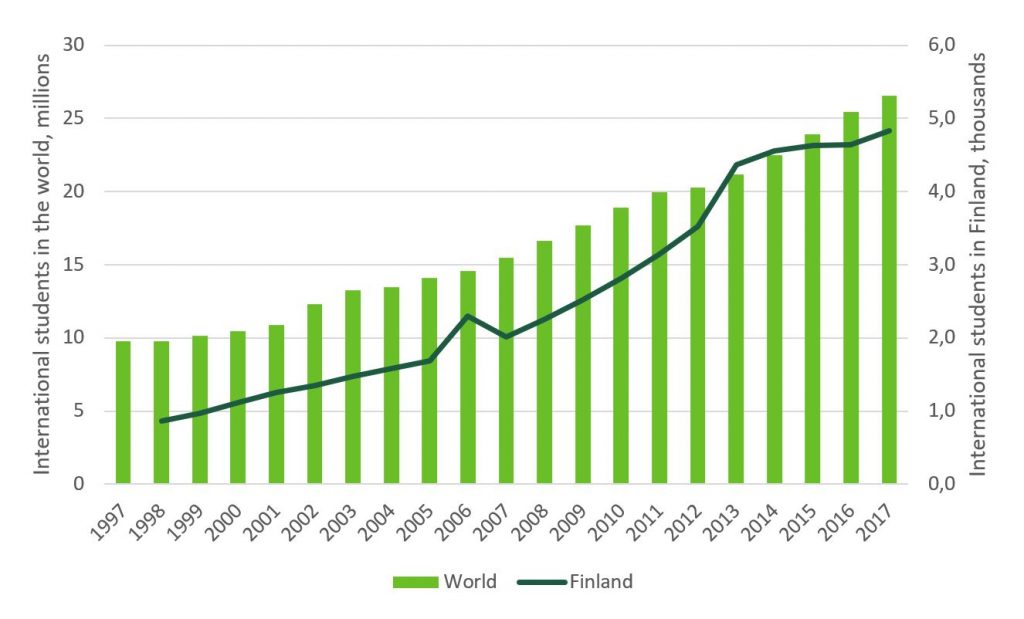
About a quarter of international university students graduating in Finland leave the country within one year of graduation (CIMO, 2014) and within five years, about 35% have left Finland (CIMO, 2016).
Student-based immigration is a particularly effective policy from a public finance perspective for at least three reasons. First, a person entering the country as an adult student, i.e., as an adult, does not burden public finances in costs related to childhood and adolescence, when public expenditure and income transfers are high (see, for example, Kotamäki & Vaittinen, 2019). Second, immigrants come to study at and graduate from institutions of higher education are by definition highly educated, i.e., on average, they are people with a lower risk of unemployment and higher wage levels. Third, according to statistical data, the employment of those who arrive as students is at a good level on average (see Figure 3).
The next question is, how should study-based immigration be increased? Precisely this question is asked in Chevalier’s (2014) article. The following presents the policy advice and observations highlighted in the article, which also apply to Finnish society.
- At low tuition fees, students’ migration decisions are more strongly linked to the quality of studies than to price.
- English-language programs attract international students.
- The harmonization of professional qualifications between countries can facilitate student mobility.
- Making it more difficult to enter the destination country’s labor market reduces migration flows.
- Restrictions on the movement of people both to and from the home country reduce incentives to study.
- A functioning and competitive labor market, as well as wages that are based more on skills rather than seniority, increase the likelihood of students who have gone abroad returning.
It is also possible to envision more detailed reforms, more specific to Finland. At present, obtaining a studybased residence permit may take so long that an individual university may even have to reimburse tuition fees.13
The immigration permit process could be streamlined by shifting in the verification of living conditions for non-EEA nationals to the same model as is used for EU and EEA nationals. Today, for example, for two years of study, someone entering the country must have EUR 13,440 in their bank account (Finnish Immigration Service, 2020), which creates an unnecessary barrier to immigration. Second, it might make sense to create a new visa to allow students to enter the country in the beginning of their studies, even if the residence permit process is still ongoing. Third, consideration should be given to allowing institutions of higher education to initiate a residence permit application on behalf of admitted students.
All three reforms would facilitate the student’s immigration process and develop the system toward a customer-oriented approach, reducing unnecessary administrative burdens.
An increase in net immigration of 7,500 people would reduce the sustainability gap by 0.84 percentage points.
Immigrant selection, accelerated application process and naturalization
Some countries, including Australia and Canada, have introduced point systems that score people who want to enter the country on the basis of certain criteria. For example, the Canadian system assigns points to a family seeking entry on the basis of age, language, work experience, education or an existing job. Immigrants who reach a certain score pass the immigration process.14
It is probably not worthwhile for Finland to move to a similar points system, because as a destination country, Finland does not attract the same immigration flows as countries such as Canada, which, according to OECD statistics, admitted almost 300,000 immigrants in 2017. For a potential immigrant to Finland, the process of applying for a residence permit takes an extraordinary length of time. In November 2019, according to the Finnish Immigration Service, the expected processing time for an employee’s first residence permit was about four months, but in the worst case, the whole process could take up to a year. It should be possible to cut down processing times. The government program of Prime Minister Sanna Marin’s government has set a goal of one month for the average waiting period for a work permit. This may be a good milestone, but a month is still too long for companies as well as employees. And for some applicants, the application process would take more than a month. A maximum duration of one month and average waiting time of less than two weeks is the level of ambition that should be pursued in the long term. Applications that have been in process for more than one month should be considered automatically approved.
An accelerated and hence unburdened immigration process for immigrant groups that meet certain criteria might make sense for a country like Finland. For example, for highly educated people with existing fixed-term employment of more than a year could be granted a permanent or at least extended work and residence permit almost automatically, or at least the process could be streamlined significantly. Alternatively, qualifying could also be done on the basis of salary, in which case, for example, those earning more than EUR 3,000 per month would undergo a facilitated process. The guiding concept is to identify fairly straightforward and clear characteristics in applicants that predict a high probability of positive labor market performance. The central principle of this model is thus aligned with the Canadian system.
A facilitated process should also be considered for sectors facing labor shortages. Using the Occupational Barometer maintained by the Ministry of Economic Affairs and Employment, it might be possible to identify occupational groups currently in short supply in Finland and to issue extended work and residence permits for these jobs through a streamlined process. This would be a kind of reverse supply assessment, with the discretionary aim of promoting immigration rather than preventing or slowing it down.
There should also be an incentive for public authorities to act more efficiently by demanding concrete results of them. Authorization under a facilitated application process should be granted, for example, within one week, or otherwise the application would be considered automatically approved.
The above-mentioned or similar measures would, on the one hand, enable companies suffering from labor shortages to recruit abroad and, on the other hand, attract experts from various fields to Finland with fewer barriers than previously.
In addition to the efficient selection of immigrants and a more rational residence permit process, the naturalization of immigrants has also been found to be an effective way forward (Chevalier, 2014). Naturalization refers to the relatively easy issuance of citizenship or permanent residence permits, which in turn encourages immigrants to invest in skills that are bound to their new country. Without a long-term residence permit or otherwise living with significant uncertainty, an immigrant’s barrier to learn a language or culture that is of little use outside Finland remains high. On the other hand, granting citizenship sends a signal to the employer of an immigrant’s successful integration, increases the risk of employment and thus improves labor market outcomes.
13 See circumstantial evidence, e.g., at https://www.hs.fi/talous/art-2000006306736.html
14 A description of the Canadian points system can be found, for example, on the Canadian Government’s website at https://www.canada.ca/en/Immigration-Refugees-citizenship/services/immigrate-canada/express-entry/Eligibility/federal-skilled-workers/six-selection-factors-federal-skilled-workers.html
Overhauling institutions also for low-skilled immigrants
The functioning of labor market institutions plays an important role for those with a weaker-than-average labor market position. Typically, for example, humanitarian immigrants, the low-skilled and the partially able-bodied are included in this population group. According to employment statistics from Statistics Finland, the employment rate of those without a post-primary degree in 2018 was 45% and for non-Finnish citizens 49%, while the employment rate for the country as a whole was 72%.
It is therefore especially important in the case of low-skilled immigrants that there be flexibility in the labor market. In this context, labor market flexibility refers in particular to the ability of companies to adapt to external shocks and to a suitably low threshold to employing people. In addition, active labor market policy measures may be justified, especially when someone’s productivity in the labor market is either low or associated with uncertainty in relation to labor costs.
Protection against dismissal is a factor that influences labor market flows, and easing the protection reduces a company’s risk in hiring workers (see, e.g., Kugler & Saint Paul, 2004). The level of dismissal protection has both positive and negative effects but that is broadly speaking beyond the scope of the section at hand. We will, however, discuss the issue insofar as it relates to the labor market situation of immigrants. An illustrative and credibly researched example can be found in the Swedish system.
The expected processing time for an employee’s first residence permit is about four months, but in the worst case, the process can take up to a year. A maximum duration of one month and an average waiting time of less than two weeks is the level of ambition that should be pursued in the long term.
Sweden employs the so-called “last in, first out” or LIFO system, in which the duration of employment offers protection. In the event of dismissals, the company must start by dismissing the youngest employees first. In 2001, Sweden introduced a reform whereby companies with fewer than eleven employees may deviate from the LIFO rule in the case of two employees. The reform created a natural research design that allowed comparing companies with fewer than 11 employees, for example, to presumably rather similar but only slightly larger companies. According to Bjuggren (2018), among others, the reform increased productivity in companies as a result of labor market flexibility. On the other hand, von Below and Thoursie (2010) concluded that, taken as a whole, the reform increased labor market flows both into and out of employment, ultimately resulting in a small net effect on employment.
Von Below and Thoursie also inspected the effects on specific populations, such as the young, elderly, immigrant, male and female. For all but immigrants, both the probability of employment and the number of dismissals increased, but the net effect on employment was small, according to the researchers. In the case of immigrants, however, employment increased clearly more than dismissals – in other words, the employment effect of a reform that increases labor market flexibility appeared to be positive.
The final report of the basic income experiment (see Kangas, Jauhiainen, Simanainen & Ylikännö 2020, p. 42), too, showed that, compared to native speakers of Finnish or Swedish, the reaction to changes in economic incentives was significantly stronger among those whose native language was other than Finnish or Swedish. Also this data suggests that it is immigrants in particular – in this case immigrants who have experienced unemployment – who react strongly within the employment margin to changes in economic incentives.
In this context, a more flexible labor market would therefore seem to support the employment of immigrants. The same logic probably applies to most of the factors that contribute to structural unemployment. On the other hand, it should be noted that immigration is probably not the most central deciding factor to use when reforming Finnish labor market institutions. Nevertheless, when considering the whole, the impact on immigrants must be kept within sight.
Wage subsidies have also been found in the economic literature to be a useful tool in a comprehensive, active labor market policy directed at immigrants. On the basis of the literature, Asplund, Kauhanen, Päällysaho and Vanhala (2018) point out that of all active labor market policy measures, wage subsidies are most effective at increasing the employment of immigrants. The authors review research conducted in the Nordic countries and in Germany. For example, many of Sweden’s twelve different forms of wage support (or employment support) are directed at immigrants (Avorin 2017). In Finland, too, more thought should be given to how an active labor market policy could be used to help the situation of unemployed immigrants.
Toward a better world through experimentation
Relatively little economic research on the effects of immigration has been done in Finland. It is also true that, due to the small number of immigrants, empirical results in estimating the parameters of the previously presented model, for example, would result in inaccuracies. Still, there is not even one study concerning Finland that has attempted to assess the elasticity of substitution in the demand for immigrants and the native population, or the elasticity of the labor supply. Considering how essential a parameter labor market flexibility is, only few studies have examined it even in terms of the native population. It is no wonder, then, that in the case of an individual and much smaller population, there is a shortage of empirically credible research findings.
As a population group, immigrants have also not been the focus of special attention in most research projects. In principle, many population-based research designs could be replicated for immigrants as well, but this has not been the case. It would be interesting to obtain information about causal relationships, for example, regarding the immigrant population’s reactions to day-care fees or, on the other hand, changes in the unemployment security system in Finland. Immigration has simply not been a hot topic in Finnish economic research.
There is little data on causal links, and the public sector could therefore play an important role in organizing randomized experiments. An experimental design randomized to all research questions would not be suitable, but one focused only on several would be. It would be essential to come up with contexts in which it would be possible to divide immigrants into test and control groups. Answers could be sought, for example, in the fields of education policy, social security and family policy, taxation, labor market regulation or active labor market policy.
A good and already largely concrete example is the SIB integration project commissioned by the Ministry of Economic Affairs and Employment.15 This is a Social Impact Bond, in which private and institutional investors invest in a bond promoting employment among immigrants (Koto-SIB). The fund will deliver if the project’s well-defined objectives for immigrant employment are met. An essential factor here is the way the project was planned from a research standpoint in such a way that initiative includes a target and control group, enabling the assessment of causal impact. The basic income experiment, too, was a step in the right direction in this sense.
Randomized field trials are not a handy shortcut and involve many problems. Still, the wider use of randomized experimental designs in studies would probably improve the quality of decision-making on immigration-related issues as well.
In order to achieve an empirically credible culture of experimentation, both public administration officials and policy makers in particular should be convinced to view research more favorably. In a sense, social research should be seen in the same terms as new-drug development: we do not allow drugs on the market without first subjecting them to rigorous, multi-stage studies. The same general principle should be applied to the areas of social policy where it is possible. This way, through better policies, we could save millions and millions of euros of society’s resources while producing better outcomes for citizens.
15 For more information, see e.g., https://www.sitra.fi/caset/koto-sib/ (referenced 20 May 2020).
Conclusions
Immigration is an important issue for society, and its importance will increase over time as Finnish society ages. This article aims to broaden the knowledge regarding immigration and invoke thoughts and ideas about the issue.
According to statistics, the number of immigrants in Finland is clearly lower than in the other Nordic countries. Finnish attitudes towards immigration are also more negative than in the rest of Europe on average. Data from Statistics Finland for 2014 show that the employment rate of immigrants who came to Finland to work or study is good and growing over time. According to these statistics, the challenges are connected particularly to the labor market integration of those who enter the country on humanitarian grounds.
In theoretical terms, a simple supply and demand framework cannot adequately describe immigration because it does not take into account the more precise divisions of labor between immigrants and the native population. Empirical research suggests that, on average, low skilled immigrants hardly compete with the native population for the same jobs.
Indeed, the international literature indicates that, on average, immigration does not significantly displace the work of the native population or reduce wages. Instead, immigration may instead improve productivity, bolster international trade, alleviate labor shortages and improve the balance of public finances. True, the latter of these outcomes depends on multiple factors, and it is not entirely clear in which direction the impact of immigration will turn over time.
The fiscal impact of immigration depends largely on actual, long-term employment trends for immigrants. Immigrants who arrive for reasons of work or studies are likely to improve the balance of public finances, whereas, in the context of existing labor market institutions and active labor market policies, those who arrive on humanitarian grounds will, on average, weaken public finances.
The majority of working-age immigrants arrive for employment reasons. It may, however, be useful to split the immigration policy debate into two categories: employment-based immigration and humanitarian-based immigration.
In terms of employment-based immigration, we must consider how Finland could be made as attractive as possible for the globally mobile workforce. Eliminating administrative hurdles is a first step, but not a big enough one. Society must be made so attractive in other ways as well that a top expert will choose Finland over a competing country. Some factors cannot be influenced by political action, including language and climate, but many others can be enhanced and made more tempting.
When it comes to the humanitarian immigration of asylum seekers and refugees, the question is more of international commitments and value choices; society’s current institutions do not help achieve a sufficiently high rate of employment among this group of immigrants, which thereby economically weakens public finances. This need not be the case, however. Investments should be made to integrate immigrants more effectively, and the analytical reasons for their low employment rate should be explored. A culture of experimentation that is systematic and informed by high-level research would be a great first step.
References
Anderson, K. H. & Huang, Z. (2019). Can immigrants ever earn as much as native workers? IZA World of Labor, Institute of Labor Economics (IZA), 159. doi: 10.15185/izawol.159. v2
Asplund, R., Kauhanen, A., Päällysaho, M. & Vanhala, P. (2018). Palkkatuen vaikuttavuus – palkkatukijärjestelmän ja sen uudistuksien arviointi. Prime Minister’s Office publication series on its reporting and research activities 75/2018.
Auerbach, A. J., Gokhale, J. & Kotlikoff, L. J. (1994). Generational Accounting: A Meaningful Way to Evaluate Fiscal Policy. Journal of economic perspectives, 8(1), 73–94.
Auerbach, A. J. & Oreopoulos, O. (2000). The fiscal impact of US immigration: a generational accounting perspective. In: J. M. Poterba (ed.), Tax Policy and the Economy, Vol. 5 (pp. 123–156). MIT Press.
Avorin, D. (2017). Displacement jobs – On the Swedish employment subsidies. Timbro Arbetsmarknad rapporter. Retrieved from https://timbro.se/arbetsmarknad/displacement-jobs-swedish-employment-subsidies/
Bell, B. (2019). Crime and immigration. IZA World of Labor, 33. doi: 10.15185/izawol.33.v2
Bell, B., Fasani, F. & Machin, S. (2013). Crime and immigration: Evidence from large immigrant waves. Review of Economics and Statistics 95(4), 1278−1290.
von Below, D. & Thoursie P. S. (2010). Last in, first out? Estimating the effect of seniority rules in Sweden. Labour Economics, 17(6), 987–997. https://doi.org/10.1016/j. labeco.2010.02.007
Bianchi, M., Buonanno, P. & Pinotti, P. (2012). Do immigrants cause crime? Journal of the European Economic Association 10(6), 1318−1347.
Bjuggren, C. M. (2018). Employment protection and labor productivity. Journal of Public Economics, 157, 138–157.
Busk, H., Jauhiainen, S., Kekäläinen, A., Nivalainen, S. & Tähtinen, T. (2016). Maahanmuuttajat työmarkkinoilla. Tutkimus eri vuosina Suomeen muuttaneiden työurista. Finnish Centre for Pensions studies 6/2016. Suomen yliopistopaino.
Card, D. (2009). Immigration and Inequality. American Economic Review, 99(2), 1–21.
Chevalier, A. (2014). How to attract foreign students. IZA World of Labor 2014, 36. doi: 10.15185/izawol.36
CIMO. (2014). Ulkomaalaisten opiskelijoiden työllistyminen Suomeen. Faktaa Express 5A/2014. Retrieved from http://cimo.innofactor.com/palvelut/julkaisut/selvitykset/faktaa_express_5a_2014
CIMO. (2016). Suomessa, töissä, muualla? Faktaa Express 1A/2016. Retrieved from https://www.oph.fi/fi/tilastot-ja-julkaisut/julkaisut/faktaa-express-1a2016-suomessa-toissa-muualla
Collado, M. D., Iturbe-Ormaetxe, I. & Valera, G. (2004). Quantifying the impact of immigration on the Spanish welfare state. International Tax and Public Finance, 11, 335–353.
Constant, A. (2014). Do migrants take the jobs of native workers? IZA World of Labor, 10. doi: 10.15185/izawol.10
D’Amuri, F., & Peri, G. (2011). Immigration, jobs and employment protection: evidence from Europe. NBER Working Paper No. 17139.
Dustmann, C., Fabbri, F. & Preston, I. (2005). The impact of immigration on the British labour market. The Economic Journal, 115(507), F324–F341.
Dustmann, C., Frattini, T. & Preston, I. (2013). The effect of immigration along the distribution of wages. Review of Economic Studies 80(1), 145–173.
Dustmann, C., Glitz, A. & Vogel, T. (2009). Employment, wages, and the economic cycle: differences between immigrants and natives. European Economic Review, 54(1), 1–17.
European Social Survey. (2014). ESS Round 7 Data. Data file edition 2.2. NSD – Norwegian Centre for Research Data, Norway – Data Archive and distributor of ESS data for ESS ERIC. doi:10.21338/NSD-ESS7-201
Furtado, D. (2016). Fertility responses of high-skilled native women to immigrant inflows. Demography, 53(1), 27–53. https://doi.org/10.1007/s13524-015-0444-8
Furtado, D. (2015). Immigrant labor and work-family decisions of native-born women. IZA World of Labor, 139. doi: 10.15185/izawol.139
Genc, M. (2014). The impact of migration on trade. IZA World of Labor, 82. doi:10.15185/izawol.82
Gould, E. D. & Klor, E. F. (2016). The long-run effect of 9/11: Terrorism, backlash, and the assimilation of Muslim immigrants in the west. The Economic Journal, 126(597), 2064–2114. https://doi.org/10.1111/ecoj.12219
Grossmann, V. (2016). How immigration affects investment and productivity in host and home countries. IZA World of Labor, 292. doi: 10.15185/izawol.292
Hinte, H. & Zimmermann, K. F. (2014). Does calculation hold? The fiscal balance of migration to Denmark and Germany. IZA Policy Paper, No. 87. Institute for the Study of Labor (IZA). Bonn, Saksa.
Kinnunen, H., Mäki-Fränti, P. & Viertola, H. (2014). Julkisen talouden kestävyystarkasteluja. BOF Online 1/2013. Bank of Finland. Retrieved from http://urn.fi/URN:NBN:fi:bof-20140807718
Kangas, O., Jauhiainen, S., Simanainen, M. & Ylikännö, M. (ed.) (2020). Suomen perustulokokeilun arviointi. Ministry of Social Affairs and Health reports and memoranda 2020:15.
Kotamäki, M. & Vaittinen, R. (2019). Suomalaisten sukupolvitilien laskeminen – julkinen talous eri sukupolvien näkökulmasta. Kansantaloudellinen aikakauskirja 3/2019.
Kugler, A. D. & Saint-Paul, G. (2004). How do firing costs affect worker flows in a world with adverse selection? Journal of Labor Economics, 22(3), 553–584.
Larja, L. & Sutela, H. (17.12.2015). Ulkomaalaistaustaisten miesten työllisyysaste lähes samalla tasolla kuin suomalaistaustaisilla – naisilla enemmän vaikeuksia työllistyä.
Statistics Finland. Retrieved from https://www.stat.fi/tup/maahanmuutto/art_2015-12-17_001.html
Lehti, M., Aaltonen, M., Hinkkanen, V. & Niemi, H. (2014). Maahanmuuttajat rikosten uhreina ja tekijöinä rekisterilähteiden valossa. Teoksessa M. Lehti, V. Salmi, M. Aaltonen, P. Danielsson, V. Hinkkanen, H. Niemi, R. Sirén & K. Suonpää (ed.), Maahanmuuttajat rikosten uhreina ja tekijöinä, (pp. 3–107). National Research Institute of Legal Policy studies 265. Tammerprint.
Lucchino, P., Rosazza-Bondibene, C. & Portes, J. (2012). Examining the relationship between immigration and unemployment using National Insurance Number registration data. NIESR Discussion Paper, 386. Maahanmuuttovirasto. (2020). Toimeentuloedellytys opiskelijoille.
Retrieved from https://migri.fi/opiskelu-suomessa/toimeentulo
Maliranta, M. & Nurmi, S. (2019). Maahanmuuttajien yritystoiminnan merkitys Suomen työllisyyden ja tuottavuuden yritysdynamiikalle. Kansantaloudellinen aikakauskirja, 115(2), 289–316. Retrieved from http://urn.fi/URN:NBN:fi:-jyu-201906243398
Migration Advisory Committee [MAC]. (2012). Analysis of the impacts of migration. Retrieved from https://www.gov.uk/government/publications/analysis-of-the-impacts-of-migration
MAC. (2018). EEA migration in the UK: Final report. Retrieved from https://www.gov.uk/government/publications/migration-advisory-committee-mac-report-eea-migration
OECD. (2020). International Migration Database. Retrieved from https://stats.oecd.org/Index.aspx?DataSetCode=MIG
Ottaviano, G. I. P., & Peri, G. (2006). The economic values of cultural diversity: Evidence from US cities. Journal of Economic Geography 6, 9–44. https://doi.org/10.1093/jeg/lbi002
Peri, G. (2012). The effect of immigration on productivity: Evidence from U.S. states. Review of Economics and Statistics, 94(1), 348–358. https://doi.org/10.1162/REST_a_00137
Peri, G. (2014). Do immigrant workers depress the wages of native workers? IZA World of Labor, 42. doi: 10.15185/ izawol.42
Roodenburg, H., Euwals, R. & ter Rele, H. (2003). Immigration and the Dutch economy. CPB Netherlands Bureau for Economic Policy Analysis.
Salminen, S. (2015). Maahanmuutot ja Suomen julkinen talous. Osa 1: Toteutuneet julkisen talouden tulot ja menot. Suomen perusta. Retrieved from https://www.suomenperusta.fi/content/uploads/2019/10/Maahanmuutot-ja-Suomen-julkinen-talous-osa-1-toteutuneet-julkisen-talouden-tulot-ja-menot-v4.pdf
Salminen, S. (2019). Maahanmuutot ja Suomen julkinen talous. Osa 2: Elinkaarivaikutukset: Suomi, Irak ja Somalia. Suomen perusta. Retrieved from https://www.suomenperusta.fi/content/uploads/2019/10/Maahanmuutot-ja-Suomen-julkinen-talous-osa-1-toteutuneet-julkisen-talouden-tulot-ja-menot-v4.pdf
Schwab, K. (ed.) (2019). The Global Competitiveness Report. World Economic Forum.
Spenkuch, J. L. (2014). Understanding the impact of immigration on crime. American Law and Economics Review, 16(1), 177−219.
Statistics Finland. (2018). Official Statistics of Finland (OSF). Migration [online publication]. ISSN=1797-6766. Retrieved from http://www.stat.fi/til/muutl/index.html
Steinhardt, M. (2018). The impact of xenophobic violence on the integration of immigrants. IZA Discussion Paper No. 11781.
Tervola, J. (2015). Maahanmuuttajien kotihoidon tuen käyttö 2000-luvulla. Yhteiskuntapolitiikka, 80(2), 121−133. Tervola, J. (19.5.2016). Kotihoidon tuki vai kotouttaminen? Sosiaalivakuutus. Retrieved from https://sosiaalivakuutus.fi/kotihoidon-tuki-kotouttaminen/
UNESCO. (2020). UNESCO Institute for Statistics (UIS) [online materials]. Retrieved from http://data.uis.unesco.org/
VATT working group. (2014). Maahanmuuttajien integroituminen Suomeen. VATT Publications 67. VATT Institute for Economic Research. Edita Prima.
Work, family, security — migrants and Finland’s demographic future (Minna Säävälä)
For the sake of ensuring sustainable population development in Finland, it sounds like a good idea if people of working age are moving to this country for employment reasons. Although the economic situation caused by the COVID-19 pandemic also affects the opportunities of people with a foreign background to find employment in Finland, the challenges to our population structure are not going anywhere. Mauri Kotamäki’s article in this publication highlights the economic benefits and difficulties related to employment- based migration. Today, however, migration is not something that can be used as a quick, on-call solution to economic needs, and it is not possible to conjure a well-functioning and multicultural society out of nowhere: conscious decision-making is needed to achieve both of these things.
Even though there are immediate demographic and economic benefits when immigrants enter the work force, this does not mean that we should view them merely as instruments of labor. Each immigrant is also an individual and a human being, with their own family ties, needs, desires, responsibilities and rights. Balanced and sustainable demographic development in the future requires that we build a community that respects human rights and is founded in the principles of nondiscrimination and inclusion.
Where to find the immigrants?
Compared to Western European and Nordic countries, Finland has very few people who are foreign-born (7%), with a foreign background (7%) or citizens of a foreign country (5%) (Statistics Finland, 2019a). As a destination country, Finland is a neophyte. Immigration has been restricted by means such as the priority that privileges EU citizens on the labor market,
as well as strict policies regarding family reunification and refugees.
Research is not able to predict very accurately how migration will develop on a global scale. At the moment, approximately three percent of the world’s population lives in a country other than the one in which they were born. Regional differences are vast. In the United Arab Emirates, the world’s largest country of immigration, more than 80% of the population is made up of immigrants. Making predictions about migration is quite difficult, as political, economic and ecological conditions can change without warning. These changesin turn are reflected in the opportunities to move and people’s willingness to do so (e.g., Bijak et al., 2019). It is still too early to predict the longer-term effects of the COVID-19 situation on global migration – right now, migration is at a near-standstill. If there is a global economic downturn, the forces that push people to migrate will strengthen.
Most likely, global mobility will increase. At the very least, people’s willingness to move will increase. Certain places will attract with compelling factors such as work, freedom or affluence, while others push people to move on because of oppression, poverty or limited opportunities. Migrations have always responded to such factors, whether it was during the Viking conquests, the colonial settlement of America or the current waves of migration from the Middle East. Migration requires a wide array of resources: money, information, education, courage and the presence of networks.
If we want more immigrants to come to Finland, we should think about the ways in which they could find their way here and, once here, what we could do to get them to stay. How would these potential new workers and experts ever even learn that Finland – this small, distant society – could be their future home? The proponents of increasing employment-based migration to Finland don’t always seem aware of the harsh realities and restrictions associated with moving here. For those outside Europe, the primary ways of moving to Finland are presently the following:
- Finding a job before moving (employment-based migration)
- Marrying an immigrant or Finnish citizen who lives permanently in the country and is earning enough
- Being accepted as a student or
- Arriving as an asylum seeker or quota refugee.
In 2019, the most common reason for a foreigner to move to Finland was employment – it was the first time that work became the most significant reason for moving. For 35% of immigrants, employment was the basis for being granted their initial residence permit or registration as an EU citizen, and for 34%, it was family ties (see Figure 1). For a long time, family ties were by far the most common justification for immigrating. The 2019 situation shows the increase in EU migration particularly for work reasons, probably as a consequence of Brexit. Nearly 33,000 people moved to Finland from abroad, one in four of whom was a Finnish citizen. Over the last decade, net migration has ranged between 12,000 and 18,000 persons per year (Statistics Finland, 2019b).
Families provide support and encourage integration
Even though family ties, alongside work, are the most important reason to come to Finland, getting one’s nuclear family here is anything but automatic. The main reason for this is the so-called income requirement – though family members may be refused entry on other grounds as well. For example, prolonged separation can be interpreted as a break in the family bond between a child and parent. An immigrant who wants to reunify their family must be able to support the entire nuclear family without societal support.16 The income requirements for an employed immigrant hoping to reunify their family are so high that, for example, someone who works as a bus driver will find it difficult to get a spouse and two children into the country.
Figure 1. Family and work are the primary reasons for why foreigners move to Finland. The first residence permits issued by the Finnish Immigration Service to third-country nationals and the registration of the right of residence of EU citizens and their family members in 2019
Source: Immigration Indicators 2019, Finnish Immigration Service, 2020, and website at https://tilastot.migri.fi/index.html#decisions?l=en&end=5999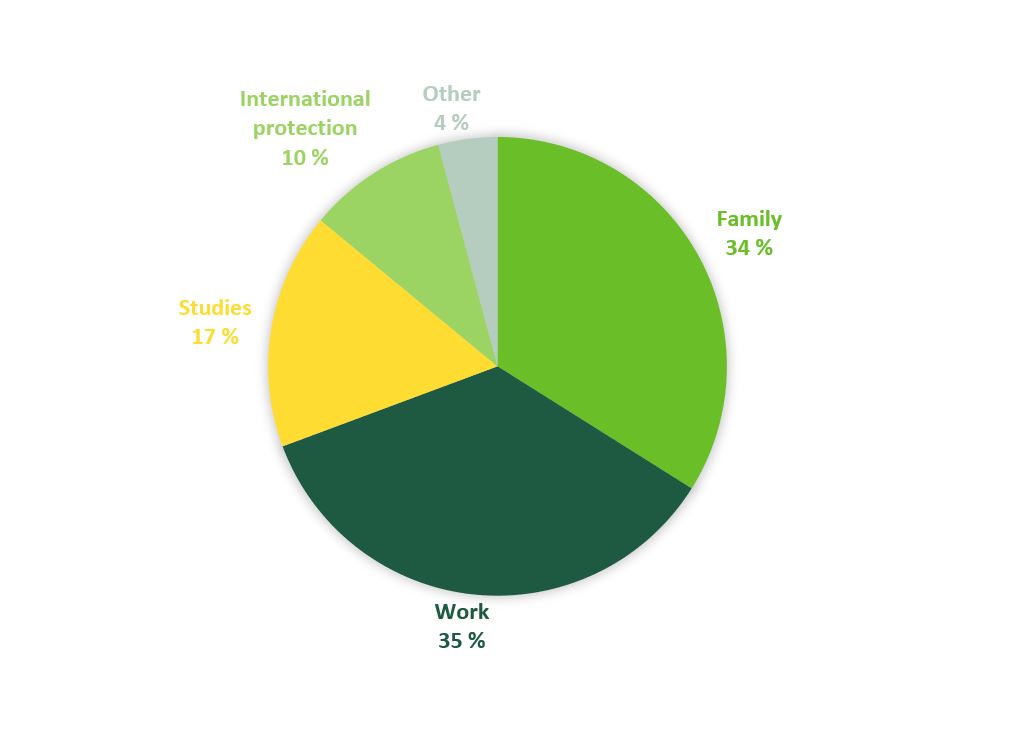
A family helps newcomers form bonds to the local life and society. The stringent income requirements for family reunification signal to immigrants that Finnish
16 This does not apply to family reunifiers who are Finnish citizens, asylum recipients who apply within three months of
being granted asylum or quota refugees who apply within three months from entering the country.
Education as opportunity
There is the desire to control migration through political decision-making, but this is not always successful. For example, it is difficult to prevent educated young people from leaving to look for opportunities elsewhere. When examining the effects of migration, it is important to also pay attention to emigration. In the case of Finland, more educated people are leaving than arrive here from other countries. In 2018, nearly a thousand more Finnish citizens with an academic degree left Finland than moved back here (Statistics Finland, 2020).
The highly educated comprise a global elite for whom countries all over the world are competing. Yet it is pointless for us to think of the young adults who leave Finland as a total loss to society; it is better, instead, to focus on ways of enticing them to return later, to enrich Finland’s local life, population and economy.
Thousands of foreign students are currently studying in Finland, and they should be encouraged to stay. According to a recent study, foreigners who complete a degree in Finland are, in fact, more likely to stay on after graduation than in many comparison countries: three years after graduation, 60–70% were still living in Finland (Mathies & Karhunen, 2019). Even more should be done to keep the remaining one-third in Finland and help them find jobs. Adequate compulsory Finnish or Swedish studies as part of each degree would make it easier to find employment and thus stay in the country.
Those who come to work
Migrants should not be spoken of merely as “labor” meant to benefit Finland or its citizens. This kind of language renders someone who moves from abroad into an instrument for bringing well-being to someone else. A similar way of thinking prevailed, for example, in the 1950s and 1970s, when Germany and Sweden brought in migrant workers with the idea that they would work for as long as they were needed and then leave. It was not seen as desirable for them to build a more permanent life for themselves in those countries.
If immigrants are viewed as instruments, they will face difficulties in being accepted as part of society. The newcomers themselves will not see the country as their own or be willing to commit to its ways of life or its values. This type of utilitarian approach to “migrant workers” is offensive to human dignity and detrimental to the integration of newcomers. We must make an effort to integrate newcomers into Finnish society.
Finland faces quite a challenge in becoming recognized as a potential destination country for the professionals and experts for whom many countries are in competition. Foreigners’ prior knowledge of Finland is generally limited, its business world relatively small, the language foreign and its working life somewhat insular, and few foreigners have existing networks here. The services and benefits available to families, as well as our family-friendly working life, are secret weapons that could affect the choice someone makes when selecting a country of residence. If diversity and different backgrounds become more accepted and highly valued than at present, Finnish working life could attract both foreign workers as well as Finnish return migrants who went elsewhere. We must eradicate both the covertly and the openly discriminatory and racist practices in working life and in society.
Thousands of highly educated people with a foreign background already live in Finland, unemployed or in jobs that do not match their skills. They are an invisible resource that is rarely noticed. Many arrived originally for family reasons, as spouses or children. Recruiters should be cognizant of this competence potential and learn to read the particular competencies that immigrants do not always know to communicate in a way that is recognized here.
Immigrants with international protected status
Only a limited number of immigrants arrive on the basis of international protected status. Contrary to popular belief, the share of refugees among all immigrants is quite small. Of the first residence permits issued in 2019, 10% (3,709) were issued to those in need of international protection or to quota refugees (see Figure 1). Engaging in a conversation about immigration and speaking solely about people with refugee backgrounds severely distorts perceptions regarding the situation.
People with refugee backgrounds become employed at a slow pace. Many, including those who are employed, remain reliant on income transfers for many years. The number of income transfers per unit has been found to be about twice as high as that of native Finns (Sarvimäki, 2017). The reasons include a higher incidence of unemployment and incapacity to work, large families and low-paid jobs.
Many factors contribute to the difficulties that people with international protection experience when it comes to finding work. those who have fled wars, crises and collapsed states are often not healthy, welltrained experts when they first arrive. People who have endured living in the midst of armed conflict require significant social, healthcare and integration service investments in order to become rehabilitated, trained and integrated into the labor market. If living on social security becomes prolonged as a result of health or employment difficulties, or because of integration and inclusion problems, the reliance on societal support that may have initially been a source of embarrassment to someone eventually starts to feel normal. For many of the underemployed or unemployed, falling back on social benefits becomes a trap that lowers their self-esteem and their social and psychic well-being (Yijälä & Luoma, 2018). Well-being and opportunities for employment are significantly eroded by the experience of discrimination and racism. If we could reduce the prejudices against people of Middle Eastern and Somali origin in the labor market (Ahmad, 2019), it might help those with a refugee background find employment. Developing the measures aimed at integration in ways that promote rapid employment will help improve the situation, as seen in Sweden.
For human rights reasons, it is important that people in need of international protection have the opportunity to seek asylum if their life or health is at stake – the international conventions of which we are signatories already require this. Asylum policy is part of the global responsibility of affluent nations. We must help those who are in need and require protection, if we want to do our part in an unjust world. At the same time, we must advance conflict resolution and fairer economic development in international cooperation.
Most people who move to Finland come here for work or family. Contrary to popular belief, only a small proportion, about 10%, of all immigrants have a refugee background.
The residence permit regulations currently in effect in Finland make it difficult to stay in the country, even after one’s life has begun to take shape and integration has begun. Many asylum seekers who have received a negative decision find themselves in an absurd situation: they may have a job or be in the middle of their studies, and still be expelled.
Managed immigration does not mean preventing immigration – it means channeling it in a way that is sensible and humane.
Toward a sustainable immigration policy
Management of immigration is important for both those who already live here and for those who arrive. Managed immigration does not mean preventing immigration – it means channeling it in a way that is sensible and humane.
When working-age people immigrate to Finland, their arrival creates opportunities for both economic innovation and growth (see the chapter by Kotamäki in this report). Without sustainable economic development, the welfare state and its aspirations for equality have no future. Therefore, we should make it easier for people to come to Finland and stay here. Larger employers should have a streamlined and rapid work permit process to allow them to quickly fill shortages of experts by recruiting them directly from abroad. The economic downturn or recession that will hit us in the near future will eventually recede, and the impending challenges related to demographic change and the welfare state will become ever-more pressing. The availability of labor will help the burgeoning economy recover once the worst is over. We need to prepare for that situation right now.
One innovative solution would be to allow migration from non-European countries on a temporary work visa, applying the Canadian scoring system. This should be a joint European effort to enable employment-based migration from third countries of educated young adults with good language skills.
If newcomers are unwilling or unable to stay on in Finland, employment-based migration will not be enough to move us toward economically sustainable demographic development. We have to advance a more diverse and non-discriminatory labor market so that we can offer both employment and equality to those with a foreign background who are already in the country, and so that the newcomers find satisfaction in their work and in their lives. The goal should be that as many newcomers as possible who arrive here and find a way to work or study, would stay on and build not only their own lives here but also help build our shared, diverse society. The opportunity to bring one’s family from the country of origin is part of having a meaningful life. Each of us is partly responsible for ensuring that those who come here also stay and become part of Finland.
An approach that is informed purely by economics is not enough to create a just, prosperous and diverse society that breeds well-being. In refugee policy, the cornerstone must always be our global humanitarian responsibility. This responsibility should be put into practice by taking in more quota refugees directly from refugee camps – it is our duty as an affluent and
responsible society. In addition, this allows for greater fairness in the selection of refugees. Alongside this, we need to maintain a well-functioning asylum system that is able to make speedy decisions. Family is an important reason and justification for moving to Finland, though few people are aware of or remember this fact. We should support the integration and employment of immigrants who are here because of family ties much more intentionally. Right now, too
many women and men are excluded from working life and society after moving to Finland as someone’s spouse. Family reunification should be made possible at lower income limits. The family is a resource that helps people integrate and binds people to this country. It is cruel to keep people apart from their loved ones.
Integration services should focus on rapid employment, not a years-long state of intermediate existence. Those who manage to become employed quickly must retain the right to free language studies, which is something one loses in the current system. The focus of integration activities should be shifted to working life and employment, and labor market subsidies should be developed to support this, by adapting the models used in Sweden and by supporting the changes that are already underway in our integration measures.
Immigrants alone will not solve the structural problem of Finland’s dependency ratio unless the birth rate also recovers at least somewhat. But they can be part of the solution and help maintain and renew our society’s vitality. In order to significantly slow down the decline in the number of working-age people and reduce the growing sustainability gap, much greater numbers of new and rapidly employed – i.e., skilled – immigrants would be needed each year. It is unrealistic to expect that thousands more of such immigrants would magically appear year after year – we cannot expect immigrants to arrive exactly when we need them most.
While integration affects immigrants, it also involves us – it is something that must be consciously and consistently created by strengthening inclusion and equity at work, in schools and educational establishments, and in residential areas. Both sides of the social equation must change, be flexible and learn. At best, an increasingly diverse population, brought about by immigration, will benefit everyone in Finland, the newcomers and the currents residents alike.
References
Ahmad, A. (2019). When the name matters: An experimental investigation of ethnic discrimination in the Finnish labor market. Sociological Inquiry. https://doi.org/10.1111/
soin.12276
Bijak, J., Disney, G., Findlay, A. M., Forster, J. J., Smith, P. W. F. & Wiśniewski. A. (2019). Assessing time series models for forecasting international migration: Lessons from the United Kingdom. Journal of Forecasting, 38, 470–487.
Mathies, C. & Karhunen, H. (2019). Suomeen valmistumisen jälkeen jääneet tutkinto-opiskelijat tilastojen valossa. In: V. Kazi, A. Alitolppa-Niitamo & A. Kaihovaara (ed.), Kotoutumisen kokonaiskatsaus 2019: Tutkimusartikkeleita kotoutumisesta, (pp. 69–78). Ministry’s guide books and other publications, 10. Ministry of Economic Affairs and Employment.
Sarvimäki, M. (2017). Labor market integration of refugees in Finland. Nordic Economic Policy Review, 7(1), 91–114. VATT working group (2014).
Statistics Finland. (2019a). Statistics Finland PxWeb databases: Population [electronic data]. Retrieved from http://pxnet2.stat.fi/PXWeb/pxweb/fi/StatFin/StatFin_vrm/
Statistics Finland. (2019b). Muuttoliike. Retrieved from http://www.stat.fi/tup/maahanmuutto/muuttoliike.html
Statistics Finland. (2020). Maahan- ja maastamuutto muuttomaan, koulutusasteen ja ikäryhmän mukaan, 2005–2018. Tilastokeskuksen PxWeb-tietokannat. Retrieved 17 Apr 2020 from http://pxnet2.stat.fi/PXWeb/pxweb/fi/Stat-Fin/StatFin_vrm_muutl/statfin_muutl_pxt_11ac.px/
Yijälä, A., & Luoma, T. (2018). ”En halua istua veronmaksajan harteilla, haluan olla veronmaksaja itse”: Haastattelututkimus maahanmuuttajien työmarkkinapoluista ja työnteon merkityksestä heidän hyvinvoinnilleen. Studies 2018:2. Helsinki City Executive Office.
Migration in the 2010s – regionally concentrated, selective and polarizing (Timo Aro)
Summary
- Migration in Finnish regions and municipalities consists of migration within and between those areas as well as of immigration and emigration. The majority, about two-thirds, consists of relocations within municipalities.
- Mobility between municipalities and even regions, however, has grown steadily over the last three decades.
- Without immigration, the populations of regions and municipalities would decline almost everywhere in Finland, except in the largest growth centers.
- From the standpoint of regional development, not only the number but also the kinds of migrants is essential, including characteristics like age, labor market position and education.
- Young adults aged 25–34 play a central role, negatively affecting the regions they leave behind and positively affecting the regions they move to.
- In the 2010s, migration was typically directed at the Helsinki metropolitan area, cities with universities and the surrounding peri-urban areas, as well as concentrating in points elsewhere throughout the country. Most of the movers were young and educated. Taken together, these factors mean that areas with migration gains also gain more favorable demographics from the standpoint of regional development, whereas the areas that suffer migration losses decline even further.
- For migration in the 2020s, jobs are in a key role: will the physical place where work takes place finally become irrelevant, and will jobs begin to follow workers to where they are living?
The situation of regional and demographic development in the 2010s can be described as polarized. Areas have become diverged, differentiated and distanced from one another at all regional levels. A growing feature of regional and demographic change is the simultaneous concentration, shrinkage and depopulation of permanent housing settlements. The importance of micro-location is becoming emphasized in both growing and declining areas. In addition, the population is shrinking, ageing and becoming increasingly concentrated. Many areas have drifted into a demographic quadruple helix, with declining birth rates, multiplying numbers of the elderly, declining numbers of working-age residents and paralyzing losses in migration. Simultaneously, for the first time, there are signs of fracture in the interdependence between population and job development. A region can be simultaneously experiencing positive structural changes in its economy, employment and investment, and negative structural changes in its demographic development, attractiveness and mobility.
Finland’s population growth slowed down during the 2010s. The total population would have begun to decline already in 2015 were it not for immigration. A declining working-age population poses complicated challenges for the national economy, and their number has diminished every year throughout the 2010s. Net migration has become the only population-boosting factor at the national level, and in two out of three municipalities already, it is the only positive factor in demographic development. Birth rates have fallen due to people having fewer children. The number of live births is likely to be about 15,000 less in 2019 than it was at the turn of the 2010s. This is a significant shift in the space of one decade. The total fertility rate has dropped from a fairly high level in Nordic terms to an exceptionally low level even in a European context (see the chapter by Rotkirch on the birth rate). The effects of the declining birth rate will be reflected in the structure of services and in the development of the labor force in the 2020s (see the chapter by Tikanmäki and Seuri). The changes are manifested first in child health centers, then in early childhood education, then in primary and secondary schools, and later in secondary and tertiary education.
Regional mobility has increased steadily between 1990 and 2018. In 2017–2018, people moved more between municipalities and regions than at any time since 1990, if we view the development retroactively using the current regional classification. There were 288,433 moves between municipalities and 136,294 between regions in 2018. Migration has been brisk in the 2010s. In 2010–2019, a total of about 9.1 million moves took place, both within and between municipalities, as well as international emigration and immigration. In the 2010s, an average of about 914,000 relocations occurred every year. In 2018, there were about 40% more moves between municipalities than in 1990, about 18% more than in 2000, and about eight percent more than in 2010. Figure 1 shows regional mobility between municipalities and regions between 1990 and 2018.
Figure 1. Migration volumes between municipalities and regions in 1990–2018 (using the regional classification of 1 January 2019).
Source: Statistics Finland, population; migratione 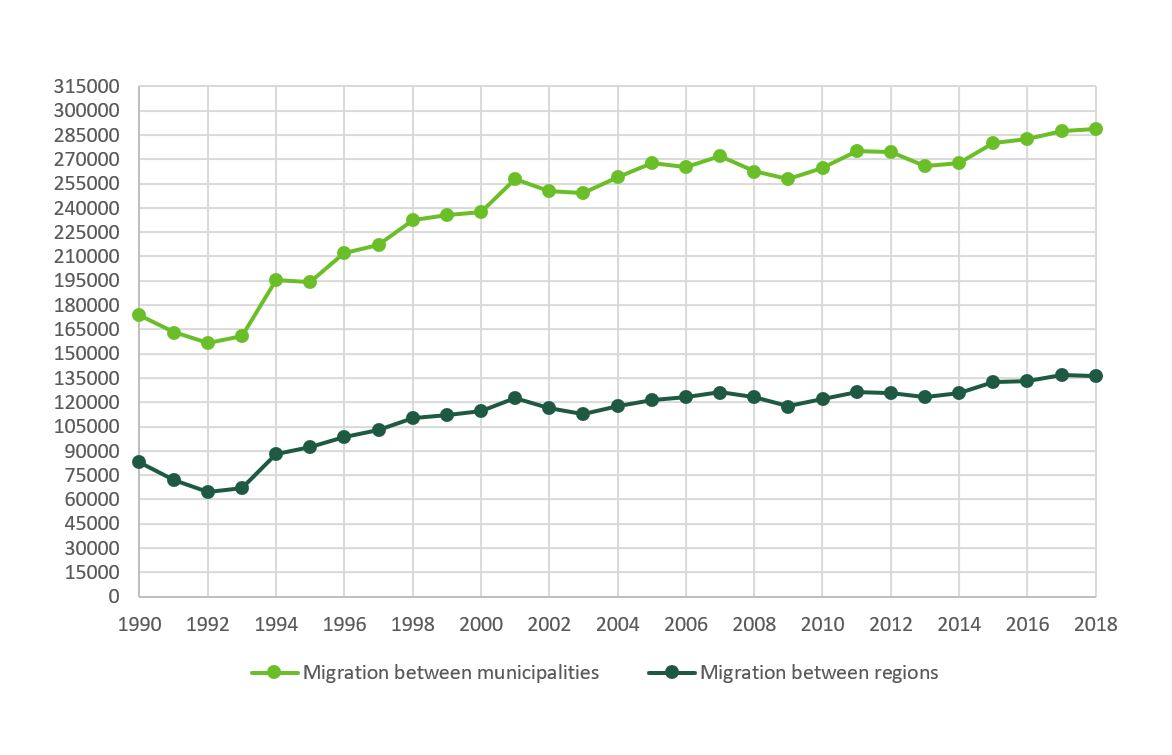
Migration is divided into the net migration that occurs between municipalities (internal migration) and international net migration (international migration). Municipal net migration directly and indirectly affects regional differences. When looking at migration volumes, it is good to note that slightly fewer than two out of three (64.6%) moves occur within one’s own municipality and slightly more than one in three (35.4%) moves take people across municipal boundaries. About 86% of cross-municipal migration consists of internal
migration and about 14% is international emigration or immigration. Less than half (45%) of cross-municipal migration occurs within the same region. In summary, about four out of five moves occur within the same functional or employment area. This represents socalled short-distance migration, occurring within one of the Finnish regions. The reasons for relocating are primarily connected to living arrangements, the housing and living environment, and the migrant’s stage of life. Only one in five moves is a so-called long-distance migration, occurring from one Finnish region to another, where the entire daily environment changes. The motives for long-distance relocations are primarily related to work, potential job opportunities, education or other reasons related to one’s life situation. Although it has been proposed that various services and amenities affect the migration decisions of particularly the so-called “creative class” (e.g., Florida, Glaeser), employment opportunities have still been found to be the main motive influencing migration decisions in long-distance relocations. Other factors mainly have a secondary effect on relocation decisions related to long-distance migration.
Internal net migration between Finland’s 19 regions in 2010–2019
An average of about 129,400 migrations occurred between the regions in 2010–2019. The number of inter-regional migrations increased especially in the second half of the 2010s. Regional net migration was twofold, when looking separately at municipal net migration
and international net migration. Only the regions at the forefront of the so-called Growth Triangle, comprised of Uusimaa, Pirkanmaa and Southwest Finland, benefited from internal migration. By contrast, all regions benefited from international net migration during 2010–2019. Total net migration was positive in all of nine regions as a result of international net migration.
Of all the regions, Uusimaa had by far the greatest migration gain in the 2010s. The total net migration of Uusimaa was about 107,000 people, or an average of about 10,700 people per year. Of Uusimaa’s migration gain, 41% came from within Finland and 59% from abroad. Pirkanmaa had the second-highest migration gain in terms of volume. The total net migration of Pirkanmaa was about 26,000 people, of which almost two-thirds was internal migration. The total net migration of Southwest Finland was about 16,600 people, of which, unlike in Pirkanmaa, nearly two-thirds came from abroad. In addition, total net migration was positive thanks to immigration in Central Finland, Päijät-Häme, North Savo, North Karelia, Ostrobothnia and Kanta-Häme. In relation to the population, total net migration was most positive in Central Finland, Päijät-Häme, North Savo, Ostrobothnia, North Karelia, South Karelia and Kanta-Häme.
Total net migration was negative in eight regions in 2010–2019. In terms of volume, the greatest migration losses occurred in South Savo, Kainuu, Kymenlaakso, Lapland and South Ostrobothnia. For example, the region of Kainuu suffered migration losses of almost 4,000 people in the 2010s. This is a significant migration loss, as the region’s population base is just over 72,000 inhabitants. Without the countervailing effect of immigration, migration losses would have risen to high volumes in most regions. In relation to the population, total net migration was most negative in Kainuu, South Savo, Lapland, South Ostrobothnia and Kymenlaakso.
Employment opportunities are still the main motive for longdistance relocations. Other factors mainly have a secondary effect on the relocation decision.
Uusimaa experienced a migration gain from all other regions except Kanta-Häme (-1,483 people) in 2010–2018. In terms of volume, Uusimaa received the greatest migration gains from North Ostrobothnia, Pirkanmaa, Central Finland and Ostrobothnia. Pirkanmaa received a migration gain during the 2010s from all other regions except Uusimaa (-6,202). Southwest Finland, on the other hand, experienced migration gains from all other regions except Uusimaa (-2,146) and Pirkanmaa (-153). In the case of the other regions, migration
gains and losses were bifurcated: the regions suffered migration losses to Uusimaa, Pirkanmaa and Southwest Finland, and experienced either migration gains or losses from individual regions. Central Finland was a positive exception to the other regions in that it suffered a migration loss only to the Growth Triangle regions but received migration gains from all other regions. On the other extreme was, for example, Kainuu, which received a marginal migration gain from only one region (South Karelia, +2 people) and suffered a
migration loss to all other regions.
Table 1. Net migration between regions, net migration and total net migration in 2010–2019.
Source: Statistics Finland, population; migration.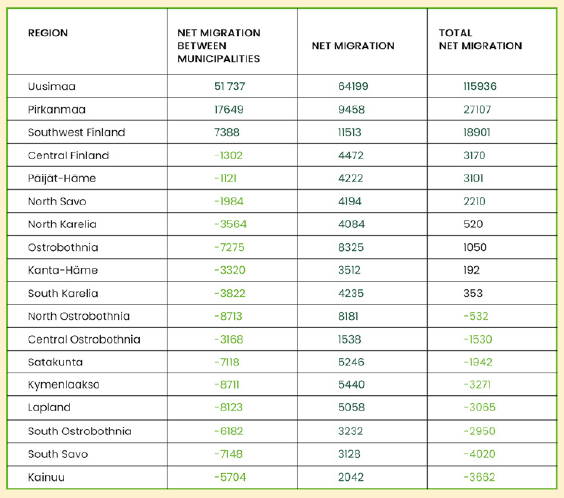
Table 2. Migration between regions, by region of departure and destination, in 2010–2018.
Source: Statistics Finland, population; migration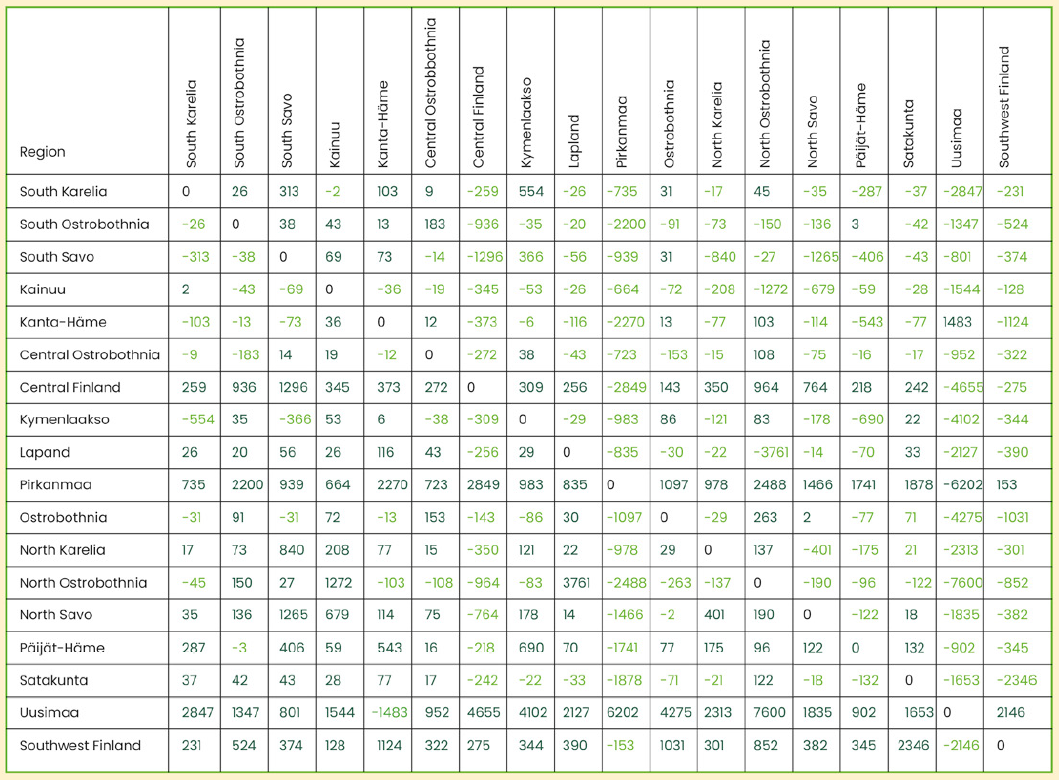
Note: Table 2 compares net migration between different regions in 2010–2018. For each region, a migration balancenwas calculated in relation to the other regions. The colors in the horizontal rows indicate whether the region has
experienced a migration gain (dark green color) or a migration loss (light green color) from the region in question.
Net migration between municipalities and international net migration in 2010–2019
Internal migration in the 2010s has been regionally polarized and bifurcated: on average, only one in six municipalities (52/311) experienced migration gains during 2010–2019. The number of municipalities that gained migration is lower than at any time since 1972, when using the current regional classification. The areas with migration gains have been regionally concentrated into clusters, primarily in the Helsinki metropolitan area, cities with universities and their surrounding peri-urban areas, as well as concentrating in points elsewhere throughout the country. About one municipality in eleven gained more than 1,000 people internally within the country in the 2010s. Among the twenty municipalities with the highest migration gains in terms of volume were the large and medium-sized cities of Helsinki, Tampere, Turku, Espoo, Vantaa, Oulu, Jyväskylä, Kuopio, Seinäjoki, Lahti and Joensuu, as well as their satellite municipalities of Järvenpää, Sipoo, Lempäälä, Pirkkala, Kaarina, Nokia, Lieto, Kangasala and Ylöjärvi. In relation to their population, some of the satellite municipalities of the largest cities received the greatest gains from internal migration: the cities among the twenty municipalities to gain the most from internal migration included Tampere (6th), Seinäjoki (11th), Turku (12th), Helsinki (13th), Kuopio (16th), as well as Jyväskylä, Vantaa and Espoo (19th.) Map 1 examines net migration between municipalities by municipality in 2010–2018.
International net migration differs most from internal migration in that all municipalities are the de facto recipients of migration gains (309/311). Finland gained a total of about 156,000 persons through immigration from abroad in 2010–2019, more than the current population of Jyväskylä within just one decade. One in seven municipalities experienced a migration gain of more than 500 people through immigration. In terms of volume, by far the greatest migration gains were seen in the central cities of the Helsinki metropolitan area: Helsinki (25,740), Espoo (15,434) and Vantaa (13,568). These three cities accounted for a total of about 54,700 people, or over a third (35.7%) of the country’s total migration gains. Turku (7,050), Tampere (5,910) and Oulu (5,027) were the next largest in terms of migration gains. In addition, Vaasa, Jyväskylä, Kotka, Lappeenranta, Lahti, Kuopio and Joensuu each achieved a significant migration gain of more than 2,000 persons. In relation to their population, small localities with immigrant reception centers, such as Kristiinankaupunki, Vöyri, Siikajoki, Punkalaidun, Pudasjärvi, Lappajärvi, Pietarsaari and Närpiö, experienced the greatest migration gains from immigration. Of large and medium-sized cities, Vantaa (9th), Kotka (13th) and Espoo (16th) were among the 20 municipalities with the greatest migration gains. With regard to international net migration, it is important to consider the onward migration of the foreign-born within Finland’s borders. Statistics show that a large part of the subsequent migration of those with a foreign background is focused on the Helsinki metropolitan area or other major cities. These migrations are more prone to concentration than those among the native population. Map 2 examines international net migration by municipality in 2010–2018.
Maps 1–2. Net migration between municipalities and net migration by municipality in 2010–2018.
Source: Statistics Finland, population; migration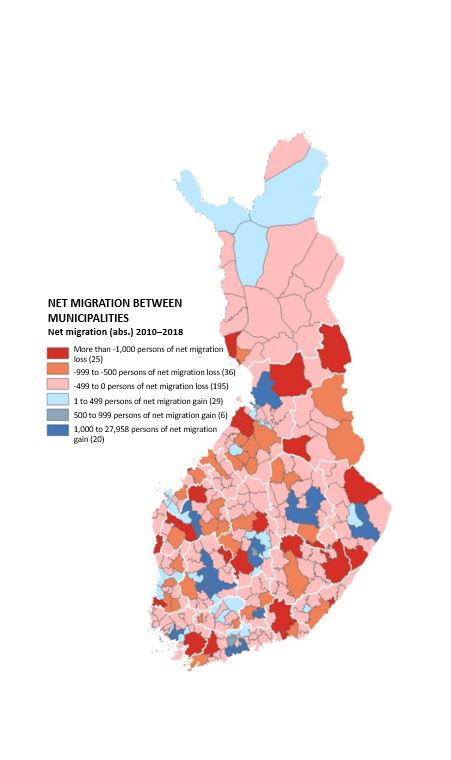
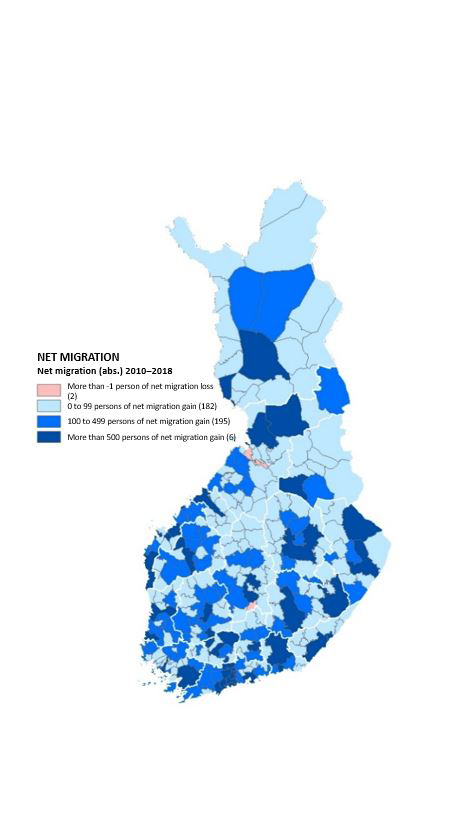
Migrants’ age structure is a special characteristic of selective migration
In addition to migration volume, it is also important to consider the structural characteristics of the migrant population, in other words, the profile or structure of the migrants who come in or out of the area. The structural characteristics of migrants are related to, among other things, age, education and income structure, as well as labor market position. The effects of migration are usually monitored using a few indicators, such as in-migration, out-migration and net migration, which are monitored as often as quarterly. Quantitative trends are frequently used to make far-reaching conclusions about regional development, even though quantitative surface data are often misleading compared to the economic, social and demographic structure of migrants. It is possible to make much more reliable conclusions regarding the development of a particular area by simultaneously looking at both the number and type of migrants. What makes migration a particularly thorny problem for the regions is that it is fundamentally selective, polarizing and centralizing. Simply put, migration strengthens the areas that are already strong and weakens the weaker ones that are already contracting. The selectiveness of migration means that the characteristics of the migrants differ from the rest of the population in terms of age structure, labor market position, education and income. A key structural characteristic is the migrants’ age structure, which is examined in greater detail in this article as an example of the selectiveness involved in migration.
Figure 2. Share (%) of migration between municipalities by age group in 2010–2018.
Source: Statistics Finland, population; migration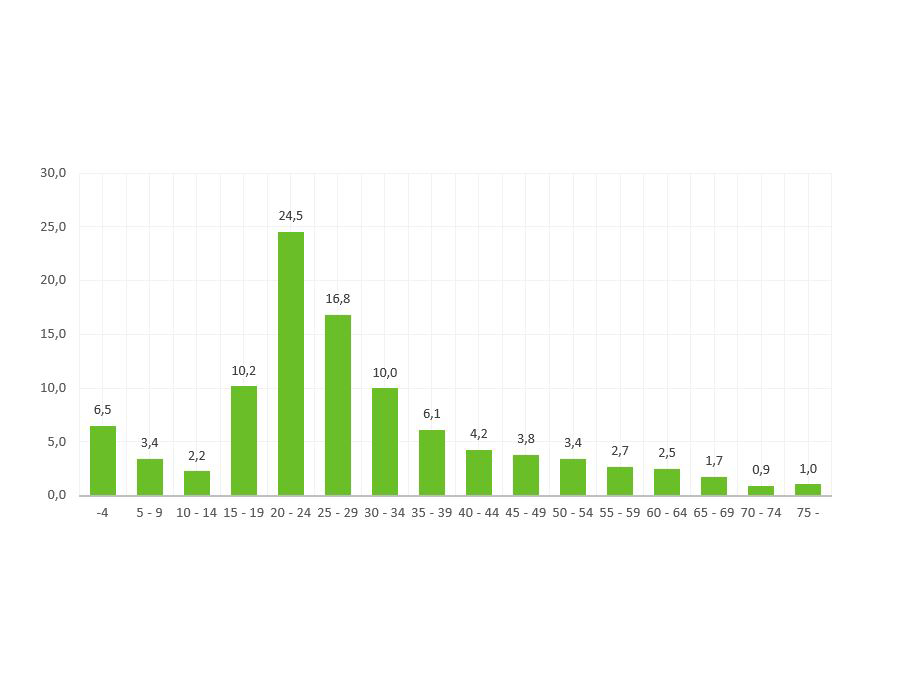
What makes migration a particularly thorny problem for the regions is that it is fundamentally selective, polarizing and centralizing. Simply put, migration strengthens the areas that are already strong and weakens those that are already contracting.
Every migrant generates revenue and expenditure effects in both the departure and destination areas. The revenue effects in both areas are connected to tax revenue, tax-based equalization and state contributions, while the expenditure effects concern the demand for public services, the need for housing and land, infrastructure and the production of services. All of migration’s revenue and expenditure effects are directly or indirectly linked to migrants’ age structure. Over-represented among migrants are young people aged 15–24 and young adults aged 25–34. Between 2010 and 2018, a total of about 2.5 million inter-municipal moves took place, with more than seven in ten (73.6%) moves made by people under 35 and only about one in four (26.4%) by people over the age of 35. In terms of volume, examined by five-year age groupings, the most migration occurred in the age group of 20–24-year-olds: about one in four (24.5%) of all migration occurred in the above-mentioned age group. The second highest number of moves occurred in the age group of 25–29-year-olds (16.8%) and the third highest in the age group of 15–19-year-olds (10.2%). Slightly more than half of all moves occurred in the 15–29 age group (51.5%). The number of moves decreases by five-year age grouping, starting with the 25-year-olds’ age group. The number of moves by those over the age of 65 remains marginal in all migration flows, as only 3.6% of all inter-municipal migrations in 2010–2018 were made by the aged. In addition, the moves by the aged are mainly local migration between different parts of the same municipality or between adjacent municipalities.
The relocations of young people aged 15-19 reflect the locations of secondary educational institutions. On average, only one in eleven municipalities (28/311) gained migration from young people in 2010–2018. Those municipalities that did gain this type of migration shared a common feature in that they featured abundant educational opportunities. The largest university towns experienced the greatest migration gains. Helsinki, Tampere and Turku gained more than or about 10,000 persons each. Oulu and Jyväskylä each gained more than 6,000 young people. A total of 15 cities achieved a migration gain of more than 1,000 young people. In addition to the above, in the order of their ability to pull migrants, were Joensuu, Kuopio, Lahti, Vaasa, Espoo, Seinäjoki, Vantaa, Rovaniemi, Lappeenranta and Pori. The satellite municipalities of large cities and certain regional centers, all with limited educational offerings, suffered the greatest quantitative losses of young people. Nurmijärvi, Tuusula, Kouvola, Ylöjärvi and Hollola experienced migration losses of more than 1,000 young people. The 15–19 age group show the powerful role of secondary education in propelling moves, benefiting not only the traditional university cities but also regional and sub-regional centers. Map 3 depicts the net migration of 15–19-year-olds in 2010–2018.
Migration gains in the 20–24 age group are even more unevenly distributed between regions compared to the 15–19 age group. Only 18 municipalities experienced migration gains from 20–24-year-olds – all of them growth centers with diverse and wide-ranging educational opportunities. The 20–24-year-olds brought migration losses to 95% of all municipalities. In terms of numbers, Helsinki’s migration gain was in a class of its own: about 29,000 people in 2010–2018. Tampere gained about 13,600 young people aged 20–24 and Turku about 11,600.
Maps 3–4. Net migration of young people aged 15–19 and 20–24 in municipalities in 2010–2018
Source: Statistics Finland, population; migration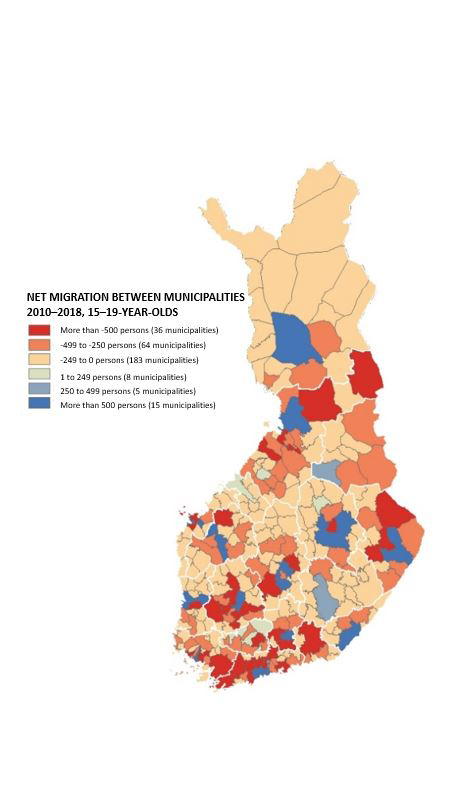
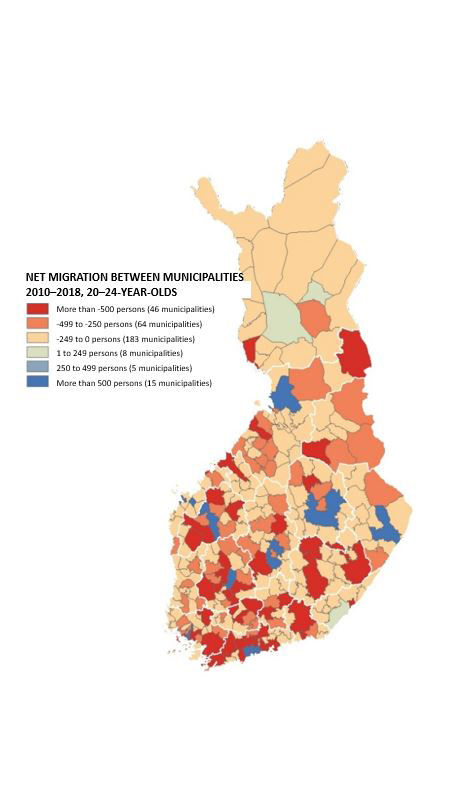
Oulu and Jyväskylä benefited by more than 5,000 people. Vantaa, Kuopio, Vaasa, Joensuu, Seinäjoki and Espoo also had significant quantitative migration gains. Several regional and sub-regional centers and the satellite municipalities of large cities suffered the greatest migration losses of young people. Ten municipalities lost more than or about 1,000 people to out-migration. The largest quantitative migration losses occurred in Salo, Kouvola, Nurmijärvi, Tuusula, Lohja, Porvoo, Kirkkonummi, Savonlinna, Hämeenlinna and Vihti.
The group of young adults aged 25–34 is in a key role when it comes to migration. This age group includes large numbers of the recently graduated, the educated, those in the process of starting or expanding a family, or those in the early stages of their careers. The choices that these young adults make regarding their place of residence and their living arrangements are important for the future development of these areas. This age group’s relocations have negative multiplier effects over time on the departure areas and positive ones on the destination areas. The migration gains and losses resulting from young adults are more evenly distributed among municipalities, unlike with the 15–24 age group of young people. In 2010–2018, 159 municipalities experienced migration gains and 152 municipalities had migration losses. The central cities of the Helsinki metropolitan area and the satellite municipalities of large cities experienced the greatest migration gains from young adults. In the course of the 2010s, a total of 17 municipalities gained more than 1,000 young adults. The greatest migration gains went to Vantaa and Espoo: Vantaa took in about 6,300 and Espoo about 5,600 young adults. In addition, Nurmijärvi, Ylöjärvi, Kaarina, Tuusula, Kangasala, Lieto, Kirkkonummi, Helsinki, Lempäälä, Nokia, Järvenpää, Pirkkala, Sipoo, Vihti and Laukaa each gained more than 1,000 people. The greatest quantitative migration losses of young adults occurred in the large university cities outside the Helsinki metropolitan area, such as Turku, Tampere, Jyväskylä, migrationOulu, Joensuu, Vaasa and Kuopio. These cities lose a lot of recent graduates especially to the Helsinki metropolitan area. Turku’s migration loss from young adults was about 9,900. Other loser cities were Tampere (-8,600), Jyväskylä (-5,700), Oulu (-4,900), Joensuu (-3,200), Vaasa (-2,800), Kuopio (-1,900), Lappeenranta (-1,800) and Lahti (-1,100). Map 5 shows the net migration of young adults by municipality in the 2010s.
Maps 5–6. Net migration of young people aged 25–34 and 35–64 by municipality in 2010–2018.
Source: Statistics Finland, population; migration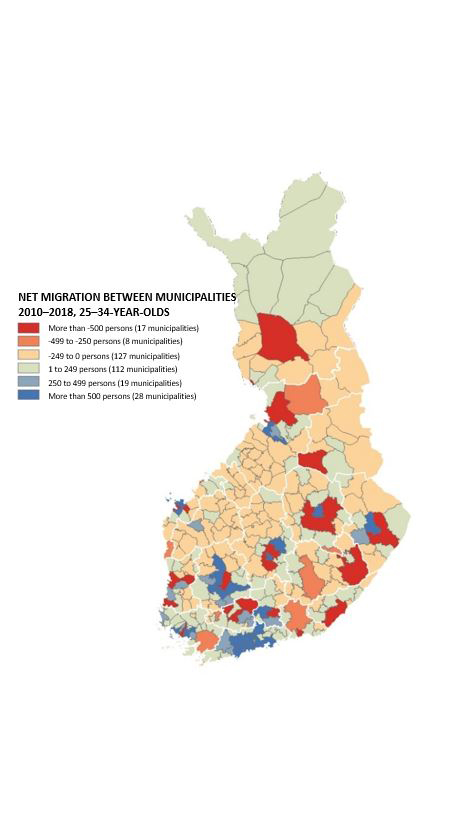
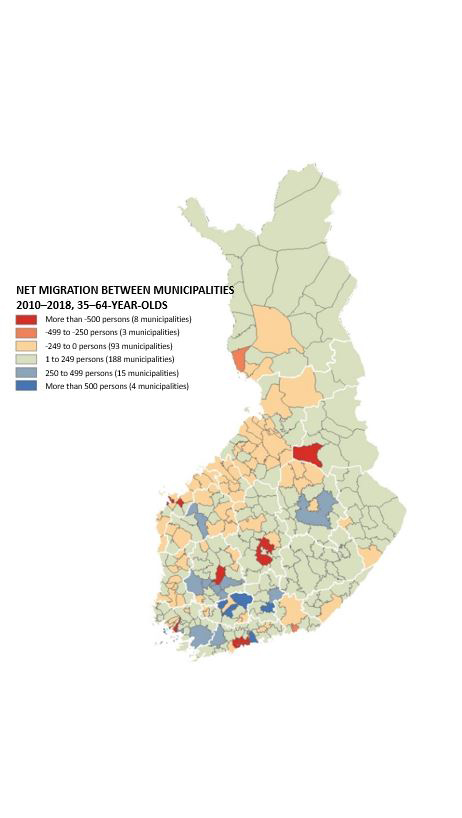
The migration volumes of the 35–64 adult population are significantly smaller than those of the age groups of young people and young adults. The moving of the adult population accounts for about one-fifth of all migration in the 2010s. In 2010–2018, the adult population’s moves yielded migration gains to two out of three (206) municipalities and migration losses to one out of three (105) municipalities. Hämeenlinna was the only municipality that gained more than 1,000 people aged 35–64. Seven municipalities gained more than or about 500 people: Sipoo, Lahti, Naantali, Seinäjoki, Kauniainen, Kaarina and Kuopio. The greatest migration losses of adult population centered on the other large central cities in the Helsinki metropolitan area. In 2010–2018, the migration loss in Helsinki was approximately -9,700 people, in Vantaa -1,800 people and in Espoo -950 people. In addition, Vaasa, Jyväskylä, Tampere, Kajaani and Turku experienced a significant migration loss of more than 500 people. Map 6 describes the net migration of the adult population aged 35–64 between municipalities in 2010–2018.
The special characteristics of migration in the 2010s
Migration presents a challenge to balancing regional and demographic structures for two interconnected reasons: (1) Migration is concentrated and polarizing by nature, because it increases regional disparities and regional segregation. Migration strengthens areas that are already strong and vibrant, and weakens those that are weaker and already in the process of contracting. (2) Migration is selective by nature. Nearly four out of five migrants are young people or young adults. Eight out of ten migrants are under the age of 35. One in two migrants is between 15 and 29 years old. Migrants are also over-represented among the educated.
A special feature of migration in the 2010s seems to be that even in growing regions or in transportation and growth corridors, there is significant dispersion in population growth within the same functional area. Growth occurs increasingly from the edges toward the core of urban areas or inner-city metropolitan areas, as well as along or in the vicinity of the rail network. The change in this respect is substantial compared to the development in the first decade of the 2000s, when the so-called Nurmijärvi phenomenon involved the decentralization of urban and community structures, even in growing urban areas, in favor of detached housing and commutes extending beyond the municipal districts. In the 2010s, we can speak of the so-called Järvenpää phenomenon, characterized by increasing density of urban structures, packing into densely populated urban areas thanks to diversified housing production, and into the proximity of good (rail) connections and service concentrations.
The special characteristics of migration in the 2010s can be summarized into the following five core factors:
- Regional segregation and differentiation have accelerated. The number of areas experiencing migration gains has decreased, and the areas with migration gains have become concentrated in large and medium-sized urban areas as well as in points elsewhere in the country. The decline in natural population growth highlights regional differences.
- Migration is even more concentrated, polarizing and selective than previously. The selective characteristics of migration, in particular the age, labor market position and education level of migrants, exacerbate disparities between and within regions. Where certain regions benefit from migrants both in terms of their numbers and population characteristics, others suffer quantitative migration losses and contend with aspects of population structure that deplete vitality. Migration and the structural aspects of the migrant population exacerbate disparities between and within regions. Of particular importance for all regions is where the working-age population and the employed decide to move. The migration of the working-age population and the employed is critical to the success of a particular area.
- The internal dynamics of urban areas have changed. Within growing urban districts, compared to previous developments, the migration gains of central cities have increased in relation to satellite municipalities, and there is greater dispersion between different satellite municipalities than previously. Even in growth areas, internal disparities have increased within the same functional area, and growth is shifting more from the edges toward the core or the inner-city area and the proximity of the rail network.
- The importance of immigration is ever greater in regional population dynamics. Immigration’s role has increased in the demographic development of areas as natural population growth has weakened, especially in term of the rapidly declining birth rate. In a growing number of municipalities, immigration is the only dynamic component of demographic development. The subsequent internal migration of immigrants tends to be more concentrated than the migration of the native population.
- The pull and retention power of the Helsinki metropolitan area and other large urban areas have grown compared to the country as a whole, and compared to their own impact areas. Metropolization has intensified during the 2010s, as the migration gains of large cities and urban areas increased through the decade, more than previously. The rapid growth has come with both positive and negative side effects. The metropolitan area and metropolitan policy will shape all urban and social policy in Finland in the 2020s. Metropolization is also visible on a smaller scale in all large urban areas.
For migration in the 2020s, the first key issue is connected to the effects of digitalization, the development of information technology and changes in work. Until now, digitalization has involved the so-called “paradox of place”. This a reference to how, contrary to expectations,
digitalization has not reduced dependence on time, place and distance. Instead, it has further underscored the importance of centralization and faceto-face encounters and contacts. The paradox of digitalization for regional development is probably that it simultaneously allows centralization as well as decentralization. The increased use of artificial intelligence is both destroying and creating new jobs, but automation’s true impact on migration is difficult to determine. Indeed, the interrelationship between digital society and urbanization has so far largely been speculation regarding various developments.
The other relevant question with regard to the development of migration in the 2020s is whether people will follow jobs or jobs people. Traditionally, it is people who have followed jobs. In the future, it is possible that more industries will follow people and seek out existing concentrations or the proximity of other companies who operate in the same industry. Competence has a strong tendency to be attracted to existing concentrations of competence. If and when competition for skilled labor becomes more intense, jobs will follow the choices people make regarding how and where they live, not the other way around.
Whatever the case, it is clear that the transformation and changes that happening in work will continue to affect migration and regional mobility in general. In terms of the future of working life, multi-locality and diversity will become ever more important. Multi-local living has reduced people’s attachment to a single place. The work can basically be done anywhere, in any way and at any time. However, to quote Osmo Soininvaara, we could also note that, “work that can be done anywhere in Finland can usually also be done anywhere in the world”. In other words, from the perspective of the work, multi-locality means that work can be done either in the workplace, remotely, at the client’s location, in a communal space, at a café or while traveling on any mode of transportation. Multi-locality can mean the decentralization of the places where work is done from cities to rural areas, and from cities to other cities or abroad. Multi-locality is often seen as something connected to leisure-related living, or as a lifeline for small municipalities, rural or sparsely populated areas, but increasingly, it can also mean the having a second home in a larger city in the same country, or abroad. A growing number of the educated commuters of active working age and with a regular income have a second home that is located in a large, centralized cluster of residential housing or workplaces. Digitalization and the transformation of work are blurring the distinctions between where we work and where we live.
The urbanization of families with children and other urbanization trends (Emma Terämä)
Summary
- Most Finns now live in cities, and the urbanization continues.
- This chapter examines certain trends that coincide with and possibly interact with urbanization: the increasing commonness of living alone, changes in housing preferences, declining birth rates in different regions, transformation of work and the resulting multi-locality, and taking sustainable development into account in regional planning.
- The increased popularity among young people of living alone as well as urbanization are mutually reinforcing trends. A similar connection to urbanization has not yet been observed to aged single dwellers.
- Location and access to transportation are currently the convenience factors that families value most when choosing a place to live. Although some families still prefer private houses, the popularity of apartment living has been on the rise since the late 1990s. Housing preferences therefore appear to have shifted toward urbanization.
- Birth rates have fallen in both urban and rural areas. In cities, the birth rate is lower and housing stock more expensive than in rural areas. The urbanization trend may be connected to the decline in birth rates.
- Fragmented working life and digitalization in jobs are forcing and enabling people to live in more than one locality. In the future, this may affect people’s housing preferences and thus urban development in unexpected ways.
- An increasingly condensed built environment and a well-functioning community structure contribute to the realization of a resource-wise society, thus enabling sustainable urban living.
Since late 2018, we in Finland have seen a lot in the news regarding various demographic trends. The dramatic shifts in the declining birth rate, on the one hand, and the urbanization trend on the other hand, have been subjects of avid discussion, at least until the emergence of the COVID-19 pandemic early in 2020. In addition to bare statistics, we need better understanding to make improved predictions and timely decisions. Population research, or demography, has a long tradition of making predictions while being sensitive to trends – as well as affected by them.
Despite the slow evolution of natural demographic renewal, it has always been difficult to predict trends, and this continues to be true. Examples include the long-term decline in mortality and now also the rapid decline in the birth rate. When migration is incorporated into a demographic analysis, forecasting becomes even more challenging. An example of migration is urbanization – in other words, people moving to cities. More nationally focused research and plenty of interest in the subject are present than perhaps ever before, so what we need now is discussion to deepen our understanding. We also need a smidgeon of patience as we consider the future population of Finland also from an urban perspective.
In this article, I consider what urbanization looks like in light of the analyses of the Finnish Environment Institute and its partners. As the task of writing this article began before the pandemic and extended through the apex of the crisis, it must be noted that drawing any final conclusions has been a challenge. A manifestation of the new operating environment is that past trends are unlikely to be reflections of the future. The situation of cities and urban areas has evolved immensely since 2015 in terms of population, the built environment and preferences, and will presumably continue to do so as a result of the pandemic. The transformation of work, the multi-locality of jobs and sustainable development are all phenomena linked to demographic trends that are now also affected in one way or another by the COVID-19 crisis that began in the spring of 2020. The question of future trends is thus very topical and affects multiple levels of decision-making, not least cities and urban areas.
Where Finns live
In his chapter in this report, Timo Aro examines migration trends and their effects on regional development from the 1990s to the present. He notes that the combined effect of migration and natural population development in recent years has been the concentration of cities and segregation between regions, but also their internal segregation. This chapter examines the static situation of 2018 in terms of the distribution of people in different regions (Figure 1 and Map 1) and predicts future demographic trends in light of the existing data.
In order to map out the operating environment, we can make use of the excellent register data according to place of residence to describe the Finnish population. And to examine the population and the built environment without regard to administrative boundaries, we can divide Finland into seven urban and rural categories on the basis of spatial data (Helminen et al., 2014). Most Finnish people live in densely built, so-called inner urban areas (Figure 1). Inner urban area refers to densely and cohesively built inner-city areas with a construction efficiency at least equivalent to a densely constructed area of detached houses. The outer urban area, on the other hand, consists of separate suburbs, commercial, industrial and office areas, and green areas, but also lower-efficiency residential areas that are part of the cohesive urban area (Helminen et al., 2014).
Figure 1. Distribution of Finns in urban-rural categories, number and share of the total population (%).
Source: Habitat Information Service Liiteri (Finnish Environment Institute, SYKE) and Statistics Finland, 2018.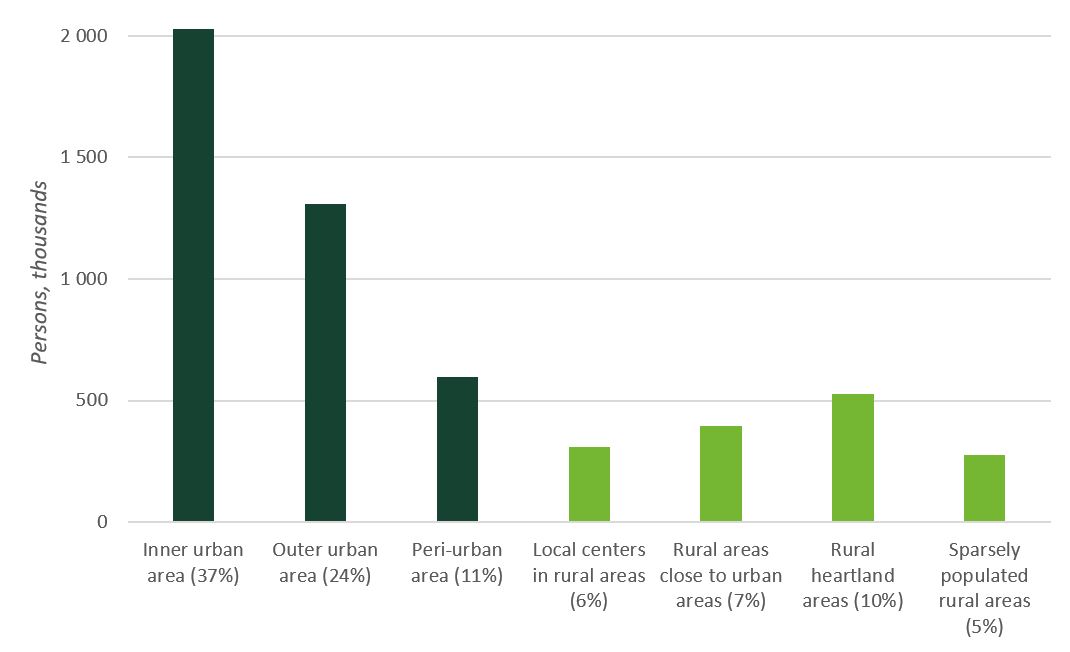
Map 1. Population density by region (number in parentheses, total 70). The northern regions not visible on the map are among the least populated.
Source: Liiteri (Finnish Environment Institute, SYKE) and Statistics Finland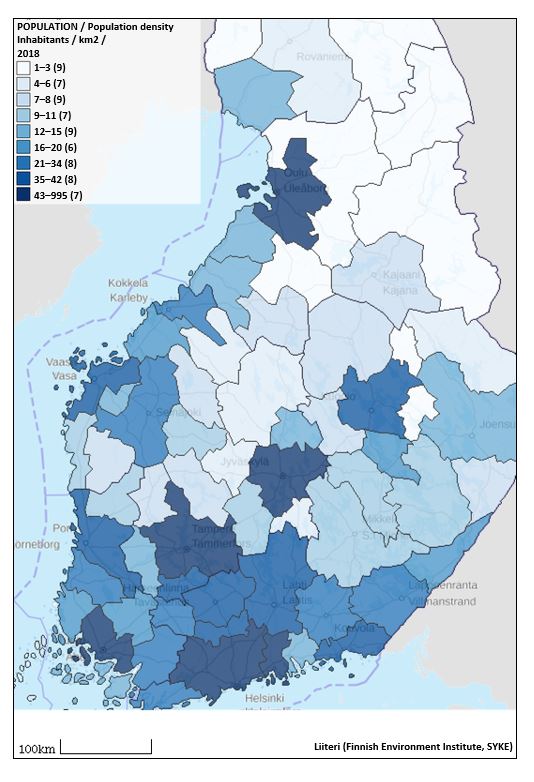
Figure 2. Demographic change in the sub-regional zones in light of the new and the old forecast. The different colors reflect different regions.
Source: Finnish Environment Institute (SYKE) YKR community structure database and Statistics Finland.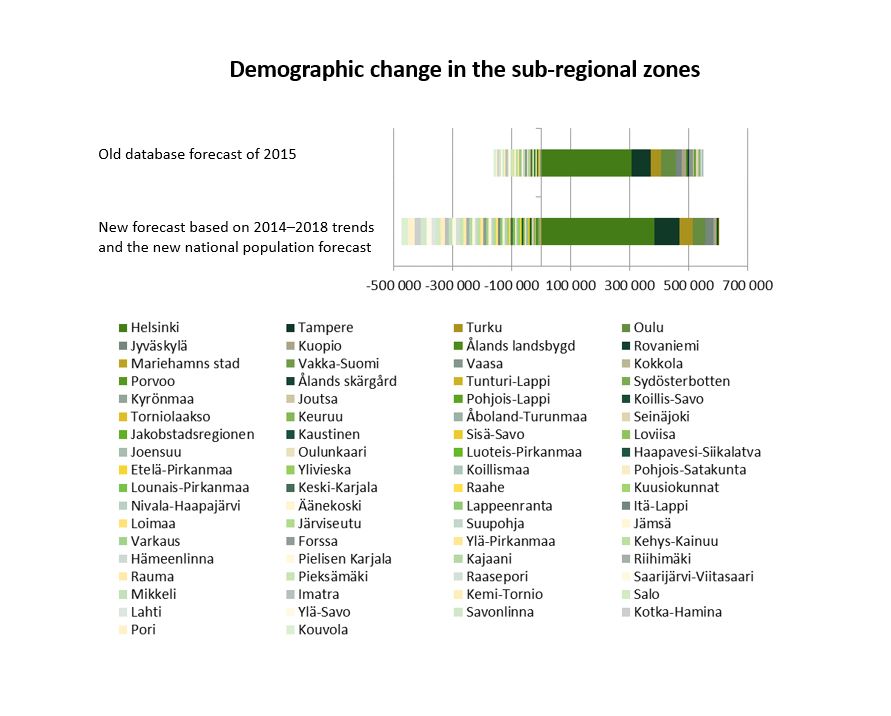
The peri-urban area refers to the intermediate zone between the urban and rural areas, which is directly connected to the physical urban area. The housing stock in peri-urban areas consists primarily of detached houses. A fourth, more densely built type of area, is the local center in a rural area. The other three area types are rural areas close to urban areas, rural heartland areas and sparsely populated rural areas. The map image (Map 1), on the other hand, shows the distribution of population density in Finland by sub-regional unit. In the map view, the large, high-density urban areas are highlighted. Based on the figures, we can say that even when using different ways of calculating (different classifications, different limit values), about eight in ten Finns live in urban areas.
To obtain predictive information about regional development, it is useful to compare trend calculations made in multiple time periods. Figure 2 is a reflection of this. The figure shows how the population forecasts of sub-regions (70) have changed from 2015 to 2018. In the earlier forecast based on the 2015 situation, fewer regions were predicted to lose population and more to gain population, whereas the change over the subsequent years as well as the newer Statistics Finland population forecast show significantly more sub-regions losing population and fewer of them gaining.
Single dwellers and urbanization
An examination of the entire population and of different areas does not yet tell us about housing units, i.e., households. The size of households and families varies by type of area. For example, single-person households are significantly more common in inner urban areas, while multi-person households are equally likely to be located in inner as well as outer urban areas (Figure 3). In the comparison, living in a rural area is nearly as common among single dwellers as among the rest of the population, but in the peri-urban areas of detached houses, one-person households are less common compared to other types of households.
Figure 3. Distribution of single dwellers and non-single dwellers in urban and rural areas in 2016
Source: Finnish Environment Institute (SYKE) / YKR community structure database and the register of buildings and dwellings (RHR), published in the report by Terämä et al., 2018.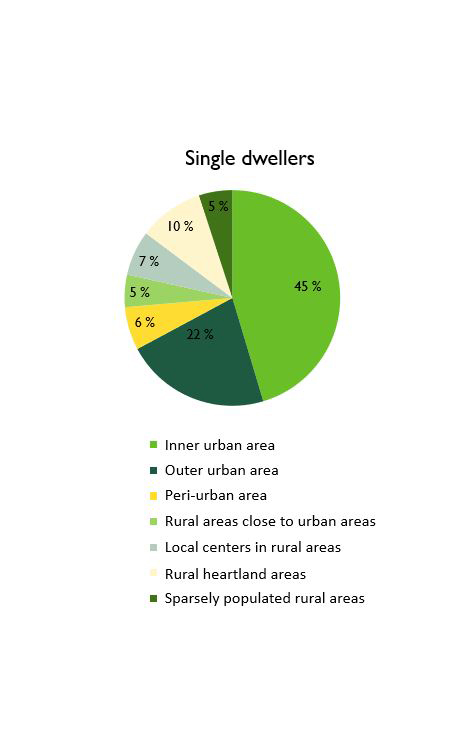
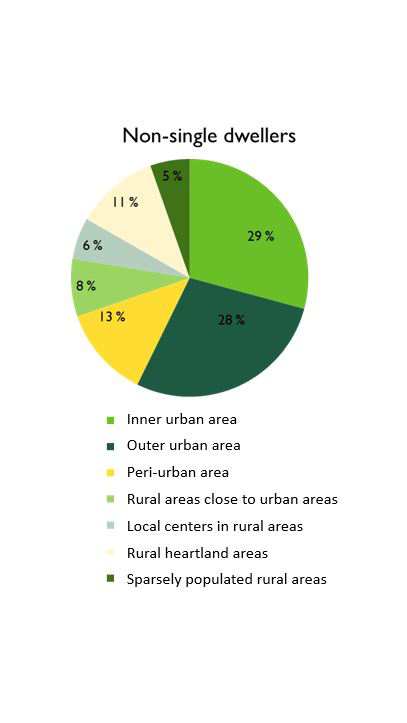
Living alone is increasingly common. In 2017, 43% of Finnish households were single-person households, compared to 28% in 1985. During the same period, the number of people living alone more than doubled (Terämä et al., 2018). To some extent, this reflects a change in the population’s age structure (those who lose a spouse at an advanced age typically live in single-person households), but also changes in family formation, such as forming relationships later and moving in together later. A noteworthy example of this is the steady increase in the average age of first-time mothers (now 29.4 years in Finland), as can be seen in the population statistics from Statistics Finland (SVT, 2016–2018, see also the chapter by Rotkirch in this report). This trend, including living alone, does not apply only to Finland, but is also evident elsewhere in Europe (Eurostat 2017; Terämä et al., 2018).
The upward trend in one-person households concerns several age groups. Living alone has increased not only in old age, but also among the young and middle-aged. It is unequally distributed by gender: among the oldest age groups (over 65), the majority of single dwellers are women, and in the 25–54 age group, the majority are men. There is less difference between the sexes in the age groups of under 24 and 55–64 (Terämä et al., 2018 and Figure 4). Housing preferences also show that the share of women who live alone is higher in urban-type municipalities, especially in Southern Finland, whereas there are more men living alone Northern Finland, Kainuu and the rural-type municipalities of Eastern Finland (ibid.). However, young single dwellers, both male and female, typically live in urban areas. Indeed, urban growth areas are already facing shortages of smaller apartments, even though numerous studios have been built (Kannisto, Kokkonen, Korhonen & Vuorio, 2019).
The relationship between living alone and urbanization seems straightforward. Since both trend in the same direction (are increasing), is it possible to say that they feed on one another? This can be considered by using the reverse hypothesis. If urbanization were not on the rise, could living alone still be increasing? In terms of young people, the answer seems clear: the proportion of people under the age of 30 who are living alone has increased clearly, particularly in urban areas, while their number has decreased in rural areas (Nikander & Pietiläinen, 2015). On the other hand, we know that with the (uneven) growth in life expectancy, living alone in old age will become increasingly common. Where these people end up living in terms of area will be an important factor in determining whether living alone will be connected to urbanization in the future.
At present, however, there does seem to be a link between the increase in living alone and growing urbanization. For example, in Sweden the growth trend in living alone is no longer as strong as it is in Finland (Terämä et al., 2018). We can assume that Finland, too, will experience a peak in both living alone and urbanization, following which the pace of change will slow down.
Figure 4. Share of male and female single dwellers by age group in 2016.
Source: Statistics Finland.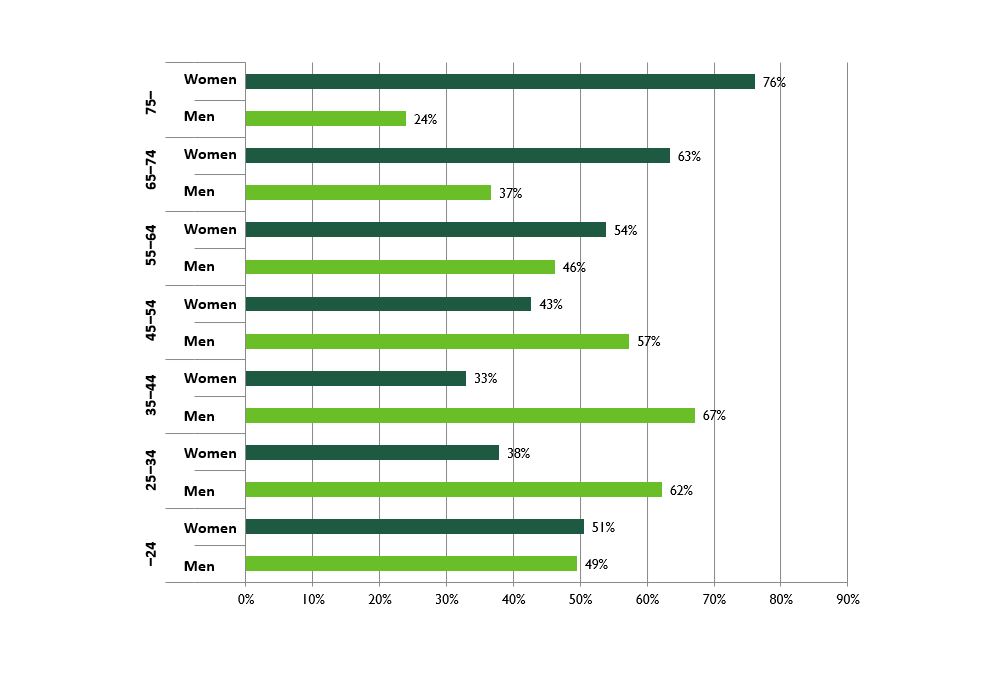
Housing preferences in Finland
The fourth nationwide follow-up barometer survey on residence (N = 3005) conducted in 2016 provided interesting food for thought. Housing location and transportation connections emerged as the most frequently mentioned convenience factors, instead of the number one factor of previous surveys, tranquility (Strandell, 2017). On the other hand, urbanization, in this case the growing popularity of downtown-type apartment living and the waning desire for detached housing, has been a gradually evolving trend since 1998.
According to a housing preference survey concerning urban areas (N = 2900) by Pellervo Economic Research PTT (Haltia et al., 2019), urban dwellers can be divided into four resident profiles: green urban dwellers in detached houses (24% of respondents), urban city dwellers(15%), price-conscious owner-occupiers (50%) and modern green urban dwellers (50%). Regardless of profile, respondents were willing to pay for greenery in the vicinity of their dwelling, but those under age 40 were less willing to pay for parking spaces than others (Haltia et al., 2019).
Of interest from the perspective of demographic change and urbanization is the change in the housing criteria of families with children. As Aro states in his chapter in this report, the Nurmijärvi phenomenon of the 2000s can be said to have turned into the Järvenpää phenomenon of the 2010s. This is supported, among other things, by the growing importance of public transport for families as children begin to move independently. Similarly, the fact that, unlike in previous rounds of the survey, in terms of services, also families with children now want cafés and restaurants the most (Strandell, 2017). The primary criteria now for living in a particular place are not only tranquility, safety and proximity to nature, but also children having friends within walking distance and access to a good-quality local school (Strandell, 2017). However, for many families with children, the idea of self-determination or independence when it comes to housing remains important. In most cases, this still means having one’s own house, yard and parking space (ibid.). Of course, these are not available in the densest urban areas.
As in the study by Pellervo Economic Research PTT (Haltia, 2019), the individualization of lifestyles is also reflected in the division of families with children into urban and private-house people and, consequently, in differentiation in housing criteria despite people being in the same life stage (Strandell, 2017). The urbanization of families with children has long been reflected in the increase in the number of young children in cities, but now the number of young people has also begun to grow. Thus, families do not move out of cities as children grow up, at least to the same extent as before (cf. Nurmijärvi phenomenon).
The changing birth rate in urban and rural areas
The precipitous decline in Finland’s birth rate is now a familiar matter to the general public and researchers and decision-makers alike. As presented in the chapter on births in this report, births as measured by the total fertility rate, i.e., the average number of children born to women, have been declining throughout the 2010s and have done so sharply since 2015 (SVT, 2018). In 2018, the total fertility rate was 1.41 (and only 1.35 in the 2019 preliminary statistics), while the replacement rate would require an average of 2.1 births per woman. In 2018, the birth rate fell in all regions for the first time in the 2010s. This does not mean, however, that the decline is steady or that the low rate of births is evenly distributed across different types of areas.
In order to assess the relationship between the declining trend of the birth rate and urbanization, we will examine the change in the birth rate a little more closely by region. To identify the internal differences between various regions, we can once again take advantage of the urban-rural categories. Almost without exception, the birth rate is lower in urban areas than in rural areas (see Table 1). There are differences, however, within cities: in suburbs and smaller towns or villages (outer urban areas / peri-urban areas), where the average home is larger than in the city center, cheaper per square meter and where proximity to nature attracts families (conversely resulting in a dependency on cars), the birth rate is typically higher than in the city center. On the other hand, downtown areas typically have more small apartments and there may be a lack of apartments that are suitable for families.
Table 2 depicts the change in total fertility from 2015 to 2018. Strikingly, the decline has occurred within regions across all areas, regardless of type of area. With the exception of Åland (and even there, in only one area type), the birth rate has been declining in all area types and in all regions! In other words, for example, urban-type areas with already lower birth rates have suffered even more from a further decline in the birth rate. In most of the areas described below, the birth rate was below the replacement level of 2.1 already on the basis of the 2015 figures, regardless of whether the area is an urban one or not.
Table 1. Total fertility rate by urban-rural classification in different regions, calculated from the 2019 municipal fertility figures for individual municipalities. Not all area types are represented in all regions; for those, the national average for all areas of that regional type is used (in italics).
Source: Statistics Finland and Finnish Environment Institute (SYKE) – YKR community structure database.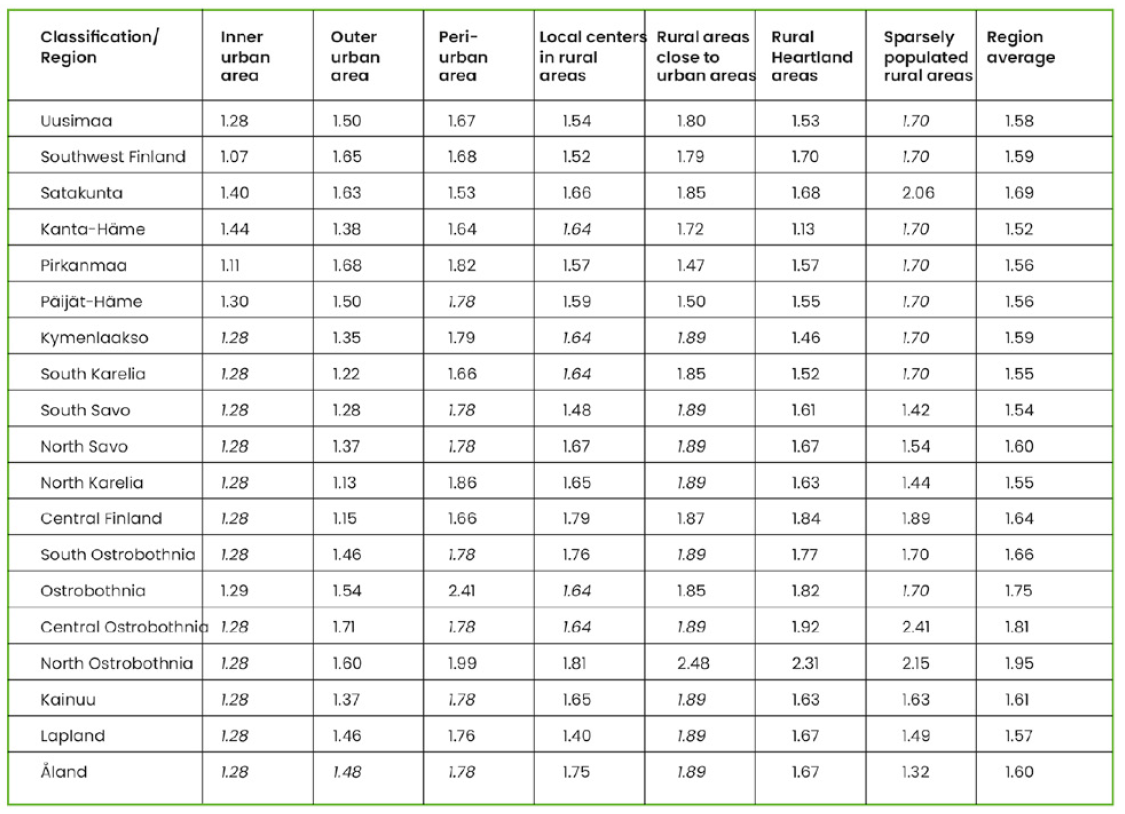
Table 2. Change in total fertility rate by urban-rural classification (%) in different regions in 2015–2019. The biggest changes are highlighted in dark green, the smallest in light green.
Source: Statistics Finland and Finnish Environment Institute (SYKE) – YKR community structure database.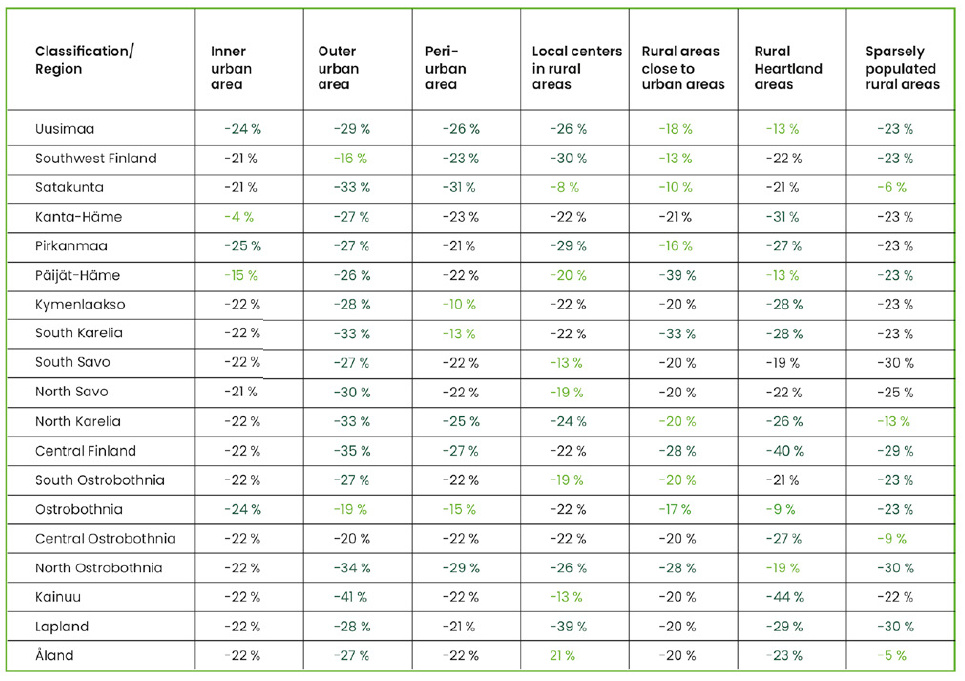
The reasons for the declining birth rate in the 2010s are discussed in the chapter by Rotkirch in this report. In light of Tables 1 and 2, the regional distribution in the decline of the birth rate, and the reasons for the differences observed therein are also of interest. Hellstrand noted as the main reason for the decline in overall fertility in 2010–2017 the declining the number of firstborns in both cities and rural areas. In addition, in non-urban areas, having more than three children fell sharply between 2010 and 2017. On the other hand, at least in light of this data, low birth rates do not make certain areas more “miserable” at the expense of others; instead, this population trend is remarkable in that it applies equally to all areas.
Multi-locality and the transformation of work
The issue of where, how and in what-size constellations people live is also closely connected to another – the transformation of work. The relationship between labor market areas, sustainable, interesting and attractive living environments, and functional daily mobility and transport largely regulates the ability of individuals and households to operate flexibly in both the housing and the labor market. The question of what a Finnish city will look like in 2030, for example, is essentially related to a future vision in which the city serves as a platform for choices regarding work, lifestyle and housing. If our aim is the sustainable development of this operating environment, labor mobility and the flexibility of working life work in tandem with a resource-wise lifestyle and resource-efficient housing.
The fragmentation of work, which is characterized by temporary and fixed-term contracts, multiple simultaneous employers, low pay or perhaps gig pay, may not make it possible to live and/or work in a single place. More and more people are choosing a multi-local lifestyle, as Anu Vehviläinen, Minister of Local Government and Public Reforms, recently stated in her column (2018). This poses new challenges for envisioning the population and cities of the future. The problem of multi-locality cannot be solved with a single measure. Not even a study of dual residency (Ministry of Finance, 2018) was able to offer a solution, although it proposes continuing to promote e-residency through experiments with inclusion, communication and decision-making.
In many industries, the freedom from time and place allowed by technology makes it increasingly possible for work to be tailored flexibly and according to individual workers, even when we are forced into this, as we now are in the midst of the COVID-19 pandemic. In workplaces where remote work is possible, the operating environment can be virtual instead of physical, and the workplace can be your own kitchen, a café, public transit, or, when necessary, any space whatsoever. Multi-space, multi-local work makes working more flexible but also presents new challenges for both employer and employee. Highlighted among these are shared operating rules, ensuring a comfortable and ergonomic work environment, safety, and even contract practices (Oksanen, 2017).
No matter where children are born, people in general seem to choose cities.
An absolute prerequisite for place-independent, multi-local work is digitality. The importance of digitality for working life is underscored in both the private and public sectors (Dufva et al., 2017). This can be seen, for example, in the Finnish Government’s draft measure (2018), which emphasized the importance of digital platforms for work and how work is organized. It pointed to significant advantages from utilizing digital platforms for work efficiency. Increasing the use of these platforms also has the potential to compensate for the changing labor needs of states and municipalities, which are difficult to meet as people become ever more concentrated.
Demographic change and migration are creating new challenges for the future of working life and well-being. The low birth rate and the increase in the dependency ratio affect the financial frameworks of both the state and municipalities. Ensuring well-being in the new operating environment is therefore important, when a declining labor supply and the long-term reduction in the working-age population are significantly impacting the country’s dependency ratio and sustainability gap. An increase in net migration and raising the retirement age have been proposed as corrective measures (see, for example, the chapter by Tikanmäki and Seuri in this report). Other areas to highlight include taking care of people’s ability to work, function and maintain their competence, in order to encourage them keep working longer and enjoy themselves while they’re at it (Finnish Government, 2018).
Sustainable cities
No matter where children are born, people in general seem to choose cities. What does this concentration of many people in a small number of urban areas mean for urban structure, and what would constitute sustainable development? Population centers have grown denser due to infill construction, and population density is on the rise, especially in the largest urban areas. The development of urban areas has involved an increasing amount of planning than previously: more and more of new dwellings have been situated on zoned land in recent years. Despite this, the area of sparsely populated land outside zoning has increased. The decentralization trend is generally considered the opposite of sustainable regional development (Terämä et al., 2017).
In Finland, there is still plenty of room for denser development. An increasingly dense built environment and a well-functioning community structure advance the way toward a resource-wise society. There is available space in cities in Finland, where the highest average density can be found in Helsinki (3,002 inhabitants/km2)17 and in Kauniainen, which comes second (1,634 inhabitants/km2). As urbanization continues, however, it is important to ensure sustainable development, which good planning makes possible as long as the pace of urbanization remains at the moderate level where it is today. 18
The recently completed BEMINE project of the Strategic Research Council (Mäntysalo, Kanninen, Purkarthofer & Koste, 2019) examined urbanization, among other things, from a planning perspective. Most of the new construction stemming from population-related pressures has been located in and near previously built-up areas, leading to increasingly dense urban structures (Rehunen, Ristimäki, Strandell, Tiitu & Helminen, 2019). In the largest urban areas, the expansion of the built environment into nature has been relatively minor in recent years, relative to the increase in the floor area of buildings (ibid.). Population centers have been built more efficiently than previously as a result of the infill construction.
Finnish urban areas and rural population centers, however, are in very different positions in terms of being able to influence the development of urban structure. It is possible to make choices especially in the largest growing regions, where housing construction is increasingly concentrated. But even in areas of more moderate growth or contraction, consistent planning can influence the way that accessibility of community structures, and thus jobs and services, and the needs related to mobility take shape (Rehunen et al., 2018).
As demography changes, people relocate and their preferences with regard to both housing and how they work are disrupted, it is reasonable to ask for whom we are actually designing our cities? Those who live and do business in cities want solutions that work not only from the perspective of their livelihoods but also contribute to their quality of life, and it is these things that cities have begun to cultivate in terms of the services they offer and the structures they develop. From a sustainability standpoint, the solutions – for example, related to mobility – often benefit from the high density. Solutions designed with a more comprehensive approach can bring so-called co-benefits and thereby improve the conditions for well-being and sustainability.
A city’s vitality, its power to retain people and growth prospects that are founded on sustainability are, to a great extent, connected to the well-being of its residents. This is the subject of growing interest at various levels of decision-making and in urban research. It is therefore reasonable to ask not only what kind of city is one that is consistent with the principles of sustainability, but also what kind of city residents themselves want. The connection of individual preferences to the trends of our time, with or without the COVID-19 pandemic, will inevitably also shape urban development. Predictions and forecasts have their place in the decision-making machinery, and the pandemic of the spring of 2020 also highlighted the importance of being prepared for more demanding scenarios. We can and must prepare for changes in Finland’s population and for urbanization at multiple levels.
Acknowledgments: Julia Hellstrand, University of Helsinki; Antti Rehunen, Finnish Environment Institute (SYKE); Kaisa Schmidt-Thomé, Demos Helsinki; Anna Strandell, Finnish Environment Institute (SYKE), and the Strategic Research Council’s recently completed BEMINE project, which provided funding for the demographic modelling using urban-rural classification.
17 These figures can be compared, for example, to the 11th arrondissement in Paris, one of Europe’s densest with over 40,000 inhabitants/km2, to London’s City of Westminster at over 20,000 inhabitants/km2, or closer to our own figures, Berlin at 3,837 inhabitants/km2 (it is not the most densely populated city in Germany), or Stockholm at fewer than 5,000 inhabitants/km2 (also not the densest city in Sweden). Source: Eurostat, 2015.
18 Finland’s average annual urbanization rate in 2015–2020 has been approximately 0.42%, compared to that of Sweden 1.05%, United Kingdom 0.89%, India 2.37% and China 2.42%. Source: UN, 2018.
References
Anttila, J., Eranti, V., Jousilahti, J., Koponen, J., Koskinen, M., … & Malkamäki, M. (2018). Pitkän aikavälin politiikalla läpi murroksen – tahtotiloja työn tulevaisuudesta (s. 93–94). Tulevaisuusselonteon taustaselvitys. Prime Minister’s Office publication series on its reporting and research activities 34/2018. http://urn.fi/URN:ISBN:978-952-287-538-9
Dufva, M., Halonen, M., Kari, M., Koivisto, T., Koivisto, R. & Myllyoja, J. (2017). Kohti jaettua ymmärrystä työn tulevaisuudesta. Publication on Prime Minister’s Office reporting and research activities 33/2017.
Eurostat (2017). Fertility statistics. Retrieved 9 Aug 2019 from https://ec.europa.eu/eurostat/statistics-explained/index. php?title=Fertility_statistics.
Eurostat. (2015). Population density in local administrative units (LAU2), 2015 (inhabitants km²). Retrieved 8 Jul 2019 from https://ec.europa.eu/eurostat/ statistics-explained/index.php?title=Urban_Europe_%E2%80%94_statistics_on_cities,_towns_and_suburbs_%E2%80%94_life_in_cities
Finnish Government (VN). (2018). Valtioneuvoston tulevaisuusselonteon 2. Osa: Ratkaisuja työn murroksessa. Finnish Government publications 30/2018.
Haltia, E., Keskinen, P., Karikallio, H., Alho, E., Vuori, L. & Alimov, N. (2019). Kaupunkiseutujen asukkaiden asumispreferenssit – Miten ja missä kaupunkilaiset haluavat asua? Pellervo Economic Research (PTT) reports 260.
Hellstrand, J. (2018). All-time low period fertility in Finland: tempo or quantum effect? (Master’s thesis, University of Helsinki).
Helminen, V., Nurmio, K., Rehunen, A. Ristimäki, M., Oinonen, K. Tiitu, M., Kotavaara, O., Antikainen, H. & Rusanen, J. (2014). Kaupunki-maaseutu-alueluokitus – Paikkatietoihin perustuvan alueluokituksen muodostamisperiaatteet. Finnish Environment Institute reports 25/2014.
Kannisto, O., Kokkonen, P., Korhonen, M. & Vuorio, E. (2019). Myös yksiöiden rakennusbuumi hiipuu – mitä tilastot kertovat ilmiöstä? Tieto ja Trendit. Statistics Finland.
Mäntysalo, R., Kanninen, V., Purkarthofer, E. & Koste, O-W. (eds.) (2019). Kaupunkiseudut: Ristiinvalotuksia ja rajanylityksiä. BEMINE-hankkeen loppuraportti. Aalto University publication series CROSSOVER 2/2019. https://aaltodoc.aalto.fi/handle/123456789/38724.
Nikander, T. & Pietiläinen, M. (2015). Kaupunkialueet vetävät nuoria asumaan yksin. Tieto ja Trendit. Statistics Finland. Official Statistics of Finland (OSF) (2018). Births. Statistics Finland. Retrieved 2 Jul 2019 from http://www.stat.fi/til/synt/2018/synt_2018_2019-04-26_tie_001_fi.html.
Official Statistics of Finland (OSF) (2016). Births (02). Statistics Finland. Retrieved 9 Aug 2019 from http://www.stat.fi/til/synt/2016/02/synt_2016_02_2017-12-04_tie_001_fi.html
Oksanen, K. (2017). Valtioneuvoston tulevaisuusselonteon 1. osa: Jaettu ymmärrys työn murroksesta. Prime Minister’s Office publication series 13a/2017.
Rehunen, A., Nissinen, A. & Terämä, E. (2019). Kaupungistumisen kehityskulut vaikuttavat ekologiseen kestävyyteen. In R. Mäntysalo, V. Kanninen, E. Purkarthofer & O-W. Koste (eds.), Ristiinvalotuksia ja rajanylityksiä – BEMINE-hankkeen loppuraportti (pp. 46–50). https://aaltodoc. aalto.fi/handle/123456789/38724
Rehunen, A., Ristimäki, M., Strandell, A. Tiitu, M. & Helminen, V. (2018). Katsaus yhdyskuntarakenteen kehitykseen Suomessa 1990–2016. Suomen ympäristökeskuksen raportteja 13/2018. Finnish Environment Institute. http://hdl.handle. net/10138/236327
Strandell, A. (2017). Asukasbarometri 2016 – Kysely kaupunkimaisista asuinympäristöistä. Suomen ympäristökeskuksen raportteja 19/2017. Finnish Environment Institute. https:// helda.helsinki.fi/handle/10138/193009
Terämä, E., Tiitu, M., Paavola, J.M., Vainio, A., Määttänen, N., Miettinen, A., Kontula, O. & Hiilamo, H. (2018). Yksin osana elinkaarta. Prime Minister’s Office publication series on its reporting and research activities 66/2018.
Terämä, E., Clarke, E., Rounsevell, M. D. A., Fronzek, S. & Carter, T. R. (2017). Modelling population structure in the context of urban land use change in Europe, Regional Environmental Change 19(3), 667–677. https://doi.org/10.1007/s10113-017-1194-5
United Nations, Department of Economic and Social Affairs, Population Division. (2018). World Urbanization Prospects: The 2018 Revision. Retrieved from https://population.un.org/wup/DataQuery/
Vehviläinen, A. (2018). Millaista monipaikkaisuutta Suomeen? [kolumni] Retrieved from https://vm.fi/artikkeli/-/asset_publisher/millaista-monipaikkaisuutta-suomeen-
Ecological sustainability and Finland’s population (Pasi Heikkurinen)
Summary
- The sixth wave of mass extinction underway right now is exceptional compared to previous mass extinctions: it is largely caused by members of one species – humans.
- The extinction threatens not only other species but also humans, because without biodiversity, our own conditions for survival will deteriorate. A socially and economically sustainable society is possible only if we manage to achieve ecological sustainability.
- The most significant environmental problems are caused by the size of the global human population and its affluence. Together, they lead to exceeding the Earth’s ecological carrying capacity.
- The most effective way to improve ecological sustainability with the current population base is to radically reduce consumption in affluent societies such as Finland. The goal of reducing consumption is at odds with our growth-based economic system. It may not be in conflict with social sustainability, but in addition to the need to reduce consumption, existing wealth also needs to be distributed more equally.
- Achieving a balance between ecological, social and economic sustainability requires the cooperation of science, individuals, businesses, politicians and NGOs, both locally and globally. It is essential to strive for an understanding of the root causes of the sustainability problem, of which both wealth and population growth are an organic part.
In addition to our feelings of altruism, we may also be concerned about other species because the collapsing biosphere is a threat to ourselves.
Both geographically and in terms of its culture, Finland is part of the biosphere, the sum of all ecosystems. Biosphere is also known as the web of life (in Finnish, elonkehä means literally “sphere of life”), referring specifically to the parts of the Earth that are capable of supporting life. “Life” can be broadly defined as a state in which something was born and is alive and not yet dead. However, trying to define life is difficult due to its boundaries of time and place, as well as the multifaceted nature and interdependencies of the phenomenon. While we cannot give an exact definition of life, it is experientially true for many – after all, we feel alive.
Life, whether of individuals, groups of people or cultures, is and has always been in perpetual danger. The struggle to survive is happening all the time, all over the world. Communities are born, live and die. Over the last one hundred years, however, the question of life has reached global proportions. Studies by leading biologists and paleontologists indicate that we are living in the midst of the sixth mass extinction (Wake & Vredenburg, 2008; Barnosky et al., 2011; Ceballos et al., 2015). At least two things make the present loss of species exceptional. The first is the scientific fact that the species losses are largely caused by one species – homo sapiens. The second and peculiar issue is that, although human communities have had access to extensive information concerning the ongoing collapse, and its causes and consequences, the necessary measures to slow down or stop the species extinctions have not
been taken.
Life on Earth is based on the interdependence of different phenomena (for example, of species and ecosystems) (Capra, 1996; Heikkurinen, Rinkinen, Järvensivu, Wilén & Ruuska, 2016). Without a diverse spectrum of species, the conditions for continued human life also decline. This means that as it progresses, the planetary mass extinction may also lead to human extinction. In addition to our feelings of altruism, we may also be concerned about other species because the collapsing biosphere is a threat to ourselves (see Barnosky et al., 2012; Ehrlich & Ehrlich, 2013).
What, then, are the factors that would allow life on Earth to continue? This question is the subject of study in sustainability research, which examines the connections between the environment, society and the economy with the aim of increasing our understanding of the phenomenon and providing tools for sustainable change. The field of research also includes a view of the factors that comprise human impact on the environment (Bonnedahl & Heikkurinen, 2019). According to the so-called IPAT equation, the three primary factors
that have an impact on the environment (I = Impact) are population (P = Population), level of consumption per person (A = Affluence) and impact per unit of consumption, i.e., technology (T = Technology) (Holdren & Ehrlich, 1974; Chertow, 2000; Holdren, 2018). In the equation, human impact on the environment (i.e., the so-called ecological footprint) thus consists of the total number of people, their material standard of living (or consumption), and the environmental impact of the technology they build and use. The first two factors, population and affluence, are the so-called root problems of the biosphere. The third factor, on the other hand, is often seen as a way to mitigate the effects of the first two, through so-called technological eco-efficiency measures.
There are also critical views regarding the mitigating role of technology (see, e.g., Heikkurinen, 2018; Ruuska & Heikkurinen, 2018). It is noteworthy that, despite the efficiencies achieved through technology, total global consumption and production have not declined but in stead have continued to climb (IEA, 2018). The efficiency requirements met thus far are of an order of magnitude not at all consistent with the harm caused by population and affluence. Locally reported benefits, such as the Finnish government’s reduced carbon emissions, are largely due to regional methods of measurement, where products and services produced and purchased elsewhere are not taken into account in the calculations. A wealth of recent research on the issue of technology and so-called decoupling has been published (e.g., Wiedmann et al., 2015; Heikkurinen, 2018; Giampietro, 2019; Hickel & Kallis, 2019; Parrique et al., 2019). In the context of Finnish social policy, Helne, Hirvilammi and Laatu (2012) have also written about the role of technology and the IPAT equation (see also Bonnedahl & Heikkurinen, 2019). The key argument these studies make is that economic growth has not been successfully decoupled from harmful environmental impacts, and no decoupling is within sight either.
The relationship between affluence and the destruction of the biosphere, in turn, has been linked in scientific debate to, for example, income levels (Ulvila & Pasanen, 2009; Ulvila & Wilén, 2017) and consumption (Brown & Cameron, 2000; Lorek & Fuchs, 2013; Bonnedahl & Caramujo, 2019). That is, affluence as measured by income level and amount of consumption is seen as the primary culprit for humans’ negative environmental impact. Also the quantitative increase in production and business activity has been criticized within sustainability research (Bonnedahl & Eriksson, 2007; Heikkurinen & Bonnedahl, 2013). The problem of growing affluence has also emerged in general debates, in efforts to reduce consumption in, among others, the media (e.g., the Finnish Broadcasting Company Yle, 2007; Kansan Uutiset, 2018), environmental organizations (e.g., WWF, 2019) and the international degrowth movement.
Of these three IPAT factors, population has received by far the least attention. This article looks at population size in relation to ecological sustainability and considers why the population issue has received so much less attention. The aim of the article is to increase understanding of the intersection of environmental policy and population policy, and to produce research-based information to support political dialogue and decision-making.
The starting point of the article is the assumption that social and economic sustainability depend on ecological sustainability (which refers in particular to the state of the biosphere, which allows for a continued life of biological diversity). In other words, without ecological sustainability, not one single society, economy, organization or individual can be sustainable – that is, a unit or system that is able to sustain diverse life. The assumption raises the key question of how nations and localities should respond to global challenges, such as the demographic explosion that has followed the Industrial Revolution (Figure 1).
Figure 1. World’s population from year 0 to 2100.
Source: UN, 1999; 2015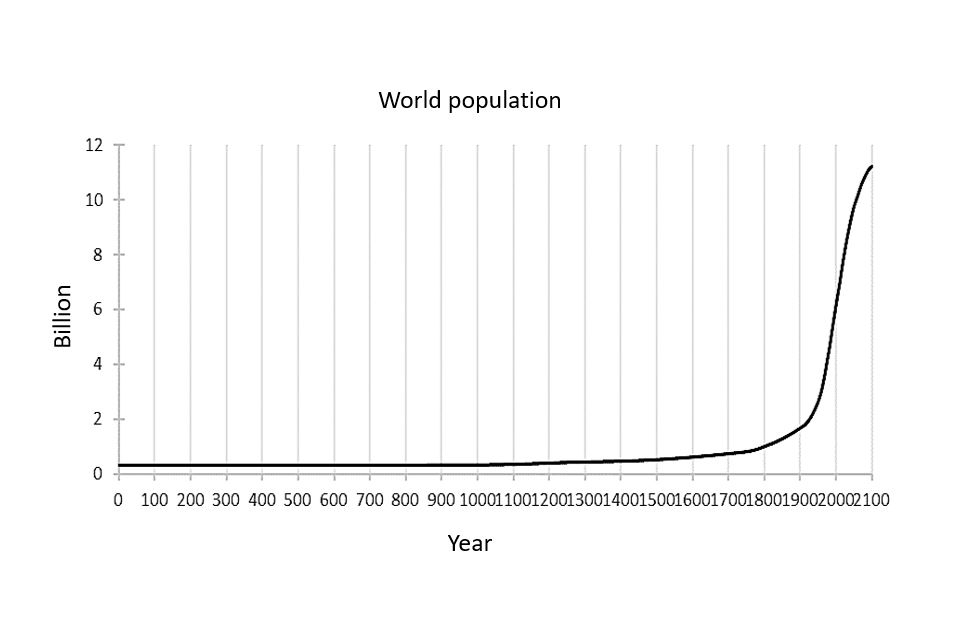
Back in 1800, the global population was still less than one billion, whereas now it is over 7.7 billion. This is a significant increase in the ecological footprint of the human species. A radical reduction in living standards could have a remedying effect on this undesirable development, as could the right kind of technological organization, but it is clear that each new human life translates to an increase in the collective environmental impact of the human species. In this context, it is worth noting that the ecological footprint of existing individuals and those yet to be born (and of cultures) can differ significantly from the average unit. As per the IPAT formula, it largely depends on the level of affluence of the unit under consideration. In other words, the more materially affluent the individual or culture in question, the more natural resources it consumes and the more harmful emissions it produces (including greenhouse gases), and the larger, therefore, its ecological footprint. To put it simply: if Community A lives 10 times more affluently than Community B, then Community B can have 10 times more people and yet the ecological footprints of A and B remain the same (ceteris paribus). The greatest environmental damage is therefore caused by communities and nations with a large number of affluent people with long lifespans.
For affluent nations and individuals in particular, it may be difficult to accept this fact because of guilt and shame, and also because consumption is seen as a right (e.g., Miller & Binding, 2019). One attempt to circumvent this fate is to think (through more advanced technological organization) that “even though I’m affluent, I don’t spend everything that I own” and that “I spend sustainably”. This kind of thinking is based, however, on two faulty assumptions. The first is the illusion that affluence can exist without it being consumed (either by oneself or by someone else) or that the accumulated wealth would not have had a negative impact on the environment at the time of its acquisition. In the current global, market-based and growth-based economic system, for example, all of the wealth deposited in banks is in constant use. It finances both the bank’s own investments and those of its customers, and the additional credit they need. In other words, in this monetary system, it is extremely difficult to own anything without it being used to grow the economy. If you deposit your salary or own a residential apartment, then this wealth of yours is indirectly being consumed through financial instruments.
Another misconception has to do with the myth of sustainable consumption. Qualitative improvements in products and services can only have a limited effect on the number of products and services. This is due to the so-called rebound effect, also known as the Jevons paradox (Jevons, 1906; Alcott, 2005), where the “saved” environmental benefit resulting from a higher-quality purchase decision is consumed elsewhere. In other words, we can eat vegetarian, drive an electric car, use public transit and live in an energy-efficient house, but if our total consumption (measured in income level or euros, for example) does not decrease, nor does our ecological footprint. The biosphere does not care about the way in which the resources it provides are being used. From the perspective of the continuation of life, what is important is the amount of resources that is used. Organically linked to this, of course, is how many people (or consumers) are using them. Associated with this misconception is also the utopia of immaterial consumption, where societies could maintain a high standard of living by shifting from the consumption of products to services. Unfortunately, however, no human activity has been successfully disconnected from a material- and energy-based reality. In other words, evidence of so-called “immaterial services” is lacking.
In Finnish economic policy debate, there is, of course, vocal concern regarding the growing number of people, but for a reason that is economic (aimed at maintaining and growing economic prosperity) rather than ecological. If there are no people in society – neither those who produce commodities nor those who consume them – the prospects for economic growth will deteriorate. And if the size of the economy does not grow, then the growth-based society attached to global markets will find it difficult, if not impossible, to raise or even maintain current living standards. In Finland, the concern over the declining birth rate is also connected to a concern regarding demographic change and the resulting insolvency of the pension system. The economic outlook is actually quite catastrophic in Finland, if the birth rate continues to decline (Figure 2). What will happen to Finland, still prospering at the moment, if it cannot keep up with the global economic competition?
Figure 2. Live births in Finland.
Source: Statistics Finland, 2019.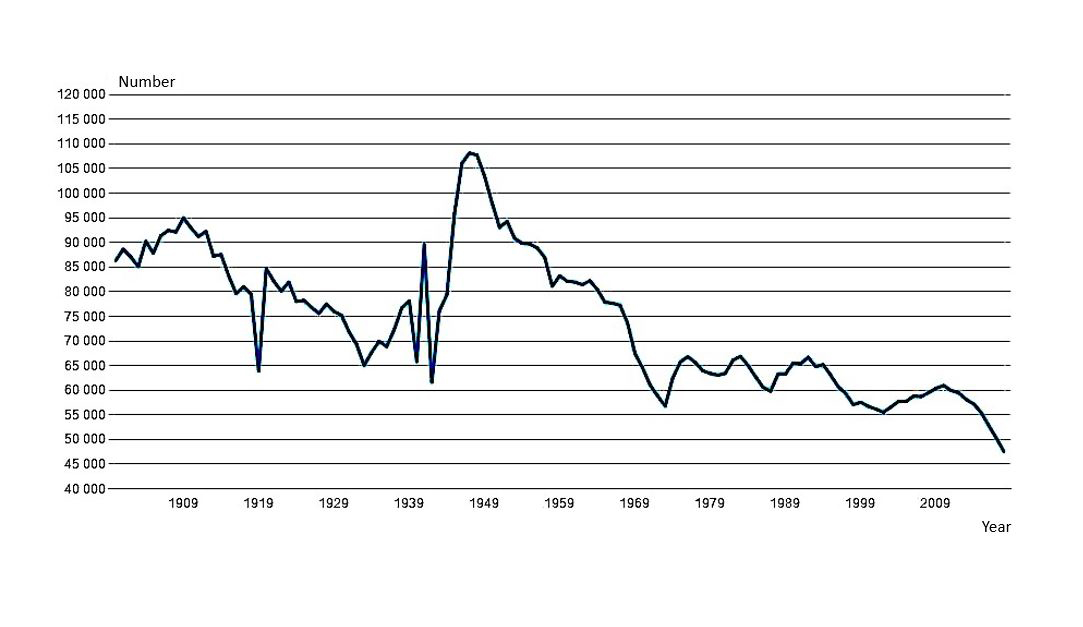
If, as predicted, the birth rate continues to fall in Finland and the standard of living collapses accordingly, the future looks promising from the standpoint of ecological sustainability. An economy that is based in growth is in constant need of more human and non-human resources, and if these are not available, it is assumed that the system will stall (Ruuska, 2017). The short-term disadvantages, of course, will affect people, but every slowdown and interruption in industry gives the biosphere a chance to recover (Ruuska & Heikkurinen, 2018). There is little cause for celebration, however, as Finland’s share of the world economy is quite small, even though per capita consumption in Finland is among the world’s highest. Another reason to restrain any enthusiasm is that the Finnish population continues to grow, and the decline caused by the birth rate will probably not be discernible in the country’s population numbers for a long time (Figure 3). The main reasons for this are the global migration stemming from climate change and the demographic change that now means an increase of more than 130 million people annually (World Bank, 2019). According to the UN population forecast (2015), we will approach 10 billion people globally within three decades, and by 2100, already more than 11 billion.
Figure 3. Population growth in Finland.
Source: Statistics Finland, 2019.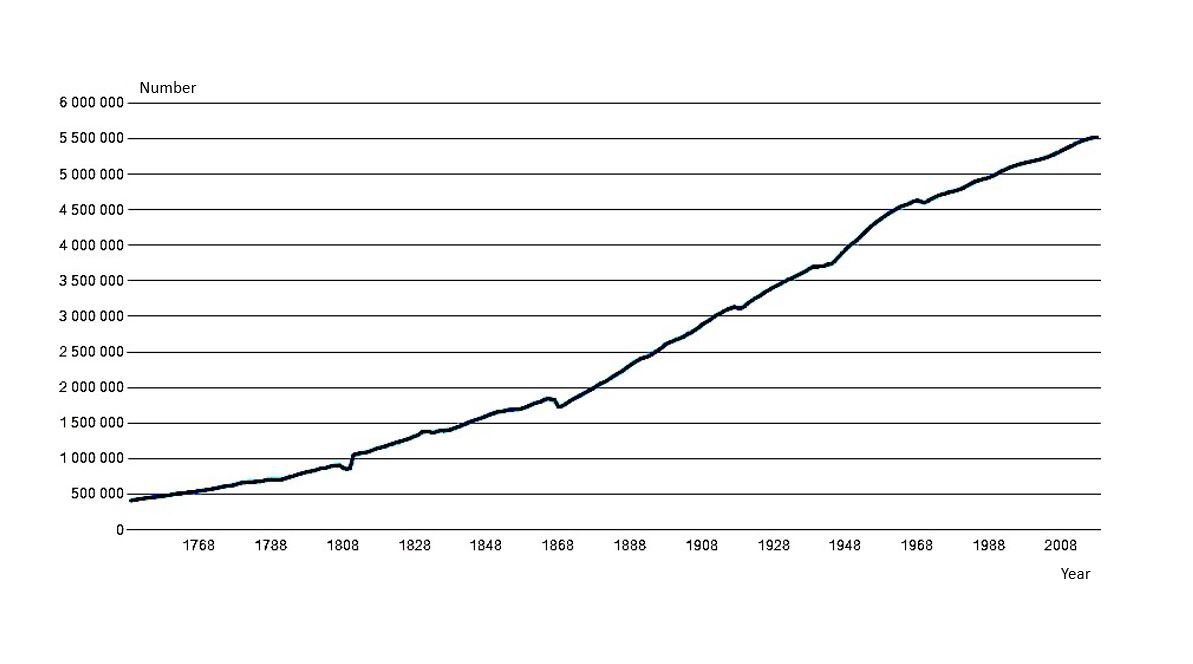
From an economic perspective, the concern regarding Finland’s birth rate may therefore not be necessary. If Finland continues as part of the global flows in which affluence and people move relatively freely, there will be enough of those who produce commodities and those who consume them. It is likely, however that these individual humans will not be native-born Finns. Viewed from a narrowly defined perspective of national identity or ethnicity (where there is a desire to preserve so-called Finnish genetic and cultural heritage), this may be seen as a problem, but economic issues are hardly affected. Capital does not look at skin color as long as the cogs of the economy stay in motion. Of course, the Finnish economy would benefit if the country’s own population were to grow – but from the perspective of ecological sustainability, a declining birth rate in this era of excessive consumption and reproduction increases the conditions necessary for the continuation of natural diversity.
The biosphere in particular is not interested in the ethnic origin of consumers, or any other demographic factors. It is entirely irrelevant from the standpoint of ecological sustainability who consumes resources and where. In terms of social sustainability, the issue becomes important. The more equally resources and living standards are distributed over time and space, the better the chances of social justice becoming a reality. But we have to remember that every social system is subordinate to the biosphere. In practice, this means that even if we were to distribute all of our affluence equally among all people (and were to repeat the same, in the event that resources once again accumulated unevenly), the problem of over-consumption would, unfortunately, not be eliminated. Nevertheless, over-consuming humanity and its affluent societies (including Finland) should simultaneously reduce their own total consumption while distributing their wealth more equally. From the ecological sustainability perspective, it is important that the overall standard of living begin to decline, but from the point of view of social sustainability, it is important that already existing wealth be distributed more equally.
Reducing total consumption requires lowering the standard of living in affluent societies considerably. Without question, Finland is one of these over-consuming countries. Our gross domestic product (at current market prices) was EUR 234.5 billion in 2018, which translates to EUR 42,504 per capita (Statistics Finland, 2019). Gross domestic product (GDP) has been found to correlate closely with ecological footprints (Daly, 1996; Victor, 2008; Jackson, 2009; Latouche, 2009) and it can still be used to measure the desired direction of national economies, albeit inversely. But the dystopian decoupling option, where the economy as expressed in GDP is declining but the ecological footprint is meanwhile not shrinking, cannot be ruled out as a possible future scenario.
When considering future developments, we must examine not only history and statistics, but also the entities and actors that enable change. On the one hand, there are the legislators who operate on the basis of longstanding democratic logic, and on the other hand, the companies and households that operate within the private sector, on the basis of market logic. In the third sector, again, civil society is setting standards from a foundation of socio-cultural development. In practice, the factors of change in Finnish society are not restricted to within any of these three sectors; instead, shared problems are defined and solved through politics and legislation as well as norms and market forces. Indeed, it would be absurd to argue that something that is closely linked to sustainability, such as the population issue, should be addressed in only one area of society. Just as the problem created by affluence cannot be left to consumers and businesses alone to solve, neither can the issue of population change be excluded from the public debate. And yet, the problems of population growth are often silenced by shoving the responsibility onto individuals.
It is safe to immerse oneself in the utopian idea that the human species can always solve any problems that emerge through technology.
For example, the journalist David Roberts (2018) lists the reasons for why he has chosen not to talk about population growth in the context of environmental problems, even though he acknowledges the link between population growth and the ecological footprint. The most central idea perhaps is that by focusing on different instruments (such as the education of girls), population growth can be slowed and even reduced without even being discussed. This is a kind of hidden strategy of environmental social policy, which on the one hand reduces the chance of moral and political conflict, but on the other hand prevents transparency in moral and political activities. This approach is probably politically feasible – but the idea that we can solve a demographic problem without ever talking about it seems peculiar. Do we really need to create hidden agendas?
The risks that Roberts and many others are seeking to avoid through this strategy are the necessary and serious concerns of our times. In his writing, he links the population issue to “racism, xenophobia, or eugenics”. According to Roberts, discussions of population growth mean exactly the desire to reduce the number of certain population groups. This kind of divided purpose is probably not present among those who speak out about population growth. Also, it is quite problematic if we must be silent specifically about the most painful things. It was only a decade or so ago that it was difficult to discuss economic growth in critical tones because it was seen as leading to communism. Now, there are those who find a link between discussions of population growth and fascism.
The opinions of David Roberts are, of course, probably driven by an altruistic concern for justice between human beings, as well as some kind of awakening to the fact that humans needs a biosphere in order to continue life. But many who speak the p-word (for ‘population’) may have a (more or less) selfish fear of being stigmatized. Especially in certain social contexts, norms sharply forbid talking about population growth. If you mention it out loud, you may be a labeled racist, xenophobe or eugenicist. The fear of being stigmatized is therefore a real one and probably explains in part why public debate on population growth is nearly non-existent.
The widespread techno-optimism that prevails within current environmental policy also promotes the silence around the population issue. It is safe to immerse oneself in the utopian idea that the human race (and especially innovative societies such as Finland) will always be able to solve the problems ahead with technology. Even though there is no empirical evidence for the state of the biosphere improving, except in very localized instances, the techno-optimism remains popular. This is probably precisely because it allows individuals and communities to avoid the need to radically change their present values and attitudes, or their actions and structures. In the economic policy arena, on the other hand, population growth is not addressed critically except in the opposite sense (for example, the encouragement by former Finnish prime minister Antti Rinne that women start giving birth more). This is
probably because population growth bolsters economic growth. The believers in the economy do not want to see a decline in Finland’s population, and those critical of the economy do not want to talk about population size, because the capitalist economic system increases consumption so much that population growth is not considered a relevant factor.
In many sustainability debates, ecological and social justice become equated, or ecology is made subordinate to social sustainability. That is, instead of viewing social sustainability as subordinate to ecological sustainability, those writings may be based on a short-sighted and human-centered worldview where ecological and longterm goals do not rise up to or surpass current human objectives. In this kind of thinking, human beings are seen as a species above all others, and the current generations as more important than future generations, making it possible to justify even acts that have been found to harm other species and future generations of people.
Finally, it is clear that the material standard of living must fall considerably, both in Finland and globally, if we want to create changes that will support the continuation of diverse life on Earth. Affluence (measured by, for example, GDP and income levels, as well as consumption) is the single most important factor in ecological sustainability, as it can be influenced quickly and without resorting to inhumane solutions. On the other hand, according to the IPAT formula, if the birth rate and population are reduced, then the standard of living does not have to decrease. The most effective and longterm method is to consider both factors (PxA). Before potential solutions can be discussed constructively, the participants in the discussion must share a sufficient understanding of the causes of the ecological footprint. Climate denialism appears to be waning in Finland, but the next challenge is to address the denial of the causes behind the destruction of the biosphere. So how do we get people in the private, public and third sectors to take up the problems of affluence and population growth?
Unless the factors by which humans impact the environment and that have been put forward by the international scientific community are accepted as a basis for the discussion, both national and global political dialogue as well as all measures to ensure the continuity of life are destined to fail. This is because either people will agree and do things that are not sufficient to reduce the ecological footprint, or because the presented solutions sound absurd (see, e.g., Wynes & Nicholas, 2017) because there is a lack of a shared understanding of the entirety of the problem. In portraying the problem, not only scientific (such as ecological and biological) approaches, but also those in the human sciences (anthropology, sociology and economics) must be incorporated when the problem is formulated, so that the contemporary diagnosis is as scientifically inclusive as possible.
From the point of view of sustainability, Finnish population policy is now at the center of social, economic and environmental policy. The big challenge for the next decade will be to engage in a debate on population growth in a way that takes into account both local and global developments in any instruments or solutions that are proposed.
References
Alcott, B. (2005). Jevons’ paradox. Ecological Economics, 54(1), 9–21.
Barnosky, A. D., Hadly, E. A., Bascompte, J., Berlow, E. L., Brown, J. H., Fortelius, M., .. & Martinez, N. D. (2012). Approaching a state shift in Earth’s biosphere. Nature, 486(7401), 52.
Barnosky, A. D., Matzke, N., Tomiya, S., Wogan, G. O., Swartz, B., Quental, T. B., … & Mersey, B. (2011). Has the Earth’s sixth mass extinction already arrived? Nature, 471(7336), 51.
Bonnedahl, K. J., & Caramujo, M. J. (2019). Beyond an absolving role for sustainable development: Assessing consumption as a basis for sustainable societies. Sustainable Development, 27(1), 61–68.
Bonnedahl, K. J., & Eriksson, J. (2007). Sustainable economic organisation: simply a matter of reconceptualisation or a need for a new ethics? International Journal of Innovation and Sustainable Development, 2(1), 97–115.
Bonnedahl, K. J., & Heikkurinen, P. (eds.). (2019). Strongly sustainable societies: Organising human activities on a hot and full earth. Routledge.
Brown, P. M., & Cameron, L. D. (2000). What can be done to reduce overconsumption? Ecological Economics, 32(1), 27–41.
Capra, F. (1996). The web of life: A new scientific understanding of living systems. Anchor.
Ceballos, G., Ehrlich, P. R., Barnosky, A. D., García, A., Pringle, R. M., & Palmer, T. M. (2015). Accelerated modern human–induced species losses: Entering the sixth mass extinction. Science Advances, 1(5), e1400253.
Chertow, M. R. (2000). The IPAT equation and its variants. Journal of Industrial Ecology, 4(4), 13–29. Daly, H. E. (1996). Beyond growth: the economics of sustainable development. Beacon Press.
Ehrlich, P. R., & Ehrlich, A. H. (2013). Can a collapse of global civilization be avoided? Proceedings of the Royal Society B: Biological Sciences, 280(1754), 20122845.
Giampietro, M. (2019). On the Circular Bioeconomy and Decoupling: Implications for Sustainable Growth. Ecological Economics, 162, 143–156.
Heikkurinen, P. (2014). Kestävyyden käsitteen ulottuvuudet. Tieteessä tapahtuu, 32(4).
Heikkurinen, P. (2018). Degrowth by means of technology? A treatise for an ethos of releasement. Journal of Cleaner Production, 197, 1654–1665.
Heikkurinen, P., & Bonnedahl, K.J. (2013). Corporate responsibility for sustainable development: a review and conceptual comparison of market-and stakeholder-oriented strategies. Journal of Cleaner Production, 43, 191–198.
Heikkurinen, P., Rinkinen, J., Järvensivu, T., Wilén, K., & Ruuska, T. (2016). Organising in the Anthropocene: an ontological outline for ecocentric theorising. Journal of Cleaner Production, 113, 705–714.
Helne, T., Hirvilammi, T. & Laatu, M. (2012). Sosiaalipolitiikka rajallisella maapallolla. Kela, the Social Insurance Institution of Finland, Research Unit.
Hickel, J., & Kallis, G. (2019). Is Green Growth Possible? New Political Economy, 1–18.
Holdren, J. P. (2018). A brief history of “IPAT”. The Journal of Population and Sustainability, 2(2), 66–74.
Holdren, J. P. & Ehrlich, P. R. (1974). Human population and the global environment: Population growth, rising per capita material consumption, and disruptive technologies have made civilization a global ecological force. American Scientist, 62(3), 282–292.
IEA (2018). Global energy & CO2 status report 2017. Retrieved from https://webstore.iea.org/global-energy-co2-status-report-2017.
Jackson, T. (2009). Prosperity without growth: Economics for a finite planet. Earthscan.
Jevons, W. S. (1906). The coal question: an inquiry concerning the progress of the nation, and the probable exhaustion of our coal-mines. The Macmillan Company.
Kansan uutiset (1.8.2018). Ylikulutus uhkaa terveyttä – suomalaiset syövät maapallon 3,6-kertaisesti. Retrieved from https://www.kansanuutiset.fi/artikkeli/3939119-ylikulutus-uhkaa-terveytta-suomalaiset-syovat-maapallon-36-kertaisesti
Latouche, S. (2009). Farewell to growth. Polity.
Lorek, S., & Fuchs, D. (2013). Strong sustainable consumption governance–precondition for a degrowth path? Journal of Cleaner Production, 38, 36–43.
Miller, J. C. & Stovall, T. (2019). The “right to consume”? Re-thinking the dynamics of exclusion/inclusion in consumer society. Consumption Markets & Culture, 1–14.
Parrique T., Barth J., Briens F., C. Kerschner, Kraus-Polk A., Kuokkanen A. & Spangenberg J.H. (2019). Decoupling debunked: Evidence and arguments against green growth as a sole strategy for sustainability. European Environmental Bureau. Retrieved from https://eeb.org/library/decoupling-debunked/
Roberts, D. (29.11.2018). I’m an environmental journalist, but I never write about overpopulation. Here’s why. Vox. Retrieved from https://www.vox.com/energy-and-environment/2017/9/26/16356524/the-population-question.
Ruuska, T. (2017). Reproduction of capitalism in the 21st century: Higher education and ecological crisis. Aalto University School of Business.
Ruuska, T., & Heikkurinen, P. (2018). Väkivalta ihmisen aikakaudella. Tieteessä tapahtuu, 36(3): 11–16.
Statistics Finland (2019). Tilastot. Retrieved from https://www.stat.fi/ “ and “ Ulvila, M. &
Pasanen, J. (ed.) (2009). Sustainable Futures: Replacing Growth Imperative and Hierarchies with Sustainable Ways. Ministry for Foreign Affairs of Finland.
Ulvila, M. & Wilén, K. (2017). Engaging with Plutocene: moving towards degrowth and post-capitalistic futures. In: P. Heikkurinen (ed.), Sustainability and Peaceful Coexistence for the Anthropocene. Routledge.
UN (2015). World Population Prospects: The 2015 Revision.
UN DESA report, “World Population Prospects: The 2015 Revision. Retrieved from https://www.un.org/en/development/desa/publications/world-population-prospects-2015-revision.html
Victor, P. A. (2008). Managing without growth: slower by design, not disaster. Edward Elgar Publishing.
Wake, D. B., & Vredenburg, V. T. (2008). Are we in the midst of the sixth mass extinction? A view from the world of amphibians. Proceedings of the National Academy of Sciences, 105, 11466–11473.
Wiedmann, T. O., Schandl, H., Lenzen, M., Moran, D., Suh, S., West, J. & Kanemoto, K. (2015). The material footprint of nations. Proceedings of the National Academy of Sciences, 112(20), 6271–6276.
World Bank (2019). Health, Nutrition and Population: Population Dashboard. Retrieved from http://datatopics. worldbank.org/health/population
Wynes, S., & Nicholas, K. A. (2017). The climate mitigation gap: education and government recommendations miss the most effective individual actions. Environmental Research Letters, 12(7), 074024.
WWF (2019). Ylikulutuksen vaikutukset. Retrieved from https://wwf.fi/uhat/ylikulutus/
Yle (27.9.2007). Kulutuksen vähentäminen auttaa ympäristöä. Available at https://yle.fi/aihe/artikkeli/2007/09/27/kulutuksen-vahentaminen-auttaa-ymparistoa
Ecological parenthood leading the way to a more environmentally friendly world (Taru Kivelä)
Recently, a lot of public debate has swirled around the climate consequences of having children. A study conducted at Lund University in 2017 calculated the impact of various environmental choices in combating climate change. According to the study, the biggest emission reductions would be obtained by having one less child.
The method of measurement used in the study has been questioned and criticized, however, for calculating the emissions produced by children multiple times. In the carbon footprints of children was also included the carbon footprints of their offspring, meaning that the climate effects of having children would still be evident many decades later.
In addition, the decision to have or not to have a child is not a consumption decision that can equated with long-distance travel, being a vegetarian or driving a car, because for many people it is connected to one of the greatest, most meaningful aspects of their lives – to creating human life, to love.
Climate change is a problem from the standpoint of human life, above all. Our planet would be saved without people. A planet without any people, of course, is not the goal in halting climate change. What we want is to save the Earth for future generations. It is important to remember that acknowledging and protecting the climate does not preclude the possibility of having children. Making people feel guilty about having children or avoiding having any for climate reasons is not a sustainable solution. Combating climate change and having a family can go hand in hand. Forgoing children is also not a sustainable solution for demographic development or sustainable population policy, because we need more children, not fewer.
The birth rate in Finland has fallen rapidly since the 2010s. The total fertility rate has decreased so that in 2018 it was only 1.40 children per one woman. At the turn of the decade, the figure was still 1.87. The declining birth rate is changing the structure of society and has far-reaching implications for the economy, workforce and intergenerational equality. Thanks to immigration, Finland’s population has continued to grow despite the low birth rate. It is currently estimated that the population will begin to decline in the 2030s.
Birth rates seem to have turned toward slight growth, as the declining figures leveled off at the turn of 2020. However, we have moved far away from the figures of the beginning of the millennium. Nor do we yet know the potential effects of the COVID-19 pandemic on birth rates.
The decision to have or not to have a child is not a consumption decision that can be equated with long-distance travel, being a vegetarian or driving a car, because for many people it is connected to one of the greatest, most meaningful aspects of their lives – to creating human life, to love.
According to Väestöliitto‘s 2015 Family Barometer, the main reason for the declining birth rate is the increase in the number of people without children. Among the factors that are contributing to this situation is that people are postponing having children for several reasons. According to Väestöliitto‘s 2017 Family Barometer, those reasons included not having a spouse, financial reasons, the demands of work and negative perceptions regarding the lives of families with children.
The low birth rate can be addressed by removing barriers to childbearing and finding various ways to encourage people and make it easier for them to have children. A child- and family-friendly society fosters understanding of the diversity of families and supports the aspirations of different people to have children. It is also important to take into account people’s desires regarding family size and having children, and, on the other hand, to accept the right of individuals to choose not to have any children.
All parents want to ensure that their children will have good living conditions. We can strive for ecologically sustainable choices and decisions in order to maintain good living conditions and preserve the environment. That is why climate-conscious people decide to have children, and do so with a good conscience – especially if they raise their children ecologically.
We can combat climate change through other means than having fewer children. This is something we have to do anyway, because the environment cannot withstand the current pressures, and our social structures cannot withstand the dwindling size of our generations (see the chapter by Tikanmäki and Seuri in this report). Ecological parenthood is a prerequisite
for having a sustainable future.
How can parents ensure their families are ecological through the choices they make?
People can consciously influence many of their choices, such as having children, the number of children, or the way they consume. When they have children, parents are faced with a number of choices. Their own perceptions, desires and thoughts regarding what it is to be a good parent or to have a good life, and the opportunities to achieve these things guide the choices that families make about the kind of life they live and the values they pass on to children.
Parents generally want what is best for their children, and faced with their new life situation, will consider the kinds of life or opportunities they are able to offer their children. Parents adopt models and lessons that they deem appropriate on the basis of their own experiences, learned from their own parents, or picked up along the way, and repeat, reject or modify them to suit their own lives.
Parents influence the ecological behavior of their families in many ways through their choices as consumers. If recycling, avoiding unnecessary shopping, careful consumption, and choosing ethical and ecologically produced products are part of family life, they will also become the normal, ordinary, day-to-day life of the family.
Parents’ attitudes regarding the environment and consumption reinforce the way their children, too, will view them. If parents make thoughtful and sustainable shopping decisions and consumption choices, children will have an accepted model that lays the foundation for ecological living. By making choices and taking actions that are as environmentally friendly as possible, parents can teach their children an ecological lifestyle from an early age. An ecological mindset thus becomes the family’s way of life, where ecology is taken into account in all choices by always selecting the option that has the smallest environmental footprint.
Children tend to increase a family’s consumption in multiple ways. An enormous amount of goods are available to new parents for dealing with their new life situation. This can create pressure to consume, because it can be difficult to assess in the new circumstances what purchases are necessary. Many of the items and equipment for small children are used for only a short time, and sometimes they prove unnecessary.
Certain purchases are, of course, necessary, including prams and strollers, various supplies and children’s clothing. Fortunately, it is relatively easy to recycle these items. Flea markets offer a wide selection of well-maintained children’s clothing and necessities, and the used items can also be recycled further. Recycling is a good solution also when the quantity of things
begins to feel distressing or when one wants to eliminate unnecessary items and curb consumption.
Attitudes regarding recycling have changed with so many durable goods in good condition being available. As our awareness about the climate increases, sustainable and ecologically produced goods are valued more. This can help people’s willingness to recycle. In the best-case scenario, having a child opens the door to the world of recycled goods and fosters an ecological lifestyle in families.
Attitudes toward consumption and the ownership and procurement of goods are, of course, tied to culture. For example, giving gifts on birthdays and Christmas is an important part of our shared culture. Many people, however, are questioning these traditions and wonder if it makes sense to buy new things for people who don’t want or need them. Immaterial gifts are popular, and many people highlight the happiness derived from experiences and shared participation, as opposed to ownership. Recycled gifts have also become more common at children’s birthday parties, and many try to find ways to get children’s attention away from giving gifts so that they are not the sole focus of celebrations.
The current ideal of ecology replicates the situation of earlier decades, when people had fewer things, every item was valued and things lasted longer. The concept of Konmari, of giving up useless stuff, has permeated for many families. Often, for example, families and their neighbors will share things like cars or other utility items. Ecological considerations can also be reflected
in, for example, a family’s travel choices, the choice of travel destination or restaurant, always selecting the most ecological option.
On the other hand, there are differences in the ability of different families to influence their consumption. Parents of low-income families may feel that they cannot make ecological consumption choices for economic reasons even if they would like to. Other parents may be so busy for various reasons that they find themselves unable to take ecology into consideration in their consumption choices. It is often cheaper and easier to buy a more cheaply produced item. On the other hand, large families are often already living quite ecologically due to their multiple children, as they cannot afford to travel or consume, or overload the environment excessively. In addition, families with a large number of children frequently recycle their children’s clothing and necessities.
Having children is a good time to think about the ecology of the whole family. With young children, less is often necessary. Quality time for families can consist of spending plenty of unhurried time together and of ordinary, everyday moments. Expensive holidays are not always needed, and a trip on the train can be a major experience for a child. Traveling with young children is often difficult, and becoming acquainted with your own neighborhood and environs can be meaningful enough.
The future climate-friendly decisions will be made by children who were raised with particular sets of values. As voters, citizens and influencers, the children who grow into adults carry on the values learned from their own families into the future.
Children raised with an ecological mindset become adult actors
Parents can influence their children’s values and attitudes through their own choices. Children learn from the model and the example set by their parents. If the family’s consumption choices are guided by ecological considerations, then ecology will be passed on as a value to its children.
The future climate-friendly decisions will be made by children who were raised with particular sets of values. As voters, citizens and influencers, the children who grow into adults carry on the values learned from their own families into the future.
Newer generations often reject the ideologies of their parents. Today’s young people are much more aware of the importance of ecology and its objectives compared to previous generations. When it comes to ecology, young people are also acting as models for their parents. They are making more informed choices – for example, avoiding flying for environmental reasons is quite common for many young people.
The young climate activist Greta Thunberg has given rise to a climate strike movement of millions of other young people and has urged the world’s leaders to take measures to benefit the environment. The new, environmentally conscious generation inspired by Greta Thunberg is a beacon of hope for us all, showing that it is still possible to help preserve the climate and the environment for future generations.
The interaction of families and politics
Public awareness of the threats posed by climate change and environmental pollution has increased dramatically in recent years. More and more people are anxious for the environment and are making more and more climate-conscious choices in their own lives.
How important are the climate attitudes of families or individual consumers, compared to political decision-making? What affects climate change – the wise choices made by people or the decisions made by politicians? Or both? Until now at least, it has not been enough to simply rely on people’s own, sensible decisions – climate change has advanced quite a bit already. On the other hand, changing people’s attitudes certainly matters, though it does not seem to be enough by itself to curb climate change.
According to a climate science report published by the World Meteorological Organization (WMO) in 2019, the years 2014–2019 have been the warmest in history. The report states that climate emissions have only increased in recent years. Finland is committed to the Paris Agreement adopted in 2015, which aims to slow global warming, reduce emissions and support low-carbon, climate-sustaining development.
Many experts estimate that it is already too late to stop climate change, and that we can only slow its progression. If everyone works together to promote common goals in protecting the climate and the environment, there is a chance that we can make a difference. If global emissions decline, so will the rise in global average temperatures.
In 2020, it is estimated that Finland can achieve the carbon neutrality target of the Paris Agreement by 2035. The goal can be achieved by reducing greenhouse gas emissions and eliminating carbon dioxide from the atmosphere. Slowing down climate change and protecting the environment requires shared responsibility and action, both from individuals and from society.
We do not yet know the effects of the COVID-19 pandemic on climate change. So far, during the pandemic, climate emissions have decreased. We have also found that people can be influenced to change their behavior through political decisions and restrictions more quickly than by relying on their individual decisions and choices. Perhaps one day we will address the climate change crisis with the same seriousness, and with the substantive actions that individuals and the political establishment have now undertaken together to address the pandemic caused by the coronavirus.
Final words - How will the COVID-19 pandemic affect the population and population policy?
When Väestöliitto’s new population policy program began in 2018, none of the authors could have foreseen the exceptional circumstances in which it would be published. In the course of 2018 and 2019, we held discussion sessions with the experts who participated in the report and the general public, and the report’s chapters were largely written before the first person in Finland had ever even contracted COVID-19.
So far, Finland has survived the effects of the coronavirus pandemic relatively well. As a nation, we can be proud that mortality did not increase in Finland during 2020. This, in itself, is a sign of a functioning health policy. The pandemic also highlighted the agency of nations and populations. The countries that responded resolutely and in a timely manner to the threat of a pandemic, and the populations that trusted and followed the recommendations of their decision-makers and authorities, have so far been spared the worst effects of the pandemic.
No one yet knows how long the pandemic will last and what its longer-term consequences will be for the world economy or the efforts against the climate crisis. While most of the trends and visions presented in the report have remained the same, the COVID-19 pandemic is such a major social crisis that it affects almost every aspect of human life. It seemed wrong therefore to publish a report right now that did not take into account at all the effects of the pandemic on the population and on population policy.
Indeed, some of the authors made adjustments to their chapters at our request. Below, we present their views on how the coronavirus and the societal changes it causes affect the themes discussed in the chapters. These are comments made in the summer 2020, in the middle of the pandemic. In a year’s time, many things will certainly appear in a different light. But already we have learned that public health and the national economy walk hand in hand. We have learned that the well-being of the population is the most important policy factor and policy goal.
The COVID-19 crisis and having children
According to preliminary data from Statistics Finland, hundreds more babies were born in Finland in early 2020 than during the corresponding period in 2019. We continue to be a country with a low birth rate, but the long-lasting decline in the birth rate was reversed prior to the pandemic. The effects of the “Covid Spring” on Finland’s birth rate will not be seen until 2021.
Among young adults, having children is affected by the current uncertainty and optimism they feel vis-à-vis the future. The anxiety and the economic shock caused by the pandemic are likely to fuel uncertainty.
In an Italian study published in spring 2020, Luppi and colleagues examined the first effects of the pandemic and of social restrictions on plans to have children among young adults aged 18–34 in five European countries: Italy, Germany, France, Spain and the United Kingdom. The study was conducted in the form of an online survey in March–April, and the respondents were people who had expressed, prior to the onset of the crisis, plans to have a child in 2020. In all studied countries, the spring of COVID-19 reduced people’s intentions to have children.
In countries with a better labor market and economic situation before the crisis, the share of those who abandoned their plans to have a child was clearly lower than in the other countries studied. In addition, the risk of lower birth rates as a result of the effects of the crisis in countries with an already low birth rate is higher. Concerns about one’s own reduced income and of the economy’s future instability also dampened young adults’ plans to add to the family.
The economic consequences of the coronavirus pandemic are likely to lower birth rates in affluent countries. Finland, already a country with low birth rates and high childlessness, is in a particularly vulnerable position. There may, of course, be smaller baby booms in certain groups: for example, working remotely from home with one’s partner may lead to discussions about whether or not to have children. But the effects of bankruptcies and layoffs affect much wider swaths of people. It is also possible that a well-managed pandemic and the associated strong sense of community will fuel faith in the future and encourage building families.
Anna Rotkirch
The COVID-19 crisis and immigration
The pandemic caused by the coronavirus will affect everyone and everything in the short term. It remains to be seen how it will affect societies and how they function in the long term. Already, we can see several possible developmental trends.
The COVID-19 pandemic will reduce the movement of people and goods for a few years. The slowing down of international trade can lead to two opposite effects. People may wake up to the ways in which the reduction in the movement of goods and people caused by the coronavirus make life more difficult. For example, an industrial company may notice in a tangible way how problems with the availability of Chinese components can cause problems in the production process. On the other hand, for example, Finnish consumers will experience problems with the availability of Finnish vegetables or berries or rising prices resulting from the shortage of foreign seasonal labor. People are realizing the importance of international trade.
On the other hand, the coronavirus pandemic is causing a deep recession in most countries around the world. This increases unemployment as well as economic deprivation and thus further exacerbates the uncertainty about the future. This kind of environment fuels support for populist or anti-immigration movements. It is possible that these types of developments, were they to go far enough, would complicate immigration policy reforms and cause other social problems for the immigrant population already in the country.
Mauri Kotamäki
An epidemic, emergency circumstances and inequalities in health
It is important to determine the impact of the COVID-19 pandemic when designing measures to prevent common chronic diseases, promote functional capacity and reduce health disparities. Previously identified factors and structures that promote inequality may become even more pronounced in the context of an epidemic. The measures necessary to limit the spread of the coronavirus epidemic are likely to erode things like livelihoods, employment and social activities. Delays and cancellations in the diagnosis and treatment of chronic diseases can also lead to problems becoming more complex and the service system becoming overburdened. As public debt is simultaneously growing rapidly, the state and municipalities will be in a worse-than-expected financial position in the future in paying for the costs of care and treatment services as well as benefits for the growing elderly population, as well as patients with multiple illnesses and those with disabilities.
The emergency circumstances have affected the living conditions and lifestyles of different population groups in different ways. Also regional differences in the occurrence of COVID-19 have been significant so far. As is the case with many other infections, the consequences from COVID-19 are the most severe for people with chronic diseases. This can be reflected in both mortality and ability to work and, in particular, the functional ability of older people.
At their worst, the effects of the coronavirus epidemic can be quite long-lasting, as demonstrated by the 1990s recession and the methods for its management. We must ensure that, in the future, we have an adequate and reliable knowledge base regarding the health and well-being (and the factors that affect them) of the population and all its subgroups as a basis for assessing the impact of the epidemic and the reorganization of services. Measures that reduce health inequalities on multiple levels are particularly important in the present context.
Author of the chapter on health inequalities
The COVID-19 crisis and the financing of pensions in the future
The COVID-19 crisis can affect the financial outlook for pensions in a number of ways. Returns on equities and other pension investments fluctuate dramatically in times of crisis. If the value of investments settles at an extremely low level after the crisis, this will make it more difficult to finance pensions in the future. The decline in employment reduces the amount of pension contributions, but on the other hand, less pension is also accrued. This means lower pensions for those with long-term interruptions in work as a result of the crisis.
There are also indications that the crisis could bring about some early retirement. Pension benefits that have already accrued are protected, so in an uncertain situation, the risk of future economic development is shouldered by current and future working-age populations. For the time being, we can only guess at the effects of the COVID-19 crisis on future demographic trends. At the time of writing, overall mortality in Finland has not increased. The crisis may also have an impact on birth rates and immigration and emigration, in both the short and long term. The birth rates and immigration of the years and decades to come form the basis for financing our future pensions. Still, the impact of one exceptional year of figures in birth or migration on the financing of pensions is limited.
Heikki Tikanmäki